Bullish News
Collection
CapitaLand India Trust Targets $1 Billion Onshore Debt Shift and Increased Bond Fundraising
**Market Brief: CapitaLand India Trust (CLINT) Strategic Update** **Financial Performance & Market Data** As of early February 2026, CapitaLand India Trust (CLINT) reports robust growth, with FY 2025 Distribution Per Unit (DPU) rising **15%** year-on-year to **7.87 Singapore cents**. This translates to a distribution yield of approximately **6.5%** based on the year-end closing price of **S$1.22**. Net Property Income (NPI) for the full year climbed **16%** to **INR 14.9 billion**, driven by higher rental income and improved operating margins. The trust recently closed trading around **S$1.29**, reflecting positive market sentiment following these strong results. **Debt Strategy: Onshoring Focus** CLINT is aggressively executing its debt onshoring strategy to capitalize on tax efficiencies and a favorable interest rate environment. Key recent milestones include: * **Maiden Bond Issuance:** Issued its first onshore bond in India on January 2, 2026, raising **INR 9.15 billion** with a **7.25%** coupon. The bond secured a **AAA** rating from Crisil. * **Sustainability Loans:** Signed two onshore sustainability-linked loans totaling **INR 21 billion (S$300 million)**. These moves are designed to hedge against currency risks and reduce overall funding costs, directly supporting income available for distribution. **Asset Recycling & Capital Management** The trust continues to unlock value through strategic divestments to fund higher-growth opportunities: * **IT Park Exits:** Completed the sale of CyberPearl (Hyderabad) and CyberVale (Chennai) in September 2025 for approximately **INR 11 billion (S$161.7 million)**. * **Data Centre Stake Sale:** Announced the divestment of a **20.2% stake** in three data centers under development to the CapitaLand India Data Centre Fund (CIDCF). This transaction, valued at nearly **INR 7.02 billion (S$99.7 million)**, is expected to close by late February 2026. **Data Centre & Portfolio Expansion** CLINT is rapidly scaling its digital infrastructure footprint. The first tower at CapitaLand Data Centre Navi Mumbai was completed in August 2025, and Tower 2 has been fully pre-leased to a global hyperscaler. Development projects remain on track: * **Bangalore:** Construction of MTB 7 at International Tech Park Bangalore is scheduled for completion in **3Q 2027**. * **Hyderabad:** Redevelopment of the Orion building is targeting a **4Q 2028** finish. This blended strategy of active capital recycling, debt optimization, and high-growth asset development positions CLINT to deliver sustainable long-term returns. *** **Next Step:** I can provide a comparative analysis of CLINT's recent debt issuance against other Indian REITs or detail the specific tax benefits of their onshoring strategy.
Walmart Reaches $1 Trillion Market Capitalization
**Walmart Hits Historic $1 Trillion Milestone** **Walmart (WMT)** officially became the first retailer in history to surpass a **$1 trillion** market valuation on Tuesday, February 3, 2026. Shares climbed to an intraday high of **$126**, securing the company’s spot in the exclusive "trillion-dollar club" alongside tech giants like Apple and Microsoft. This achievement marks Walmart as only the second non-tech U.S. firm (after Berkshire Hathaway) to reach this level. **Market Performance** The retail giant is riding a massive wave of momentum, with stock prices jumping nearly **26%** over the last 12 months and **13%** in 2026 alone. This rally was fueled by a strategic pivot toward high-margin revenue streams, including its booming advertising division and a **20%+** surge in e-commerce sales. **Key Drivers** * **Tech & AI Integration:** Heavy investment in AI automation and supply chain tech has improved margins, while a recent partnership with OpenAI is modernizing the shopper experience. * **Walmart+ Growth:** Membership hit a record **28.4 million** in January 2026, creating a recurring revenue moat similar to Amazon Prime. * **Nasdaq-100 Inclusion:** The stock’s recent addition to the tech-heavy Nasdaq-100 index (replacing AstraZeneca) has further boosted investor demand. **What It Means** Walmart has successfully shed its "brick-and-mortar only" image. By combining value-driven pricing for inflation-weary shoppers with aggressive digital expansion, the company has convinced Wall Street it can compete directly with Amazon on profitability and scale. Analysts remain bullish, with recent price targets raised to **$130+** as the company continues to execute its omnichannel strategy.
10 Key Factors to Watch for Wednesday's Stock Market Session
Market Snapshot: February 3, 2026 **Index Performance** Nifty witnessed a dramatic session, opening with a massive gap-up at **26,308** driven by the historic India-US trade deal. However, the index saw significant profit-taking from higher levels, shedding over **600 points** from the intraday high of **26,341** to close near **25,713**. Despite the intraday sell-off, the benchmark ended with a strong gain of approximately **2.5%**. **Volatility & Sentiment** Market sentiment remains broadly positive, transitioning to a "buy-on-dips" texture. The cooling of anxiety is visible in the India VIX, which dropped nearly **6%** to settle around **13.05**, indicating reduced fear among traders. Momentum indicators suggest that while the immediate euphoria has settled, the trend remains structurally bullish as long as key supports hold. **Technical Levels** The index successfully defended the **25,200** zone, which aligns with the critical 200-day moving average. Analysts highlight **25,300** as the immediate support to watch. On the upside, the **25,800–26,000** band acts as the renewed resistance zone following the intraday rejection. **Sectoral Movers** Heavyweights orchestrated the initial surge, with **Power Grid** and **Reliance Industries** leading the charge. Infrastructure and consumption themes outperformed, while select IT and financial stocks faced resistance at higher levels, capping the day's upside. **Global Cues** Positive global headwinds provided the launchpad for today's action, primarily fueled by the trade agreement easing geopolitical concerns. US markets closed higher overnight, reinforcing the risk-on setup for emerging markets like India. [Indian Market To Open Lower Today Amid Bearish Global Cues | CNBC TV18](https://www.youtube.com/watch?v=nasqjij91Jk) This video provides context on the global cues and market setup influencing recent volatility and trading sessions. http://googleusercontent.com/youtube_content/0
Fractal Analytics Sets Dates for Rs 2,834 Crore IPO
Fractal Analytics is set to launch India’s first pure-play Artificial Intelligence (AI) initial public offering, marking a historic shift in the domestic tech landscape. The issue is scheduled to open for subscription on February 9, 2026, and will close on February 11, 2026. The company has finalized its total issue size at 2,833.90 crore. This includes a fresh issue component of 1,023.50 crore and an offer-for-sale (OFS) of 1,810.40 crore. While the original filing suggested a larger issue of 4,900 crore, the revised size reflects a strategic optimization for the current market environment. The anchor investor bidding window is slated for February 6, 2026. Following the public subscription, the basis of allotment is expected to be finalized by February 12, 2026, with a tentative listing on the BSE and NSE set for February 16, 2026. Fractal’s financial trajectory underscores its readiness for public markets. For the fiscal year ending March 2025, the company reported a total income of 2,816.20 crore, representing a robust 25.7% growth compared to the previous year. Crucially, the firm achieved a major profitability turnaround in FY25, swinging from a 54.70 crore loss in the previous year to a net profit of 220.60 crore. This was supported by a significant expansion in EBITDA margins, which rose to 14.4% from 4.4% in FY24. Growth continues to be fueled by its core segment, Fractal.ai, which services over 100 Fortune 500 companies. This division contributes approximately 96% of total revenue. Meanwhile, its innovation arm, Fractal Alpha, is being positioned as a high-margin engine for future growth, despite currently being in the investment phase. The proceeds from the fresh issue are earmarked for clear strategic objectives. These include 264.90 crore for debt repayment at its US subsidiary and 355.10 crore dedicated to research, development, and marketing for the Fractal Alpha division. The remainder will fund office expansion in India and potential inorganic growth through acquisitions. This listing coincides with an explosive phase for the Indian AI market, which is projected to reach a valuation of 17 billion by 2027. Global investor interest remains high as the region emerges as a critical hub for AI infrastructure and data-driven decision-making. The successful transition of a pure-play AI unicorn to the public markets is expected to serve as a bellwether for the next wave of high-tech listings in Asia. With a net revenue retention rate of 121.3%, Fractal demonstrates strong enterprise stickiness, a key metric for long-term scalability in the software and services sector.
Prime Focus, MRPL, and Two Others in Focus for Wednesday Trading
**MARKET BRIEF: Nifty Volatility & US-India Trade Pact** **Date:** Tuesday, February 3, 2026 **Snapshot** The benchmark Nifty 50 witnessed a historic yet volatile session today, reacting to the breakthrough India-US trade agreement. While the index staged a massive gap-up opening—breaching the 26,300 mark for the first time—sustained profit-booking at higher levels forced a significant cool-off. Nifty eventually closed near **25,727**, forming a large bearish candle on the daily charts despite ending with gains of over **2.5%**. The price action suggests that while sentiment remains bullish, the immediate euphoria was sold into by traders capitalizing on the record highs. **The Catalyst: Tariff Slash** The primary driver for the explosive start was the confirmation of a new trade framework with the United States. Key developments include: * **Tariff Reduction:** US tariffs on Indian goods have been slashed to **18%**, a substantial relief from the punitive 50% levels seen previously. * **Strategic Alignment:** The deal signals a thaw in trade relations, expected to boost competitiveness for Indian exporters against emerging market peers like Vietnam and Brazil. * **Currency Impact:** The Indian Rupee strengthened significantly against the dollar, reflecting renewed foreign investor confidence. **Technical Setup & Key Levels** Technically, the market formation is a classic "gap-and-fade." The index opened significantly higher (Open: ~26,308) than the previous close but failed to sustain the momentum, slipping over 600 points from the intraday high of **26,341**. * **Immediate Support:** The **25,500** zone, previously a stiff resistance, has now flipped into a crucial support base. As long as Nifty holds above this level, the "buy-on-dips" texture remains intact. * **Resistance:** The psychological barrier of **26,000** and today’s high of **26,340** will act as immediate supply zones for any fresh upside attempts. * **Sentiment:** The formation of a red candle after a gap-up indicates aggressive profit-taking, but holding the 25,500 floor suggests buyers are still active at lower levels. **Sectoral Impact** The trade deal has triggered specific sectoral rotation, with export-oriented themes taking center stage: * **IT Services:** Major beneficiaries of improved US client sentiment. * **Textiles & Apparels:** Directly benefit from the tariff cut, making them more competitive in US retail markets. * **Pharma & Chemicals:** Likely to see improved order flows due to reduced trade barriers. * **Banking:** Private banks supported the index, driven by expectations of increased credit demand and FII inflows. **Institutional Flows** Preliminary data suggests a potential reversal in Foreign Institutional Investor (FII) activity. After weeks of selling, the trade deal provides the structural "leverage" required to attract long-term global capital back into Indian equities. Domestic investors continue to provide a cushion, absorbing supply at lower levels. **Market Outlook** Volatility is expected to persist as the market digests the fine print of the trade deal. Traders should monitor the **25,500** level closely. A sustain above this support confirms a bullish breakout, while a violation could trigger a fill of today's gap. The focus shifts to stock-specific opportunities in export sectors and defensive buying near support zones.
Nazara Technologies Q3 Net Profit Declines 35% to Rs 8.84 Crore
**Nazara Technologies: Q3 FY26 Market Brief** **Date:** February 3, 2026 **Core Update: Profit & Revenue Dip** Nazara Technologies has reported a consolidated net profit of **₹8.84 crore** for the quarter ended December 31, 2025 (Q3 FY26), marking a **35.3% year-on-year decline**. Operating revenue for the quarter stood at **₹406 crore**, reflecting a **24% drop** compared to ₹535 crore in the same period last year. This topline contraction is primarily attributed to the deconsolidation of its esports subsidiary, Nodwin Gaming, which is now treated as an associate company. **Operational Highlights** Despite the headline revenue fall, operational efficiency improved significantly. * **EBITDA Growth:** Earnings Before Interest, Tax, Depreciation, and Amortization (EBITDA) rose **29.4%** year-on-year to **₹67.8 crore**. * **Margin Expansion:** EBITDA margins expanded to **16.7%**, driven by disciplined execution and cost optimization. * **Segment Mix:** The Gaming segment remains the largest contributor, accounting for **63%** of revenue (₹257 crore), followed by AdTech at **28%** (₹115 crore). **Strategic Investments** The company continues to deploy capital aggressively to build its global gaming pipeline. * **Rusk Media:** The board approved a primary capital infusion of up to **₹15 crore** into the Gen Z-focused digital entertainment platform. * **nCore Games:** A strategic investment of **$500,000** was approved for the developers of the Indian action game franchise *FAU-G*. * **Curve Games:** This follows the earlier acquisition of UK-based Curve Games to strengthen PC and console offerings. **Market Reaction** Following the results announcement, Nazara Technologies shares closed at **₹284.40** on the BSE, up approximately **1.3%**. The stock has seen a 9-month revenue growth of **30%** (reaching ₹1,431 crore) when adjusted for the wider fiscal period. **

FII Buying Hits Three-Month High of Rs 5,236 Crore Amid US Trade Deal
**MARKET BRIEF: Trade Deal Sparks Historic Rally** **Overview** Indian equity markets witnessed a massive resurgence on Tuesday, driven by the finalized India-US trade agreement. The deal, which slashes reciprocal tariffs on Indian goods to **18%** (down from threatened highs of 50%), triggered the biggest single-day buying spree by Foreign Institutional Investors (FIIs) in months. **Key Market Data (Feb 3, 2026)** * **Sensex:** Closed at **83,739.13** (+2,073 points / +2.54%) * **Nifty 50:** Settled at **25,727.55** (+639 points / +2.55%) * **Investor Wealth:** Surged by **₹12.10 lakh crore** in a single session * **Market Cap:** Total BSE-listed market cap reclaimed the **$5.16 trillion** mark **FII & Institutional Flows** Foreign investors broke a prolonged selling streak, pouring over **₹5,200 crore** into Indian equities. This sharp reversal follows months of outflows driven by tariff uncertainties. Domestic institutions (DIIs) continued their support, but the aggressive return of foreign capital was the primary catalyst for the session's velocity. **Currency & Debt Markets** * **Rupee (INR):** Staged a dramatic recovery, gaining **122 paise** (+1.33%) to close at **90.27** against the US Dollar. * **Bond Yields:** The 10-year benchmark yield remained elevated at **6.78%** due to post-budget borrowing concerns, but the trade deal has significantly improved long-term sentiment regarding fiscal stability and capital flows. **Sectoral Movers** Buying was broad-based but led by export-heavy and rate-sensitive sectors. * **Top Gainer:** Adani Ports surged **9.12%**. * **Key Performers:** Bajaj Finance, InterGlobe Aviation, and Sun Pharma led the rally. * **Laggards:** Tech Mahindra and Bharat Electronics saw minor profit booking. **Editorial Take** The reduction of the tariff overhang provides immediate clarity for export-oriented sectors (textiles, gems, jewelry). With the US trade relationship stabilized and the Union Budget 2026-27 digested, the market narrative has shifted from defensive caution to renewed liquidity-driven optimism.
AB Capital Q3 Results: Consolidated PAT Rises 33% to Rs 945 Crore, Revenue Up 27%
**Market Brief: Aditya Birla Capital Q3 FY26** **Overview** Aditya Birla Capital delivered a robust financial performance for the quarter ended December 31, 2025 (Q3 FY26). The company recorded strong double-digit growth in profitability and revenue, driven by aggressive expansion in its lending portfolio and healthy traction across insurance and asset management segments. **Key Financial Highlights** * **Net Profit:** Consolidated profit surged **33%** year-on-year (YoY) to **₹945 crore**. Adjusted for one-offs, profit growth was even higher at **41%** (₹983 crore). * **Revenue:** Consolidated revenue from operations rose **27%** YoY to **₹11,952 crore**. * **Lending Portfolio:** The total lending book (NBFC + Housing Finance) expanded **30%** YoY, reaching **₹1.90 lakh crore**. * **Assets Under Management (AUM):** Total AUM across subsidiaries grew **19%** YoY to **₹5.98 lakh crore**. **Segment Performance** * **NBFC Business:** Disbursements jumped **41%** YoY to **₹21,417 crore**, with AUM rising **24%** to **₹1.48 lakh crore**. * **Housing Finance:** This segment outperformed with a **58%** YoY spike in AUM to **₹42,204 crore** and a **30%** increase in disbursements. * **Insurance:** Life insurance first-year premiums grew **19%**, while health insurance gross written premiums surged **39%** YoY. **Strategic Development** A significant highlight of the quarter was the fundraising in the housing finance subsidiary. The board approved a **₹2,750 crore** equity infusion from private equity major **Advent International** into Aditya Birla Housing Finance. This transaction values the housing finance arm at approximately **₹19,250 crore** and will result in Advent holding a **14.3%** stake. **Market Reaction** Following the strong results and the strategic investment news, Aditya Birla Capital shares witnessed buying interest, trading higher by approximately **4-8%** on the bourses, reflecting positive investor sentiment towards the growth roadmap and capital raising initiatives. **Next Step for You** I can conduct a deeper comparative analysis of Aditya Birla Capital’s valuation against peers like Bajaj Finance or Shriram Finance if you need a relative strength assessment.

US Stocks Mixed Amid Rebound in Gold and Silver Prices
Market Brief: Tuesday, February 3, 2026 US Markets: AI Optimism Meets Volatility Wall Street saw significant activity today as the **S&P 500** traded near record levels before facing volatility. The session was defined by a massive surge in **Palantir Technologies (PLTR)**, which jumped over **11%** following a blowout earnings report. The data analytics firm reported **70%** revenue growth and issued strong guidance for 2026, reigniting investor enthusiasm for AI-driven software. Despite the tech boost, broader market sentiment appeared mixed. While the **Nasdaq** and **S&P 500** benefited from individual tech wins, there were signs of rotation as investors weighed valuations against economic data. Commodities: Sharp Rebound for Precious Metals Gold and silver staged a dramatic recovery after recent heavy sell-offs. **Silver** prices vaulted approximately **13%**, erasing a significant portion of previous losses. **Gold** also saw strong buying interest, climbing roughly **4–6%** as bargain hunters entered the market, stabilizing the sector after days of intense liquidation. Global Markets: Asian Records & European Moves International markets displayed divergent trends with standout performances in Asia. * **Japan:** The **Nikkei 225** surged to a new record close, driven by tech strength. * **South Korea:** The **KOSPI** rallied nearly **7%**, also hitting record levels. * **Europe:** The **FTSE 100** briefly touched an intraday record high before retreating, while other major European indices like the **DAX** posted moderate gains, supported by stabilizing commodity prices. Key Takeaway The "AI trade" remains a potent market force, as evidenced by Palantir’s performance, even as broader indices grapple with high valuations. Meanwhile, the swift snap-back in precious metals suggests that the recent commodity dip was viewed by many as a buying opportunity rather than a fundamental shift.
Adani Wilmar Q3 Net Profit Declines 35% to Rs 269 Crore
MARKET BRIEF: AWL Agri Business Q3 FY26 Performance **Financial Overview** AWL Agri Business Ltd (formerly Adani Wilmar) reported mixed financial results for the quarter ending December 2025 (Q3 FY26). While top-line growth remained resilient, profitability faced significant headwinds due to escalating costs. * **Net Profit:** Consolidated net profit fell sharply by **35%** year-on-year to **₹269 crore**, down from ₹411 crore in the corresponding quarter of the previous fiscal. * **Revenue:** Consolidated revenue climbed **10.5%** to **₹18,602 crore**, driven by steady demand in core segments. * **Expenses:** Total expenses surged over **12%** to **₹18,345 crore**, outpacing revenue growth and compressing margins. **Operational Drivers** Despite a challenging macro environment, the company maintained momentum in volume terms. The edible oil segment posted healthy volume offtake, while the Food & FMCG portfolio showed a continued rebound. Management noted a shift in consumer behavior within the edible oil industry, with a marked transition toward **750g pack sizes**. **Corporate Developments** This quarter marks a significant transition period for the entity. Following the exit of Adani Enterprises from the joint venture, Wilmar International has become the majority shareholder with a **56.94%** stake. The company has been officially renamed **AWL Agri Business Ltd** to reflect this restructuring and its evolving strategic focus. **Market Reaction** Investor sentiment remained cautious following the earnings announcement. The stock has seen a recent correction, trading near the **₹215** level, reflecting broader concerns over profitability despite the revenue expansion. I can provide a deeper analysis of the edible oil sector's input cost trends or a comparison of AWL's margins against key FMCG peers.
JPMorgan Developing New Local Currency Debt Index
**Market Brief: JPMorgan to Launch New Frontier Local Currency Bond Index** **Date:** February 3, 2026 **Topic:** Frontier Markets / Fixed Income Indices **Executive Summary** JPMorgan is in the final stages of developing a new benchmark index dedicated to **frontier market local currency bonds**. This strategic move targets the surging investor appetite for high-yield, diversified debt in an environment where developed market yields remain compressed. **Key Drivers** * **Risk Appetite:** Investors are hunting for yield and diversification away from crowded mainstream trades. * **Currency Plays:** The initiative coincides with a year-long slump in the US dollar and significant rallies in frontier currencies like those of **Argentina**, **Ecuador**, and **Uganda**. * **Strategic Gap:** This launch comes 15 years after JPMorgan introduced its hard-currency frontier index (NEXGEM), aiming to formalize the local currency segment which has historically lacked a unified benchmark. **Index Structure & Mechanics** * **Composition:** Expected to track **20–25 countries**. * **Top Weightings:** Likely heavily weighted towards **Egypt, Vietnam, Kenya, Morocco, Kazakhstan, Pakistan, Nigeria, Sri Lanka, and Bangladesh**. * **Risk Controls:** Preliminary details suggest a **country cap of 8–10%** to prevent concentration risk. * **Liquidity Thresholds:** Inclusion likely requires bonds with a minimum outstanding volume of **$250 million equivalent** (a hurdle that markets like Zambia are working to clear). **Market Impact & Valuation** * **Yield Premium:** JPMorgan estimates the index will offer a yield pickup of approximately **400 basis points** over the mainstream GBI-EM index. * **High Income:** Over **60%** of the potential constituents currently yield more than **10%**. * **Performance:** Data indicates that frontier market local currency debt has outperformed the mainstream emerging market local index by nearly **2.5 percentage points** annually over the last eight years. * **Market Size:** The tradable universe for local-currency frontier debt has tripled in the last decade, now estimated at roughly **$1 trillion**. **Timeline** * **Consultation:** Formal structure expected by **June 2026**. * **Launch:** Official rollout anticipated for **2027**, following final investor feedback. **Implications** The creation of this index is expected to drive significant institutional capital flows into these smaller markets. By establishing a trackable standard, JPMorgan effectively validates the asset class, potentially lowering borrowing costs for frontier governments while offering investors a structured entry point into high-growth, non-G10 currency exposure.

Indus Towers Targets 5G and Overseas Expansion for Revenue Growth
**Indus Towers: Market Brief** **Date:** February 3, 2026 **Current Price:** ~**₹440** (+1.8% intraday) **Trend:** Bullish | High Investor Interest **Executive Summary** Indus Towers is pivoting from a domestic recovery phase to aggressive international expansion. While Q3 FY26 headline profit numbers show a decline due to high base effects, the underlying business health has improved significantly. Cash flow visibility is better than it has been in years, driven by the resolution of legacy dues from its largest distressed client. **Q3 FY26 Financial Snapshot** The company reported Q3 revenue of **₹8,146 crore**, an **8%** year-on-year increase, signaling steady demand for tower infrastructure. * **Net Profit:** **₹1,776 crore**. The **55%** headline drop is attributed to an exceptional gain of **~₹4,003 crore** in the same quarter last year (high base effect). * **Margins:** EBITDA margin remains healthy at **54.9%**, despite rising power and fuel costs. * **Stock Reaction:** The market has shrugged off the profit drop, focusing instead on robust cash flows and strategic clarity, pushing the stock near its 52-week high of **₹455**. **Critical Update: Payment Crisis Resolved** The long-standing overhang regarding Vodafone Idea (Vi) receivables has stabilised. * Vodafone Group successfully sold its remaining **3% stake** in Indus Towers for **₹2,800 crore**. * Proceeds were used to clear **₹1,910 crore** in past dues to Indus Towers. * Management confirmed that Vodafone’s obligations under security arrangements are now **"satisfied in full,"** significantly de-risking the balance sheet. **International Expansion: Africa & UAE** Indus Towers has officially operationalized its overseas ambitions, moving beyond "intent" to "execution" as of January 2026. * **New Subsidiaries:** Wholly-owned units were incorporated in **Nigeria** and **Zambia** on January 15, 2026. * **Strategic Hub:** Two new operational units have been launched in the **UAE** to manage international operations. * **Strategy:** The company is leveraging anchor customer Airtel's presence to enter these markets, with an initial capex plan estimated between **$200–300 million**. **Operational Outlook** While the frantic pace of initial 5G rollout has moderated, long-term demand remains structural. * **Tenancy:** Tenancy ratios are ticking upward as operators densify networks for better 5G coverage rather than just footprint expansion. * **Focus:** Management is prioritizing "share of wallet" from existing customers and maximizing returns from the newly stabilized cash flow position.

Volatility in Precious Metal Prices May Impact Expanding Gold Token Market
**Market Brief: Gold Surge & The Tokenization Trend** **Date:** February 3, 2026 **Topic:** Commodities / Digital Assets A historic rally in spot gold—recently testing the **$4,800–$5,000 per ounce** range—has triggered a massive capital rotation into "tokenized gold." This niche digital asset class creates a blockchain-based proxy for physical metal, but it introduces distinct layers of risk often overlooked by retail participants. **Market Performance** Demand for digital gold wrappers has exploded as investors seek 24/7 liquidity and fractional access. The total market capitalization for tokenized gold has surged to approximately **$4.5 billion–$6 billion** as of early 2026. Trading activity has outpaced this growth, with quarterly volumes exceeding **$126 billion** in late 2025—a signal that these assets are being used as high-velocity collateral rather than just passive store-of-value holdings. The sector remains heavily concentrated, with **Tether Gold (XAUT)** and **Paxos Gold (PAXG)** controlling over **90%** of the market share. **Hidden Risks** While these tokens offer efficiency, experts warn that the underlying structure differs fundamentally from owning physical bullion: * **Custody & Insolvency:** Unlike self-custodied crypto or physical bars, tokenized gold introduces **counterparty risk**. Investors ultimately rely on the issuer and their vaulting partners. If the custodial entity faces insolvency, token holders could become unsecured creditors rather than owners of the underlying metal. * **Regulatory Uncertainty:** Despite the push for frameworks like the **GENIUS Act**, regulatory clarity remains fragmented globally. Verification methods vary significantly, from real-time on-chain proof of reserves to monthly third-party attestations, creating an uneven landscape for investor protection. **Summary** The "digital gold" rush offers speed and accessibility, but it replaces the physical security of bullion with the credit and operational risk of digital issuers. Investors are urged to distinguish between price exposure and actual ownership.

Report: Mutual Funds Maintain Government Bond Sell-off Despite US Trade Agreement
**India Debt Market Brief: February 2026** **Mutual Funds Dump Bonds Amid Supply Glut** Indian mutual funds are extending their selling streak in the government bond market, signaling that record-breaking supply concerns are drowning out optimism from the newly signed U.S.-India trade pact. **Key Developments** * **Record Outflows:** Mutual funds offloaded a massive **₹290 billion ($3.2 billion)** in government bonds in January 2026 — the highest monthly sell-off on record. * **Selling Continues:** The trend has spilled into February, with funds selling another **₹53 billion** in a single session early this month. * **Trade Deal Relief Short-Lived:** While the U.S. agreement to slash tariffs on Indian goods to **18%** (from 50%) initially cooled yields to **6.71%**, the relief was temporary. **The Heavy Weight: Supply Overhang** Market sentiment remains pinned down by the government's aggressive borrowing plan. The Union Budget 2026-27 estimates gross market borrowing at a staggering **₹17.2 lakh crore**, keeping the debt pipeline clogged. Despite the fiscal deficit target tightening to **4.3%** for FY27, the sheer volume of paper hitting the market is forcing investors to lighten their books. **Market Dashboard (As of Feb 3, 2026)** * **10-Year Benchmark Yield:** Hovering at **6.73%**, up from intraday lows. * **Rupee:** Strengthened to **90.40** against the dollar, aided by the trade deal. * **Inflation:** December CPI remains benign at **1.33%**, but fails to trigger buying interest against the supply wall. **Fund Manager Sentiment** Institutional investors argue that "demand-supply dynamics" have now superseded macro optimism. With the central bank’s rate-cutting cycle perceived to be near its end, and no buyback support announced in the budget, funds are rotating preference toward corporate bonds (1–3 year segment) where spreads remain more attractive. The market focus has decisively shifted from global trade wins to domestic liquidity management. Expect yield volatility to persist as the market absorbs the heavy borrowing calendar. ... [February 2026 Debt Market Outlook](https://www.youtube.com/watch?v=z01RGOV-ZNw) ... This video provides a relevant analysis of the February 2026 debt market, covering yield risks and borrowing impacts that directly contextualize the mutual fund selling activity discussed above.

India Bond Rally Stalls on Supply Pressure and Upcoming RBI Meeting
**Market Brief: Trade Pact Sparks Bond Rally** **Bond Yields Ease on US-India Deal** Indian government bonds rallied on Tuesday, with the benchmark **10-year yield softening to 6.72%**, down from a one-year high of **6.77%**. Buying sentiment was ignited by the announcement of a US-India trade agreement, which alleviated recent bearishness caused by heavy fiscal supply concerns. **Key Drivers** * **Tariff Relief:** The United States agreed to cut reciprocal tariffs on Indian goods from **25% to 18%** and scrap additional punitive duties, boosting investor confidence in domestic assets. * **Currency Strength:** The Indian Rupee surged **1.2% to 90.40** against the dollar—its strongest single-day rise in years—further supporting demand for rupee-denominated debt. **Supply Constraints Persist** Despite the trade-deal euphoria, gains were tempered by the Union Budget’s announcement of a record **₹17.2 trillion** gross borrowing target for FY27. Market participants utilized the price uptick to book profits, remaining cautious of the supply-heavy calendar ahead. **Outlook** While the trade pact provides immediate relief, the market remains focused on the Reserve Bank of India’s (RBI) liquidity management to absorb the massive sovereign debt supply projected for the coming fiscal year.

India GCC Market Size Projected to Reach USD 110 Billion by 2030
**Market Brief: India’s GCC Sector Boom (Feb 2026)** **India’s Global Capability Centres (GCC) market is in the midst of an aggressive expansion, rapidly transitioning from a cost-saving backend to a primary engine of global innovation.** As of February 2026, the sector has established itself as a critical pillar of the Indian economy, driving record office leasing and high-value employment. **2030 Projections: The \$110 Billion Opportunity** New data released by FICCI and Anarock (Feb 2026) projects a massive scale-up over the next four years: * **Total Centers:** Expected to rise from ~1,700 today to **2,400** by 2030. * **Market Valuation:** Projected to hit **\$110 billion** (up from \$64 billion in 2024), growing at a **10% CAGR**. * **Workforce:** Headcount will surge to **2.8 million** professionals, adding nearly 1 million new high-value roles. **Shift to High-Value Innovation** The "back-office" label is effectively dead. Global firms are now designating India as their strategic innovation hub. * **AI & R&D:** Operations are pivoting toward AI-first models, generative AI development, and complex R&D. * **Mid-Market Surge:** Companies with revenues between \$50M–\$2B are aggressively entering India. This "mid-market" segment is expected to account for **950 centers** by 2030, driven by Private Equity backing. * **Sectors:** While IT and BFSI remain dominant, there is accelerated growth in Healthcare, Life Sciences, and Engineering Research & Development (ER&D). **Real Estate & Regional Expansion** GCCs have become the primary anchor for Indian commercial real estate. * **Record Leasing:** In 2025, GCCs drove roughly **40%** of India's total office space absorption, leasing over **32 million sq. ft.** across top cities. * **Tier-2 Migration:** Expansion is bleeding beyond the top 7 metros (Bengaluru, Hyderabad, NCR). * **Emerging Hubs:** Cities like **Jaipur, Indore, Surat, Kochi, and Coimbatore** now host over 170 centers, capitalizing on 25-30% lower operational costs and lower attrition rates compared to metros. **Summary** India is no longer just an outsourcing destination but a "Global Catalyst." By 2030, the GCC ecosystem will not only double in economic value but will fundamentally own the strategic, high-tech mandates of global Fortune 500 enterprises.
TREVOC Group and Canonicus Capital to Establish Rs 500 Crore Fund for NCR Real Estate Projects
**Market Brief: TREVOC & Canonicus Launch ₹500 Cr Platform for Stalled NCR Projects** **TREVOC Group** and **Canonicus Capital** have announced a strategic partnership today, February 3, 2026, to establish a **₹500 crore** platform aimed at reviving stalled real estate projects in Delhi-NCR. This move addresses a critical gap in the region's property market, where execution bottlenecks often freeze commercially viable developments. **The Deal Structure** The platform combines institutional capital with on-ground execution expertise. **Canonicus Capital**, a private equity firm specializing in last-mile financing, has committed **₹125 crore** for the first phase. The total corpus is expected to scale up to **₹500 crore** over the next few years. Under this arrangement, **TREVOC Group** will assume responsibility for construction management, governance, and meeting delivery timelines. **Canonicus** will provide the structured capital required to clear liquidity hurdles. **Target Asset Class** The joint venture focuses exclusively on "near-completion" residential and mixed-use projects. The platform has already evaluated a pipeline of assets characterized by: * Clean land titles * High completion readiness * Strong underlying end-user demand **Market Context: Liquidity Meets Execution** The National Capital Region (NCR) continues to see robust housing demand driven by infrastructure growth and urbanization. However, a significant inventory of housing units remains "stuck" due to fragmented developer execution and working capital shortages. Industry data suggests that capital alone rarely solves these delays. By integrating **TREVOC’s** development capability with **Canonicus’s** financial discipline, the platform aims to mitigate the specific risks that traditional lenders avoid. **Broader Sector Trends** This private sector initiative mirrors larger government efforts to resolve the stalled housing crisis. It arrives alongside reports of the government finalizing the **SWAMIH-2 Fund**, a proposed **₹15,000 crore** window to complete approximately **1 lakh** stalled units nationwide. Simultaneously, **Canonicus Capital** recently closed a separate **₹200 crore** fund targeting high-potential real estate opportunities in the NCR, signaling sustained institutional confidence in the region's long-term recovery. **Strategic Outlook** For the NCR market, this partnership offers a replicable model for resolution. It moves beyond simple debt financing to active project turnaround, potentially unlocking substantial inventory for homebuyers who have faced prolonged delays. **TREVOC Group** plans to develop nearly **5 million sq ft** of residential space and **1 million sq ft** of retail/office assets over the next **3 years**, positioning this platform as a key enabler of its expansion strategy.
RIL, HDFC Bank, and Eternal Among Tuesday's Top 7 Market Movers
**Market Brief: Historic Rally on India-US Trade Pact** **Headline Indices** Indian equities witnessed a euphoric session today, February 3, 2026, fueled by the landmark **India-US trade agreement**. The reduction of US tariffs on Indian goods to **18%** triggered massive buying interest. The **Sensex** skyrocketed over **2,000 points** to close near **83,739**, while the **Nifty 50** surged nearly **640 points**, reclaiming the **25,700** level. Investor wealth swelled as sentiment turned decidedly bullish. **Sectoral & Stock Performance** * **Adani Group:** A standout performer. **Adani Enterprises** zoomed **10–12%**, testing intraday highs of **₹2,233**. **Adani Ports** followed suit, rallying over **8%**. * **Heavyweights:** **Reliance Industries** rose **3.5–7%** (intraday high **₹1,489**), supported by broader optimism and acquisition news. **HDFC Bank** contributed significantly, gaining **2–4%** with highs near **₹994**. * **Chemicals:** This sector emerged as a top beneficiary of the tariff cuts. Stocks like **Camlin Fine Sciences** locked at **20%** upper circuits. **Aarti Industries** and **Yasho Industries** saw massive gains of **14–18%**, driven by improved export competitiveness. **Laggards in a Bull Market** Despite the broader rally, select counters faced selling pressure: * **PB Fintech (PolicyBazaar):** Trended weak throughout the session, sliding approximately **6%** to trade near **₹1,457**. * **Bharat Coking Coal:** Remained muted amidst the fervor, trading flat-to-negative around **₹37–39**, underperforming the energy and infrastructure rally. **Key Takeaway** The trade deal has effectively reset market sentiment, with **export-oriented sectors** (Chemicals, Textiles, Gems) leading the charge. Foreign institutional flows are expected to pivot back strongly following this geopolitical economic alignment. *** The search results did not contain a valid YouTube video URL.
Trump Signals Tariff Exemptions for India Amid Strategic Trade Realignment
**India-US Trade Truce: Market Brief** **Date:** February 3, 2026 **Headline Impact** A decisive trade truce between New Delhi and Washington has de-escalated a year-long economic standoff. Following direct talks between President Trump and Prime Minister Modi, the US has slashed tariffs on Indian exports to **18%**—down from a punitive peak of **50%**. **Key Drivers & Concessions** * **Tariff Reset:** The new **18%** rate removes a **25%** penalty previously linked to Russian oil purchases and lowers reciprocal duties. This gives Indian exporters a slight edge over competitors in Vietnam and Bangladesh (facing ~20% rates). * **Energy Pivot:** In a major geopolitical concession, India has agreed to halt Russian oil imports, redirecting demand to US and potentially Venezuelan crude. * **Purchase Commitments:** President Trump announced India will purchase over **$500 billion** in American energy, technology, and coal, alongside a pledge to move toward "zero" tariffs on US goods. **Market Reaction (As of Feb 3, 2026)** * **Equities Surge:** The Sensex and Nifty rallied nearly **3%**, ending at 84,912 and 25,781 respectively. * **Sector Winners:** Export-heavy sectors led the charge. Textile stocks like Gokaldas Exports hit **20%** upper circuits; auto-ancillaries and pharma saw gains of **3–8%**. * **Currency:** The Rupee strengthened significantly against the dollar, reversing a month-long depreciation trend. **Risk Factors & Analysis** * **Implementation Gap:** The **$500 billion** import target is ambitious relative to current trade volumes (~$125bn total bilateral trade in 2024-25). * **Sectoral Anxiety:** Silence on specific agricultural safeguards raises concerns for domestic dairy and farming sectors if "zero tariff" pledges are fully enforced. * **Transactional Shift:** The deal signals a move to strictly transactional diplomacy, where strategic alignment (e.g., quitting Russian oil) is directly pegged to market access leverage.
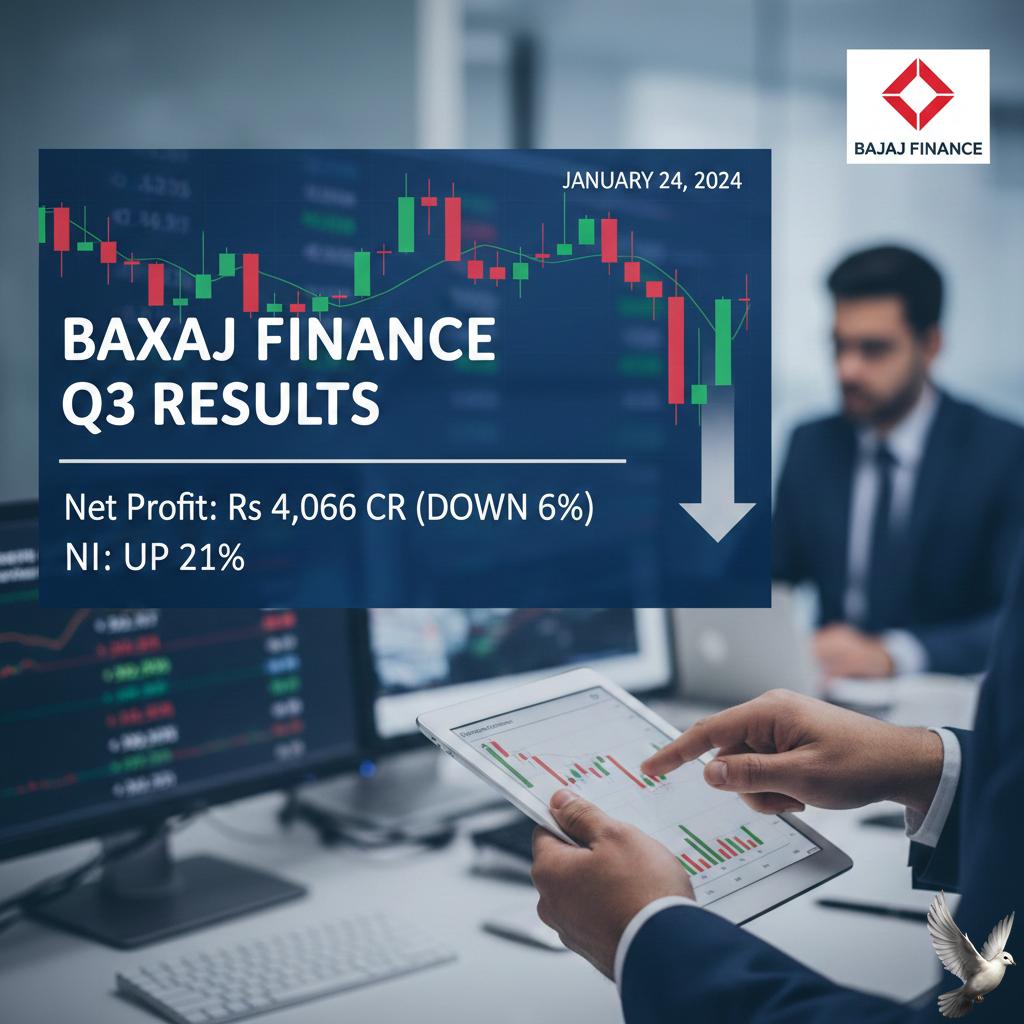
Bajaj Finance Q3 Net Profit Falls 6% to Rs 4,066 Crore, NII Rises 21%
**Market Brief: Bajaj Finance Q3 FY26 Results** **Overview** Bajaj Finance reported a mixed set of numbers for Q3 FY26. While headline profit declined due to significant one-time provisions, core operating metrics remained robust, driving a positive market reaction. **Key Financial Figures** * **Net Profit:** **₹4,066 crore** (Down **5.6%** YoY). * **Net Interest Income (NII):** **₹11,318 crore** (Up **21%** YoY). * **Assets Under Management (AUM):** **₹4.84 lakh crore** (Up **22%** YoY). * **Adjusted Profit:** Excluding one-offs, profit would have stood at **₹5,317 crore** (Up **23%** YoY). **Why Did Profit Decline?** The bottom line was impacted by two major exceptional items: 1. **Accelerated ECL Provision:** A charge of **₹1,406 crore** to strengthen the balance sheet. 2. **Labor Code Impact:** A one-time gratuity-related expense of **₹265 crore** stemming from new labor codes. **Operational Highlights** * **New Loans:** Booked **13.90 million** new loans, a **15%** increase YoY. * **Customer Base:** Expanded by **19%** YoY to reach **115.4 million**. * **Asset Quality:** Gross NPA rose slightly to **1.21%** (from 1.12% YoY), while Net NPA improved marginally to **0.47%** (from 0.48% YoY). **Market Reaction** Despite the reported profit drop, the stock surged approximately **6-7%** in intraday trade, reaching levels around **₹964**. Investors focused on the strong **21%** NII growth and the healthy underlying operating performance (adjusted profit up **23%**). **Analyst Sentiment** Brokerages largely maintained a **Buy** rating, viewing the provisions as a prudent, one-time cleanup rather than a structural issue. The average price target remains elevated above current levels, signaling confidence in the lender's long-term growth trajectory.