13 Stocks Surpass 200-Day Moving Average
Market Outlook: The 200-Day SMA Pivot
The **200-day Simple Moving Average (SMA)** remains the definitive line in the sand for global equity markets this February 2026. As a primary indicator of long-term health, the ability of major indices to hold above this level is currently dictating investor appetite.
In the U.S., the **S&P 500** is navigating a complex technical landscape, trading near **6,836**. While the index has faced resistance near the psychological **7,000** mark, it maintains a structural uptrend by staying comfortably above its 200-day SMA, which currently aligns with the **6,500 to 6,532** support zone.
The **Nasdaq 100** shows a more polarized picture. Although it continues its multi-year climb, trading around **24,878**, internal breadth has thinned. Data shows only **51.48%** of stocks within the Nasdaq 100 are currently trading above their individual 200-day averages, suggesting a market led by a narrowing group of performers.
Global Resilience and Breakouts
Emerging markets are seeing a surge in technical momentum. In India, the **Nifty 50** recently bounced off a critical confluence of its 20-day and 200-day moving averages near **25,500**. This "golden" support zone has re-energized the bullish case for domestic equities.
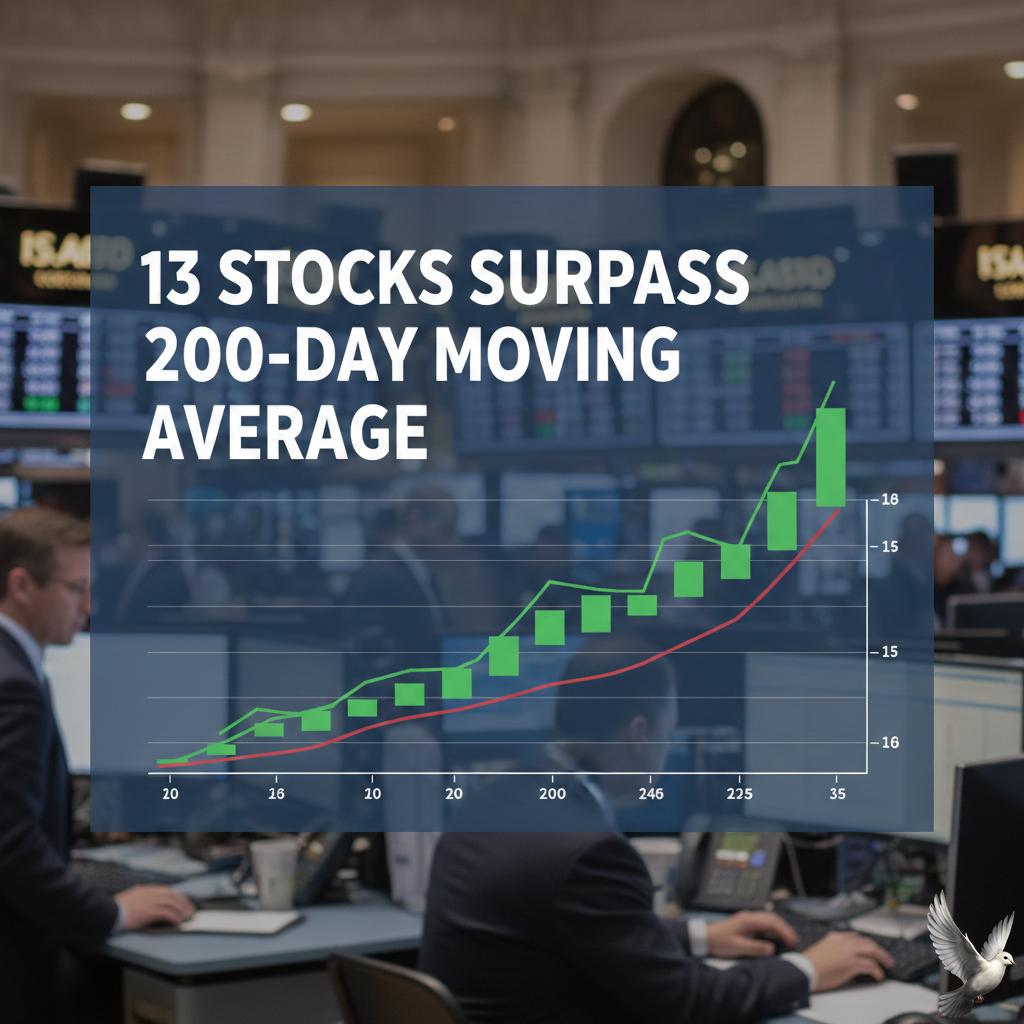
Recent scans identified **13 major stocks** in the Nifty 500—including names like **Adani Green Energy** and **One97 Communications**—that have successfully crossed back above their 200-day SMAs. This crossover is widely viewed as a transition from a corrective phase to a fresh uptrend.
* **Adani Green Energy**: Crossed 200-day SMA of **996.05**; current price **1,016.80**.
* **One97 Communications**: Reclaimed 200-day SMA of **1,142.42**; current price **1,169.30**.
* **Delhivery**: Surpassed 200-day SMA of **418.76**; current price **434.85**.
Economic Catalysts and Volatility
The market’s technical floor is being tested by shifting macro data. U.S. consumer inflation has moderated to **2.4%**, while the unemployment rate sits at **4.3%**. These figures keep the Federal Reserve on a path of "modest easing," which typically supports valuations for stocks trending above their long-term averages.
However, short-term volatility is rising. The **VIX** remains elevated at **20.60**, and the **VIX1D** (one-day volatility) is even higher at **22.43**. This suggests that while the long-term trend is up, investors are paying a high premium for protection against immediate catalysts like the upcoming FOMC minutes.
In commodities, **Silver** and **Gold** continue to trade well above their respective 200-day SMAs, confirming that the secular bull market in precious metals remains intact despite recent profit-taking.
Summary of Key Support Levels
The following levels represent the final line of defense for the current uptrend. A daily close below these figures would signal a shift from a "buy the dip" environment to a potential trend reversal.
* **S&P 500**: Critical support at **6,500** (200-day SMA).
* **Nasdaq 100**: Monitoring the **24,000** floor to maintain the 2023–2026 rally.
* **Nifty 50**: Strong technical base established at **25,500**.
As long as prices sustain these levels, the market remains in a confirmed uptrend, favoring long-term positioning over aggressive short-selling.