7 Stocks Cross Above 200-Day Moving Average
Equity markets are currently navigating a critical technical junction as of February 19, 2026. The 200-day Simple Moving Average (SMA) remains the primary barometer for long-term sentiment. In the U.S., the S&P 500 continues to trade above this vital level, currently hovering near **6,843**, maintaining its broad uptrend despite a recent cooling of momentum.
The market breadth reveals a growing divergence. While the headline index remains bullish, only **66%** of S&P 500 constituents are currently trading above their 200-day SMA. The technology sector is under notable pressure, with **57%** of its stocks now languishing below their long-term averages due to concerns over high valuations and shifting demand.
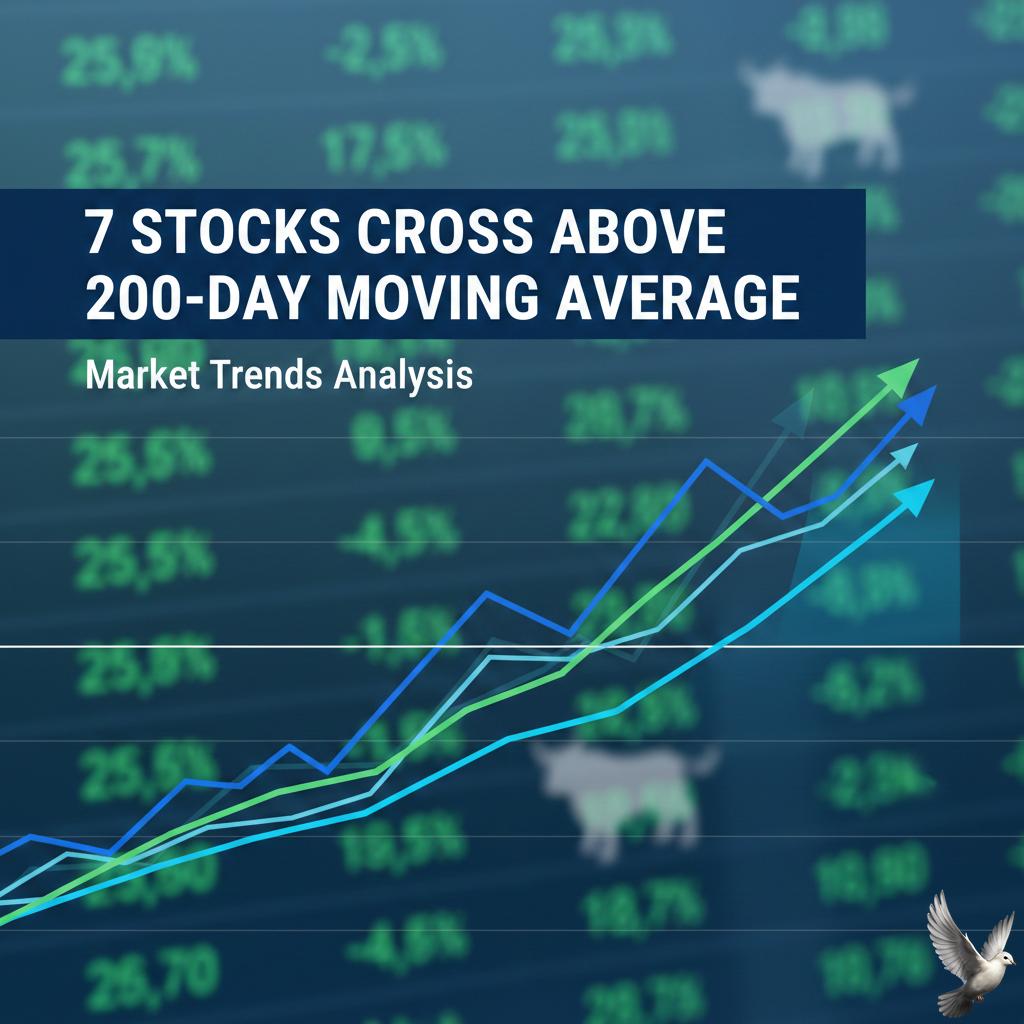
Indian benchmarks show similar resilience. The Nifty 50 settled at **25,819**, holding firm above its 200-day support near **25,500**. Technical scans identified seven major stocks, including Yes Bank and PVR Inox, making fresh breakouts above their 200-day DMAs this week, signaling a potential shift from sideways consolidation to active uptrends.
Economic indicators are providing a mixed backdrop for these technical levels. U.S. Consumer Price Index (CPI) data shows headline inflation at **2.4%**, while core inflation remains stickier at **3.6%**. Investors are closely monitoring the Federal Reserve's stance, as interest rate expectations directly impact the ability of growth stocks to stay above their moving averages.
Commodities are undergoing their own technical tests. Gold has corrected to approximately **$5,047** per ounce, yet it remains structurally sound within a long-term bull market as long as it holds above its 200-day floor. Silver has faced steeper volatility, retreating toward **$77.01** but staying within its medium-term upward channel.
Corporate earnings are the current catalyst for price action. As heavyweights report fourth-quarter results, the ability of individual stocks to reclaim or defend the 200-day SMA will determine whether the current market phase is a healthy consolidation or the start of a deeper trend reversal.
Volatility, measured by the VIX at **13.33**, suggests that while fear is not at extreme levels, the market is sensitive to technical breaches. Analysts emphasize that the 200-day SMA is a lagging indicator; therefore, price action near these levels often attracts significant institutional liquidity and serves as a "line in the sand" for trend followers.