Analysis of Data Patterns and Finolex Cables for Friday Trading
The Indian equity markets showed signs of recovery during the February 26 session, with the Nifty 50 closing at **25,496.55**, marking a modest gain of **14 points**. While the index initially struggled with volatility, it managed to snap a losing streak as buying interest emerged in the IT and banking sectors.
The session was characterized by intraday swings, with the Nifty fluctuating by nearly **0.3%** in both directions. The Sensex followed a similar pattern, ending slightly lower at **82,248.61**. Heavyweight pressure remains a concern, as financial leaders like HDFC Bank continue to act as a drag on the broader benchmarks.
Technical Landscape and Levels
Technical indicators suggest the market is entering a consolidation phase. The Nifty 50 has established a crucial support zone between **25,350** and **25,380**. This area is being closely watched by traders as a "make-or-break" floor for near-term momentum.
Immediate resistance is currently positioned in the **25,630 to 25,660** range, which aligns with the 50-day extended moving average. Analysts indicate that a sustainable move above **25,660** is necessary to trigger a fresh rally toward the **25,800** mark. Conversely, a breach below the **25,300** psychological support could open the doors for a deeper correction toward **25,150**.
Sectoral Performance and Trends
The Information Technology sector emerged as the primary driver of the day, with the Nifty IT index gaining **0.89%**. This rebound was supported by positive global cues and a stabilization in demand outlooks for Indian tech exporters. The banking sector also provided much-needed stability, with the Nifty Bank closing at **61,193.90**, up **0.25%**.
While the financial and auto sectors showed mixed results, specific focus remains on the Aerospace and Defense sectors. Institutional interest continues to rotate into high-growth manufacturing and "Make in India" themes, providing a cushion against global market volatility and shifting FII flows.
Stock-Specific Action
**Data Patterns**
The stock witnessed a significant surge, closing at **3,243.60**, up over **5.6%**. It hit a new 52-week high of **3,280** during the session. Technical patterns show a strong "Long White Candle," signaling robust bullish sentiment. The company’s recent quarterly performance, featuring **33%** revenue growth and a **22%** rise in net profit, continues to attract momentum buyers.
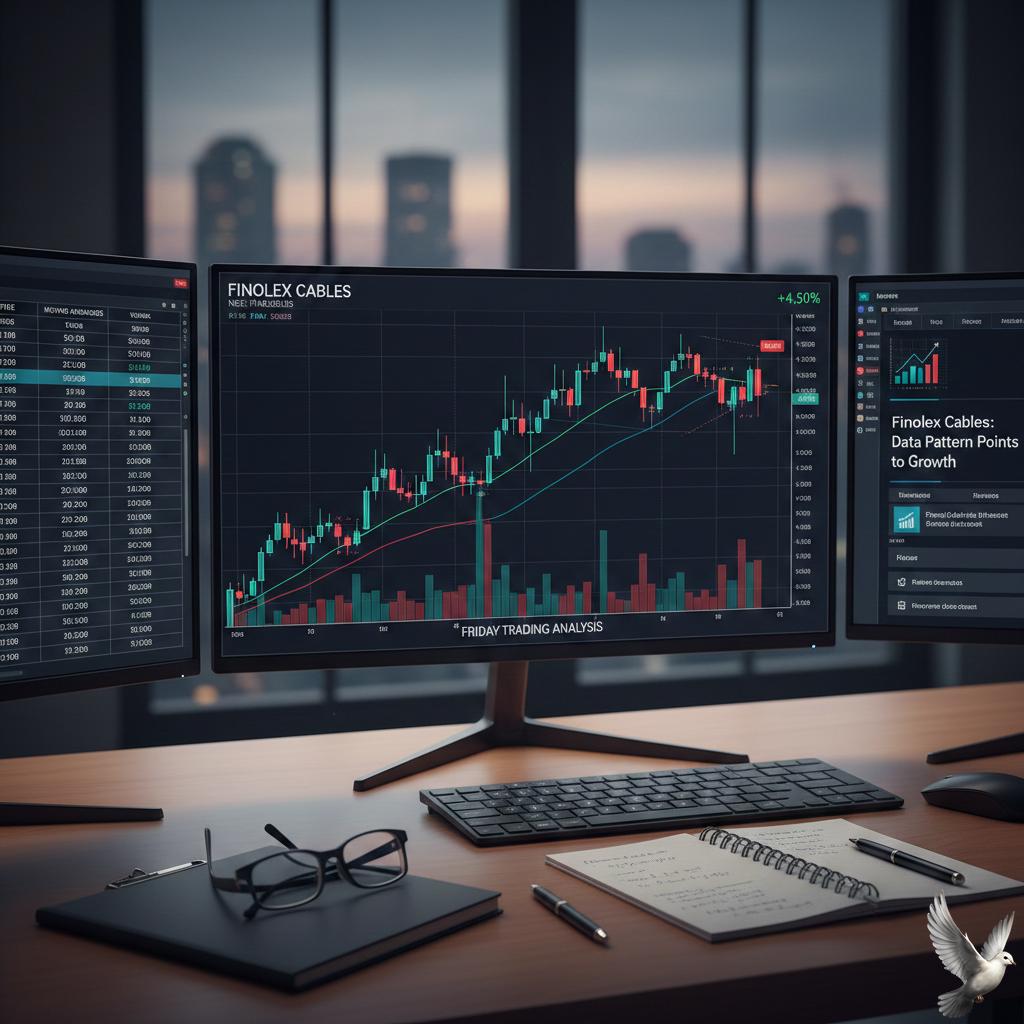
**Finolex Cables**
The stock displayed notable strength, ending the session at **873.35**, a gain of **5.66%**. It is currently trading significantly above its pivot level of **755.37**. With a debt-free balance sheet and a price-to-earnings ratio of **18.25**—well below the sector average of **46.59**—it is increasingly viewed as an attractive value play in the cable and wire industry.
Regulatory and Macro Outlook
The National Stock Exchange (NSE) has recently proposed stricter entry barriers for the retail derivatives market. These potential regulations aim to curb excessive speculation and protect smaller investors from high-volatility risks. Investors are also keeping a close eye on upcoming domestic GDP data and international trade developments, which are expected to dictate market direction in the final week of February.