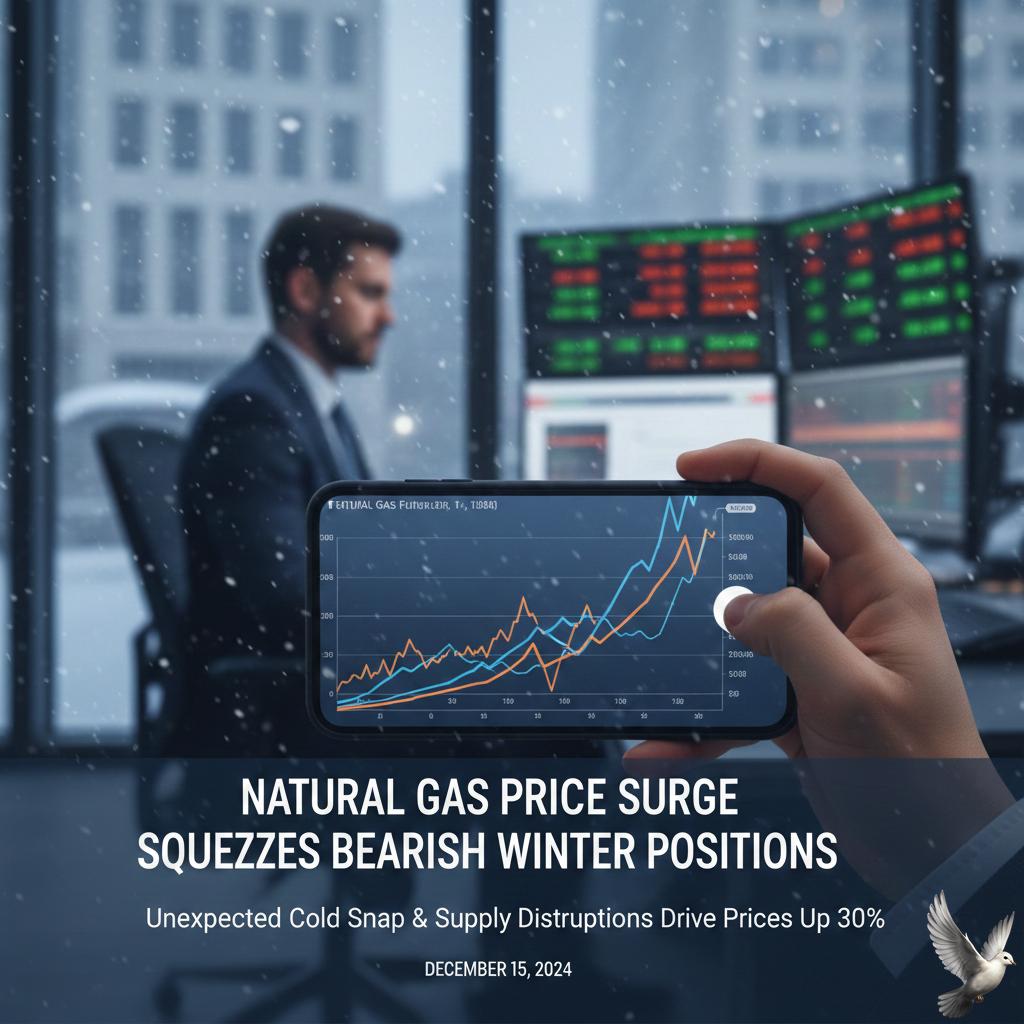
Natural Gas Price Surge Squeezes Bearish Winter Positions
**Market Brief: Winter Volatility Spike (January 2026)**
**Global Gas Markets in Turmoil**
A severe, unanticipated "brutal freeze" has gripped North America this week, shattering the mild-winter thesis that traders relied on for months. The sudden weather shift has triggered a violent short squeeze, sending natural gas prices vertical and forcing a chaotic realignment of global LNG flows.
**US Prices & Production**
* **Price Surge:** Henry Hub spot prices nearly tripled from early-winter lows, hitting **$8.15/MMBtu** on January 22.
* **Futures Rally:** US natural gas futures spiked **~70%** in a single week—the most dramatic weekly gain on record.
* **Supply Crunch:** Freezing temperatures have triggered "freeze-offs" in key production basins, cutting output by nearly **3 Bcf/d**.
* **Record Activity:** Panic buying to cover short positions pushed CME trading volumes to an all-time high of **2.57 million** contracts in a single day.
**Europe & Asia Divergence**
The volatility has spilled over into the Atlantic basin, widening the spread between European and Asian indices.
* **European Premium:** Dutch TTF futures rallied **~30%** week-on-week to **€38.22/MWh** (~$13.17/MMBtu), driven by critically low storage levels (now under **50%**) and anxiety over US export delays.
* **Asia Priced Out:** The Asian JKM benchmark trails at **$11.22/MMBtu**. With Europe commanding a premium of nearly **$2.00/MMBtu** over Asia, price-sensitive Asian buyers are retreating from the spot market.
**Logistics & Rerouting**
Real-time tracking confirms that LNG tankers are abandoning routes to Asia to chase higher yields in Europe.
* **Cargo Diversions:** Vessels like the *Clean Resolution* (originally bound for the Philippines) and *Zoe Knutsen* have abruptly changed course mid-voyage, redirecting supplies toward UK and Turkish terminals.
* **Market Outlook:** Traders remain in "panic mode" as forecasts predict the deep freeze will persist through late January, threatening further pipeline disruptions and continued volatility.
***
**Next Step:** I can generate a comparison chart of the Henry Hub vs. TTF price spread over the last 30 days to visualize the arbitrage window.