Bullish News
Collection
JGB Yields Fall on Position Adjustments Following Selloff
**Market Brief: Japan Sovereign Debt & Global Yields** **JGB Yields Decline on Auction Strength** Japanese Government Bond (JGB) yields retreated on Friday, January 30, 2026, as investors aggressively covered short positions following robust demand at key auctions. The benchmark **10-year JGB yield** edged down to approximately **2.24%**, stabilizing after a period of heightened volatility earlier in the month. Buying momentum was particularly evident at the short end of the curve. The **2-year JGB yield** dipped to **1.23%**, retreating from recent highs. This shift suggests that market participants are increasingly confident that the Bank of Japan’s (BOJ) terminal rate—currently projected by analysts to reach **1.00%** to **1.50%**—is already adequately priced into current valuations. **Auction Dynamics & Fiscal Sentiment** Market sentiment was significantly buoyed by a strong auction for **two-year bonds**, where demand exceeded the **12-month average**. This successful sale alleviated lingering concerns regarding investor appetite for Japanese sovereign debt, which had been tested by Prime Minister **Sanae Takaichi’s** recent fiscal proposals. Earlier in January, the market witnessed a historic selloff triggered by Takaichi’s pledge to suspend the sales tax on food for **two years**, a move that raised alarms about Japan's long-term fiscal health. However, the robust uptake in this week’s **40-year bond** auction—which saw the highest demand since **March 2025**—indicates that domestic institutions remain willing to lock in higher yields despite the political uncertainty surrounding the impending **February 8** snap election. **Bank of Japan Policy Outlook** While the BOJ voted to hold the policy rate steady at **0.75%** during its January 22–23 meeting, minutes from the December session revealed that board members remain open to further hikes if economic forecasts align. Despite this hawkish undercurrent, the swift stabilization in yields this week implies that the market views the current tightening cycle as manageable. Investors are now recalibrating their expectations, weighing the central bank’s data-dependent stance against the potential for expansionary fiscal policy under a renewed LDP mandate. The immediate focus remains on the "spring wage offensive" (Shunto) and its impact on service price inflation, which the BOJ has cited as a prerequisite for future rate increases. **US Treasuries & Global Context** In the broader Asian session, **long-dated US Treasuries** faced renewed selling pressure. The yield on the **10-year US Treasury** note climbed to **4.27%**, inching closer to the **4.30%** resistance level. This movement contrasts with the buying activity in Tokyo, highlighting a divergence in regional bond market drivers. The pressure on US debt coincides with a mixed tone in global equities, driven by disappointing earnings from major tech heavyweights like **Microsoft** and **SAP**, which dampened risk sentiment. As US yields grind higher, the widening spread between US and Japanese rates continues to exert influence on currency flows, keeping the **USD/JPY** pair in focus around the **153.80** level. **Summary of Key Levels** * **Japan 10Y Yield:** **2.24%** (Stable) * **Japan 2Y Yield:** **1.23%** (Declining) * **US 10Y Yield:** **4.27%** (Rising) * **BOJ Policy Rate:** **0.75%** (Unchanged) * **Next Major Event:** Snap General Election, **Feb 8, 2026**

Prestige Estates Q3 Profit Rises 8-Fold to Rs 245 Crore
**Prestige Estates Q3 FY26 Market Brief** **Financial Performance Surge** Prestige Estates Projects Ltd has delivered a robust financial performance for the third quarter of FY26. The Bengaluru-based realty major reported a consolidated net profit of **₹244.7 crore**, marking an nearly **8-fold increase** from ₹32.2 crore in the same period last year. **Revenue Growth** Total income for the October-December quarter witnessed a sharp rise, climbing to **₹3,885.5 crore** from ₹1,697.9 crore in the corresponding quarter of the previous fiscal. This significant growth was primarily driven by higher income recognition and strong operational execution. **Operational Highlights** The company’s operational metrics remained strong with pre-sales for the quarter growing **39%** year-on-year to **₹4,184 crore**. Collections also saw a healthy uptick, rising **40%** to **₹4,547 crore**. For the first nine months of FY26, the firm achieved record sales bookings of **₹22,327 crore**, a massive **122%** jump compared to the previous year, already surpassing its full-year guidance. **Market Reaction** Following the results, Prestige Estates shares were trading around **₹1,430** on the NSE/BSE as of January 30, 2026. While the stock has seen some correction over the past month, the strong quarterly numbers have arrested the decline, showing marginal gains in intraday trade. **Outlook** The developer continues to expand its footprint with aggressive launches and completions. During the quarter, it launched **5.02 million sq ft** of new projects and completed **4.72 million sq ft**, signalling sustained momentum in both residential and commercial segments.
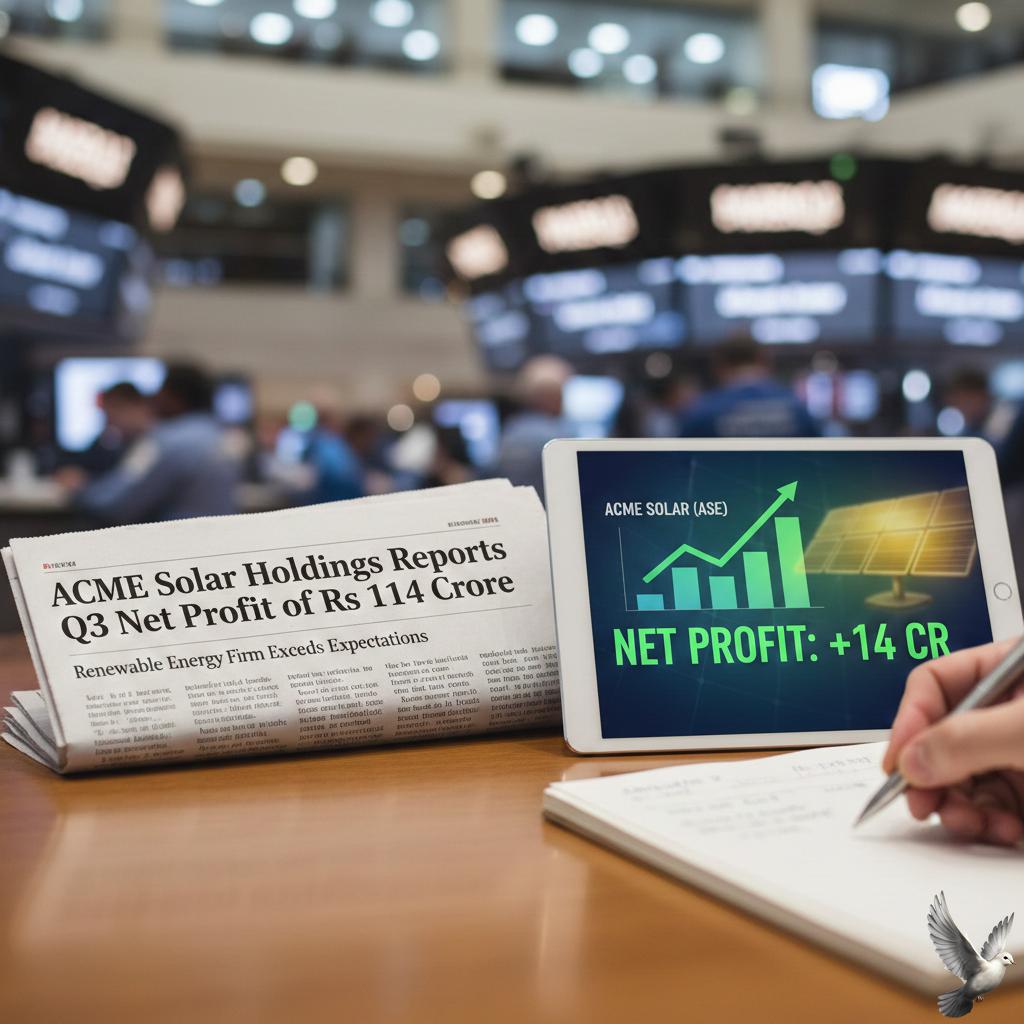
ACME Solar Holdings Reports Q3 Net Profit of Rs 114 Crore
**MARKET BRIEF: ACME Solar Holdings Ltd (Q3 FY26)** **Market Reaction & Price Action** Following the release of Q3 results, ACME Solar shares witnessed strong buying interest, surging approximately **5-6%** in intraday trade to hover around the **₹226** level. The market capitalization currently stands near **₹13,600 crore**, reflecting positive investor sentiment toward the company's aggressive capacity expansion and operational efficiency. **Financial Highlights** The company delivered a mixed but growth-oriented financial performance for the quarter ending December 2025: * **Revenue Surge:** Consolidated revenue jumped **53.9%** year-on-year to **₹617 crore**, driven by robust power generation and new capacity additions. * **Profitability:** Net profit recorded a marginal rise of **1.5%** to **₹114 crore**. While the bottom-line growth appears flat, the operational scale-up is evident in the top line. * **EBITDA:** Operational performance remained strong with EBITDA rising **57.2%** to **₹564 crore**, improving margins to **91.5%**. **Operational Drivers** * **Power Generation:** Total generation spiked **49%** to **1,567 Million Units (MUs)**, aided by a better Capacity Utilization Factor (CUF) of **24.3%** (up from 22.7%). * **Project Commissioning:** The company partially commissioned **72 MW** of its 100 MW wind power project in Gujarat, further diversifying its energy mix. **Strategic Wins & Funding** Beyond the quarterly numbers, ACME Solar secured critical growth levers: * **New Contracts:** Signed Power Purchase Agreements (PPAs) for a **250 MW** project with NHPC and a **200 MW** solar-plus-storage project with SECI. * **Capital Security:** Successfully secured a debt tie-up of **₹4,725 crore** from leading institutions, including Power Finance Corporation (PFC), to fund future renewable projects and optimize financing costs. **Shareholder Returns** The Board declared an interim dividend of **₹0.20** per equity share for FY 2025-26. The record date for eligibility is set for **February 6, 2026**. **Sector Outlook** ACME Solar’s expansion aligns with India’s broader 2026 energy roadmap, where installed power capacity has crossed **513 GW**. With the government emphasizing storage and grid reliability, ACME’s pivot toward hybrid projects and battery storage (BESS) positions it strategically within the evolving high-growth renewable landscape. **Summary** ACME Solar is prioritizing rapid top-line expansion and asset creation over immediate profit maximization. The successful debt fundraise and aggressive project commissioning schedule provide high revenue visibility for upcoming quarters.
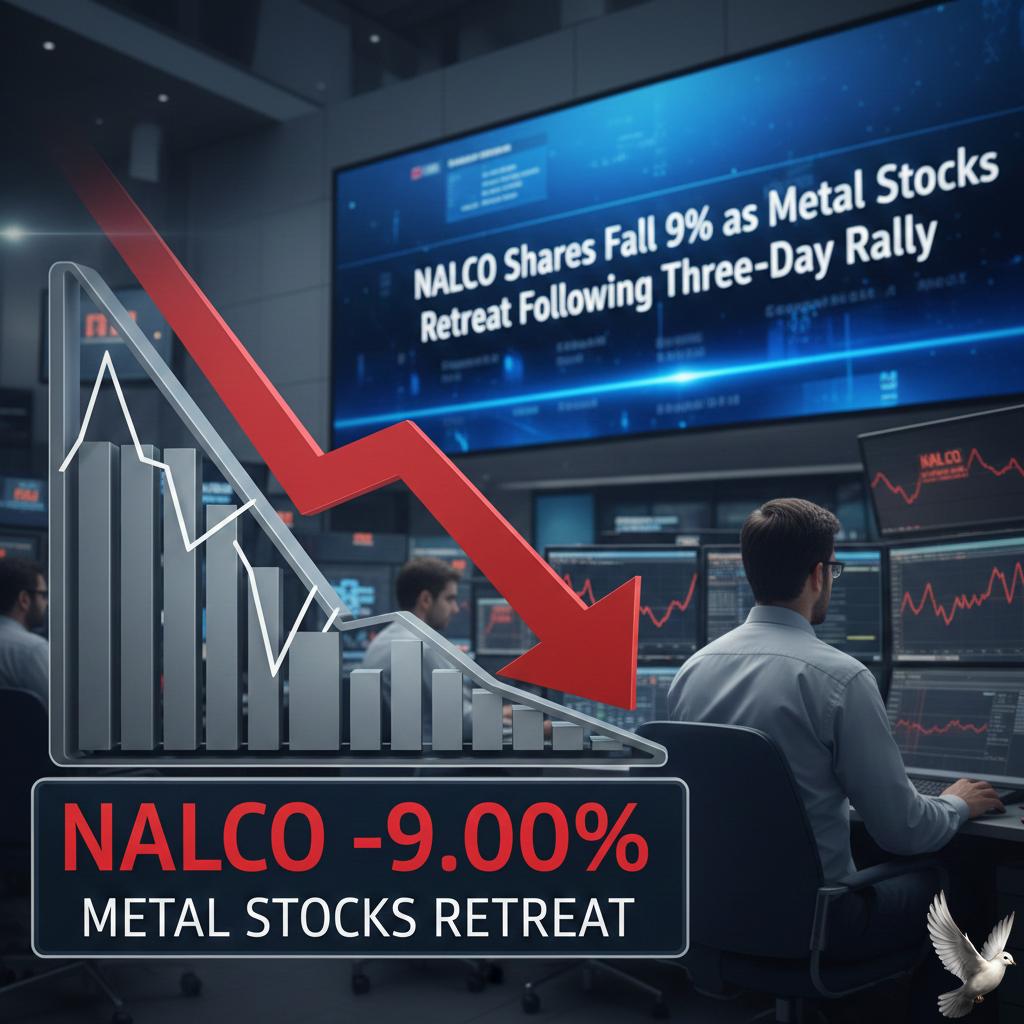
NALCO Shares Fall 9% as Metal Stocks Retreat Following Three-Day Rally
Market Brief: NALCO & Metal Sector Correction **Friday, January 30, 2026** Shares of National Aluminium Company (NALCO) witnessed a severe downturn on Friday, plummeting over **10%** to close at **₹383.00**. The sharp decline marks a significant reversal, snapping a robust three-day rally and erasing recent gains amid a broader sell-off in the commodities space. **Sector-Wide Sell-Off** The negative sentiment was not limited to NALCO. The Nifty Metal index crashed approximately **5.4%**, settling around **11,804**, as investors rushed to book profits. Major heavyweights including Hindalco, Vedanta, and Hindustan Copper also faced intense selling pressure, dragging the sector down significantly more than the **4%** drop initially observed in early trade. **Global Triggers & Commodity Prices** A steep correction in global metal prices acted as the primary catalyst. * **LME Aluminium** and **Copper** retreated sharply from their recent record highs as speculative fervor cooled. * **Silver** prices witnessed a massive crash, plunging nearly **15%** in a single session, further dampening sentiment across the resource complex. **Currency & Macro Factors** The US Dollar gained strength, reducing the appeal of dollar-denominated commodities. The **USD/INR** exchange rate hovered at record highs around **91.94**, adding to the volatility. Market participants also cited nervousness ahead of NALCO's upcoming quarterly earnings and the Union Budget as key reasons for the aggressive profit booking.
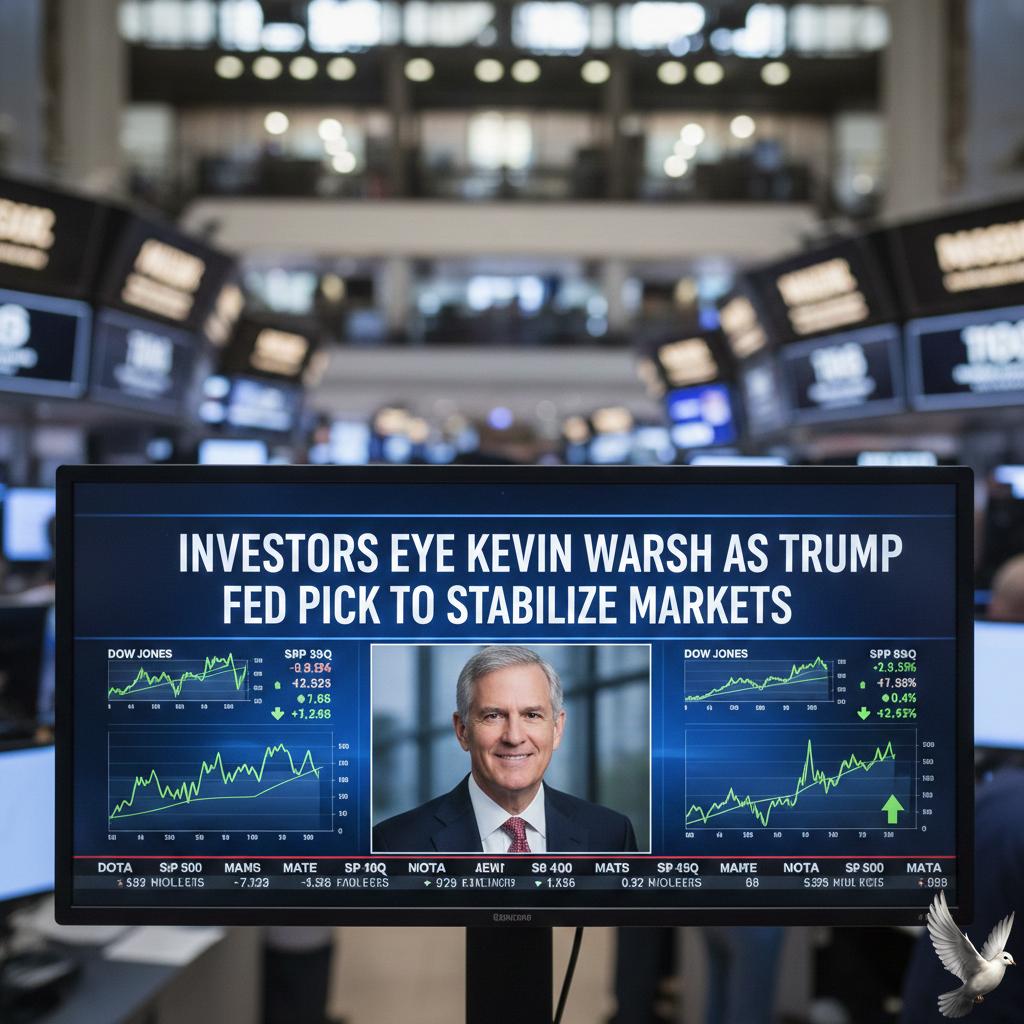
**Investors Eye Kevin Warsh as Trump Fed Pick to Stabilize Markets**
**MARKET BRIEF: Fed Chair Announcement Imminent** **Date:** January 30, 2026 **Headline: Markets Brace for Warsh Nomination as Trump Signals Fed Overhaul** President Donald Trump is poised to announce his nominee for the next Federal Reserve Chair today, with former Fed Governor **Kevin Warsh** emerging as the definitive front-runner. Betting markets peg Warsh’s confirmation odds at over **94%**, signaling a potential pivot in U.S. monetary policy as Jerome Powell’s term approaches its May conclusion. **The "Warsh Effect" on Markets** Investors are reacting swiftly to the prospect of a Warsh-led Fed. Known as a "hawk" with a focus on balance sheet reduction, Warsh’s nomination is triggering a classic risk-off sentiment. Markets are weighing his historical preference for tighter money against President Trump’s public demand for lower interest rates (targeting **1%**). **Equities Stumble:** U.S. stock futures have slipped in pre-market trading. S&P 500 futures are down **0.4%**, struggling to hold the **6,969** level recorded at Thursday’s close. Nasdaq futures shed **0.5%**, led by weakness in tech as yield concerns resurface. **Treasury Yields & Dollar Strength:** Bond markets are volatile. The **10-year Treasury yield** edged higher, testing **4.26%**, as traders price in the possibility of a more disciplined approach to the Fed’s balance sheet. Conversely, the uncertainty is fueling a flight to safety in the currency market. The **U.S. Dollar Index (DXY)** rebounded to **96.14**, gaining **0.2%–0.8%** against major peers, finding a lifeline after recent sell-offs. **Commodities & Crypto Under Pressure:** Non-yielding assets are taking the hardest hit. * **Gold** prices plunged **3%** on the strengthening dollar and rising real yield expectations. * **Bitcoin** fell **2%**, hitting two-month lows as liquidity expectations tighten. * **Brent Crude** dipped **1.4%** to **$69.74**, weighed down by broader risk aversion. **Key Takeaway** While Warsh is viewed as a "market-friendly" institutionalist, his hawkish track record creates friction with the aggressive rate-cut narrative investors had priced in. The immediate focus now shifts to the official announcement and any guidance on how Warsh intends to navigate the dual mandate under intense political scrutiny.

Obstacles Facing the Next US Fed Chair
**Market Brief: Trump Set to Tap Kevin Warsh for Fed Chair** **Date:** Friday, January 30, 2026 **The Headline** President Donald Trump is expected to announce former Federal Reserve Governor **Kevin Warsh** as his nominee for the next Chair of the Federal Reserve today. This move signals a pivotal leadership transition for the world’s most influential central bank as current Chair Jerome Powell’s term approaches its **May 2026** expiration. **Market Reaction: Immediate Volatility** Financial markets reacted sharply to the news, pricing in a potential shift in monetary strategy: * **Treasury Yields:** Long-dated bond yields rose, steepening the yield curve as traders anticipate a focus on balance sheet reduction. * **US Dollar:** The greenback strengthened approximately **0.5%** against major peers. * **Commodities & Crypto:** Gold prices dropped **3%**, and Bitcoin fell roughly **2%** in response to the strengthening dollar and yield movements. * **Equities:** US stock futures edged lower, reflecting short-term uncertainty about the policy pivot. **The Nominee: A Strategic Pivot** Kevin Warsh, who served on the Fed Board from **2006 to 2011**, has emerged as the clear frontrunner, with prediction markets pricing his nomination probability above **90%**. Previously known as a "hawk" who favored tighter money, Warsh has recently aligned with the administration’s pro-growth stance. He argues that productivity gains from Artificial Intelligence will help keep inflation in check, potentially allowing for the lower interest rates the President has publicly demanded. **Economic Backdrop** The nomination comes just days after the Federal Reserve voted to hold interest rates steady at the **3.50%–3.75%** range during its January 28 meeting. * **Inflation:** Recent data shows inflation stabilizing near **3%**, down from previous highs but still above the Fed’s long-term target. * **Growth:** The US economy continues to expand robustly, reducing the immediate urgency for aggressive rate cuts despite political pressure. **The Road Ahead** Senate confirmation remains the final hurdle. While Warsh is a known entity in Washington, the confirmation process will likely focus heavily on the central bank's independence. Lawmakers will scrutinize how the new leadership intends to balance the administration's push for cheaper borrowing costs against the mandate to maintain price stability.

R Gandhi Sees Strong India Growth Prospects Amid Structural Reforms
Market Brief: India Economic Outlook 2026 **Robust Growth Trajectory** India cements its position as the fastest-growing major economy with the Economic Survey 2025-26 estimating real GDP growth at **7.4%** for the current fiscal year. The outlook for FY27 remains strong, with projections set between **6.8%** and **7.2%**. This momentum is driven by a "double engine" of private consumption, which rose to **61.5%** of GDP, and gross fixed capital formation, indicating sustained investment demand. **Inflation and Monetary Stance** Macroeconomic stability has strengthened significantly. Headline retail inflation averaged a historic low of **1.7%** during April–December 2025, well below the Reserve Bank of India's tolerance band. Despite this benign inflationary environment, the central bank is expected to maintain a cautious stance, with the repo rate likely holding steady at **5.25%** throughout 2026 to ensure durable alignment with the 4% target while supporting growth. **Industrial and Sectoral Performance** Industrial activity has surged, with the Index of Industrial Production (IIP) hitting a 26-month high of **7.8%** in December 2025. Manufacturing led this expansion with **8.1%** growth, supported by resilient construction activity and capital goods demand. The services sector continues to be a powerhouse, with exports reaching a record **$387.6 billion**, cushioning the economy against external trade shocks and geopolitical fragmentation. **Strategic Shifts and Technology** Policy focus has shifted toward "Disciplined Swadeshi"—a strategy aiming for strategic indispensability in critical value chains. The technology sector is pivoting from pilot projects to execution at scale. AI adoption is projected to contribute over **4%** to GDP by 2030, potentially generating **$550 billion** in economic value by 2035. While financial sector adoption remains nascent at **21%**, the broader startup ecosystem is aggressively leveraging deep-tech and semiconductor investments to drive future competitiveness. **Global Resilience** Despite global headwinds, including trade friction and tariff risks, domestic buffers remain robust. Foreign exchange reserves stand at **$701.4 billion**, covering **11 months** of imports. This financial health, combined with fiscal consolidation—revenue receipts rising to **9.2%** of GDP—provides adequate insulation against volatile global market shifts in the coming fiscal year.

India Needs Structural Reforms to Exceed 7% Growth, CEA Says
**MARKET BRIEF: INDIA'S REFORM PUSH & ECONOMIC OUTLOOK (JAN 2026)** **Macro Snapshot: Growth & Stability** Chief Economic Adviser V. Anantha Nageswaran has outlined a path for India to reach a **7–8%** medium-term growth trajectory, contingent on executing deep structural reforms. The newly released **Economic Survey 2025-26** projects real GDP growth at **6.8–7.2% for FY27**, following a robust estimate of **7.4% for FY26**. **Key Economic Indicators** * **GDP Growth:** **7.4%** (FY26 Estimate) | **6.8–7.2%** (FY27 Projection) * **Inflation:** Averaged **1.7%** (Apr–Dec 2025), signaling strong price stability. * **Forex Reserves:** **$701.4 Billion** (Jan 16, 2026), providing 11 months of import cover. * **Market Levels:** Sensex trending near **82,560**; Nifty hovering around **25,310**. **Structural Reform Agenda** Nageswaran emphasized that moving from 7% to 8% growth requires addressing four specific "pending issues": 1. **Land & Agriculture:** Accelerating land reforms and simplifying the conversion of land from agricultural to non-agricultural use. Agricultural performance remains strong with foodgrain production hitting a record **3,577.3 Lakh Metric Tonnes**. 2. **Energy Taxation:** A strategic push to bring fuel products under the **GST framework** to lower industrial input costs and reduce cross-subsidization. 3. **Education:** A decisive policy shift from "enrollment numbers" to "measurable quality outcomes" to solve skill gaps. 4. **Deregulation:** Continued removal of regulatory friction at the state level to enhance ease of doing business. **Sector & Trade Developments** * **Energy Transition:** India successfully achieved **50% non-fossil fuel power capacity** in mid-2025. Ethanol blending stood at **19.05%**, nearing the 20% target. * **Trade & Currency:** Services exports touched an all-time high of **$387.6 Billion** in FY25. The Rupee remains resilient despite global trade tensions, supported by substantial capital buffers. **Investment Outlook** The government signals a transition where private capital expenditure must take the lead from public spending. The focus is now on "next-gen" reforms to unlock productivity in land and labor markets. I can generate a comparative analysis of these FY27 projections against previous years to highlight the growth trend.

Gold and Silver ETFs Decline Up to 23%: Causes and Investment Implications
**Market Brief: Precious Metals Correction** **Date:** January 30, 2026 **Executive Summary** Gold and Silver ETFs witnessed a dramatic reversal on Friday, erasing a portion of their historic January gains. A wave of profit-booking, triggered by a rebounding US Dollar and speculation regarding the Federal Reserve leadership, drove spot prices down significantly from their all-time highs. **Sharp Price Reversal** Domestic and global markets saw heavy selling pressure today. * **Gold:** Spot gold prices retreated to **$5,200** per ounce levels, dropping approximately **4%** from Thursday’s record peak of nearly $5,600. On the MCX, gold futures slid to **₹1.75 lakh** per 10 grams. * **Silver:** The white metal led the decline, plunging roughly **6%** to trade near **$110** per ounce after touching a lifetime high of $121 yesterday. MCX Silver futures dropped to the **₹3.87 lakh** per kg mark. **ETF Impact** The sudden volatility triggered steep losses across precious metal funds. * Silver ETFs were hit hardest, with major funds recording declines of **12% to 14%** in a single session. * Gold ETFs also saw significant corrections, shedding **6% to 10%** as investors rushed to lock in gains following the unprecedented rally. **Historical Context** Despite Friday's selloff, the broader trend for January 2026 remains historic. * **Silver:** Even with the dip, silver is on track for a monthly gain exceeding **50%**, its strongest performance on record. * **Gold:** The yellow metal is set to post its best monthly return since **1980**, gaining over **20%** in January driven by geopolitical instability and central bank buying. **Market Drivers** Analysts attribute the sudden snapback to "peak euphoria" and technical overbought conditions. Sentiment shifted rapidly after the US Dollar Index bounced from recent lows, fueled by reports that President Trump may nominate former Fed Governor Kevin Warsh—viewed as a hawkish candidate—as the next Federal Reserve Chair. This speculation has tempered bets on loose monetary policy, prompting a swift liquidation in non-yielding assets.

Hindustan Copper Shares Drop Over 10% Amid Investor Analysis of Entry Points
**Market Brief: Hindustan Copper Corrections & Trends** **Sharp Correction Following Rally** Hindustan Copper shares witnessed a steep decline during Friday's trading session, snapping a powerful upward streak. After hitting a lifetime high of **₹760** earlier in the week, the stock succumbed to heavy selling pressure, closing significantly lower. **Key Figures** * **Current Price:** Trading around **₹675 – ₹680** levels. * **Intraday Drop:** The stock plunged approximately **10–11%** on Friday. * **Recent High:** Reached a record peak of **₹760.05** just a day prior. **Drivers of the Drop** The primary trigger for the fall was aggressive profit booking. Investors cashed in on the rapid **40%** surge seen over the last few sessions. Weakness in global commodity markets also weighed on sentiment, with copper prices on the LME and MCX showing volatility alongside corrections in gold and silver. **Expert Sentiment & Outlook** Analysts maintain a cautious stance despite the broader bullish trend. The stock is currently in an **overbought zone** (high RSI), making short-term consolidation likely. * **Support Levels:** Experts suggest watching the **₹690 – ₹700** zone for stability. * **Strategy:** Fresh entries are risky at current volatility; waiting for deeper dips is recommended. * **Trend:** The long-term structural setup remains positive, but immediate upside is capped by resistance near **₹790**.
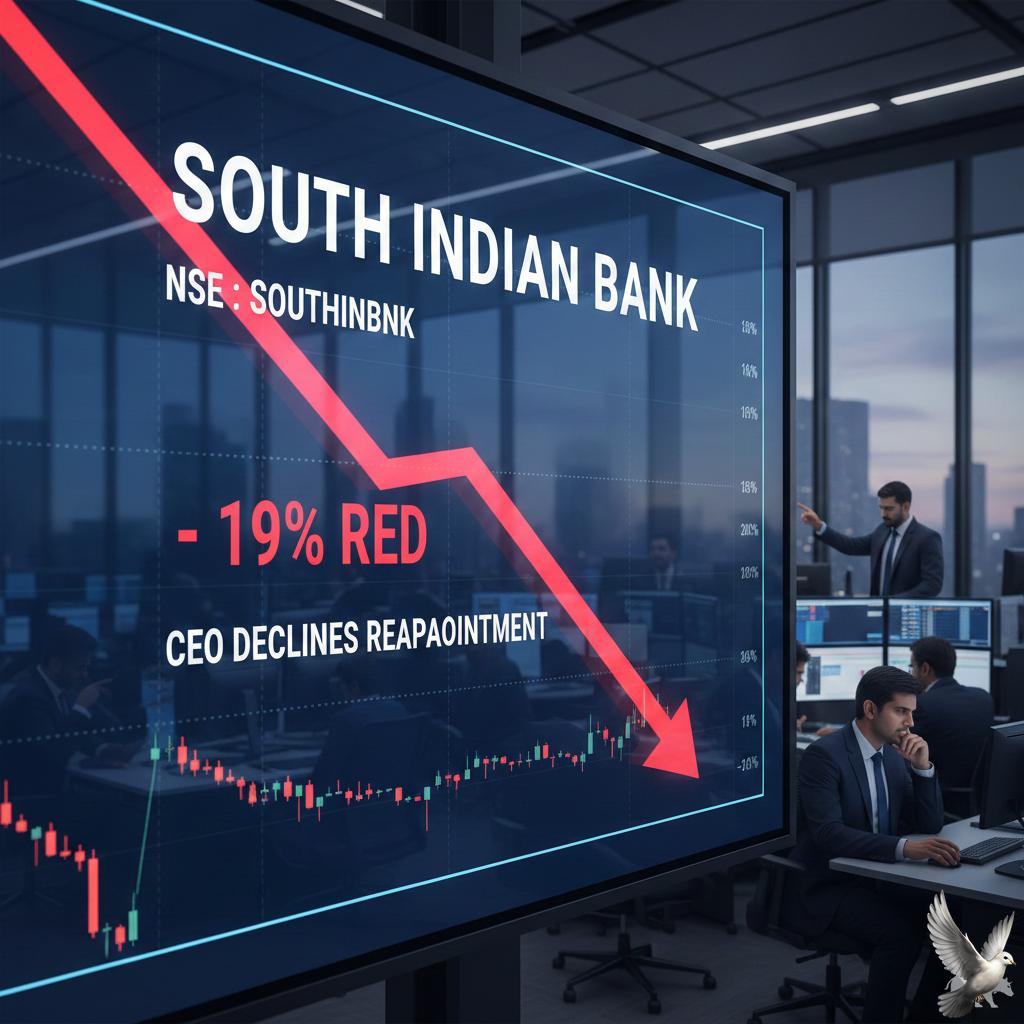
South Indian Bank Shares Fall 19% After CEO Declines Reappointment
**Market Brief: South Indian Bank** **Date:** January 30, 2026 **Executive Summary** South Indian Bank shares witnessed a significant sell-off today following the announcement that Managing Director & CEO **P.R. Seshadri** will not seek reappointment. The stock fell sharply, trading around **₹36.00**, marking an intraday decline of nearly **19%**. This drop makes it the largest single-day fall for the stock in recent history, erasing recent gains despite strong fundamental performance. **Leadership Transition** * **Announcement:** P.R. Seshadri informed the board on January 29, 2026, of his decision to step down due to personal interests. * **Timeline:** He will continue to lead the bank until his current term concludes on **September 30, 2026**. * **Succession:** The board has initiated a search for a successor, pending RBI and shareholder approval, ensuring a six-month transition period. **Financial Performance (Q3 FY26)** The market reaction contrasts sharply with the bank's robust operational health reported earlier this month: * **Net Profit:** Rose **9.4%** year-on-year to **₹374 crore**. * **Operating Profit:** Increased **10.4%** to **₹584 crore**. * **Asset Quality:** Showed marked improvement with Gross NPA dropping to **2.67%** (vs 4.30% YoY) and Net NPA improving to **0.45%**. * **Growth:** Total loan book expanded **11%** to **₹96,764 crore**, driven significantly by a **26%** surge in gold loans. **Market Sentiment** Investors have reacted negatively to the uncertainty of leadership succession rather than financial fundamentals. Prior to this correction, the stock had delivered a **137%** return over the last three years. The current valuation (P/E ratio ~8.33) remains relatively low compared to industry peers, yet immediate sentiment remains cautious as the market awaits clarity on the new appointment.

Vedanta Q3 Results: Share Price Movement and Market Analysis
**Market Brief: Vedanta Shares Correct Sharp 8% Despite Record Q3** **Market Action** Vedanta Limited shares plunged over **8%** in intraday trade on January 30, 2026, hitting lows near **₹702**. The sharp correction snaps a six-day winning streak and comes immediately after the company reported its highest-ever quarterly operational numbers. **Record Q3 FY26 Performance** On January 29, Vedanta announced standout earnings for the quarter ended December 2025: * **Record EBITDA:** Surged **34%** YoY to an all-time high of **₹15,171 crore**. * **Consolidated Net Profit:** Jumped **60%** YoY to **₹7,807 crore**. * **Revenue:** Rose **19%** to **₹45,899 crore**, driven by firm commodity prices and volume expansion. * **Margins:** EBITDA margins expanded significantly to **41%** (up **629 bps**). * **Deleveraging:** Net Debt-to-EBITDA ratio improved to **1.23x**, signaling balance sheet strength. **Why the Fall?** Despite the "blockbuster" earnings, three key factors triggered the sell-off: 1. **Profit Booking:** The stock had rallied **~77%** over the last year, touching a 52-week high of **₹769** just before results. Investors utilized the good news to lock in gains ("sell on news"). 2. **Sector Meltdown:** A broad-based crash in global commodities weighed heavily. Silver prices collapsed **6%**, while Copper and Gold fell **3–4%**, dragging the Nifty Metal Index down by over **5%**. 3. **Supply Pressure:** Market sentiment was dampened by Vedanta’s ongoing Offer for Sale (OFS) in subsidiary **Hindustan Zinc**, coupled with general liquidity absorption in the metal space. **Brokerage Verdict** Analysts remain bullish on the long-term story, citing the upcoming demerger and operational efficiencies. * **Investec:** Raised target price to **₹930**. * **Citi:** Hiked target to **₹900**, maintaining a 'Buy' rating. * **Motilal Oswal:** Retained 'Neutral' with a target of **₹810**, citing valuation concerns. **Key Monitorable** The company confirmed its demerger process is on track, with the listing of five independent entities expected by **May 2026**. This remains the primary value-unlocking trigger for long-term investors.
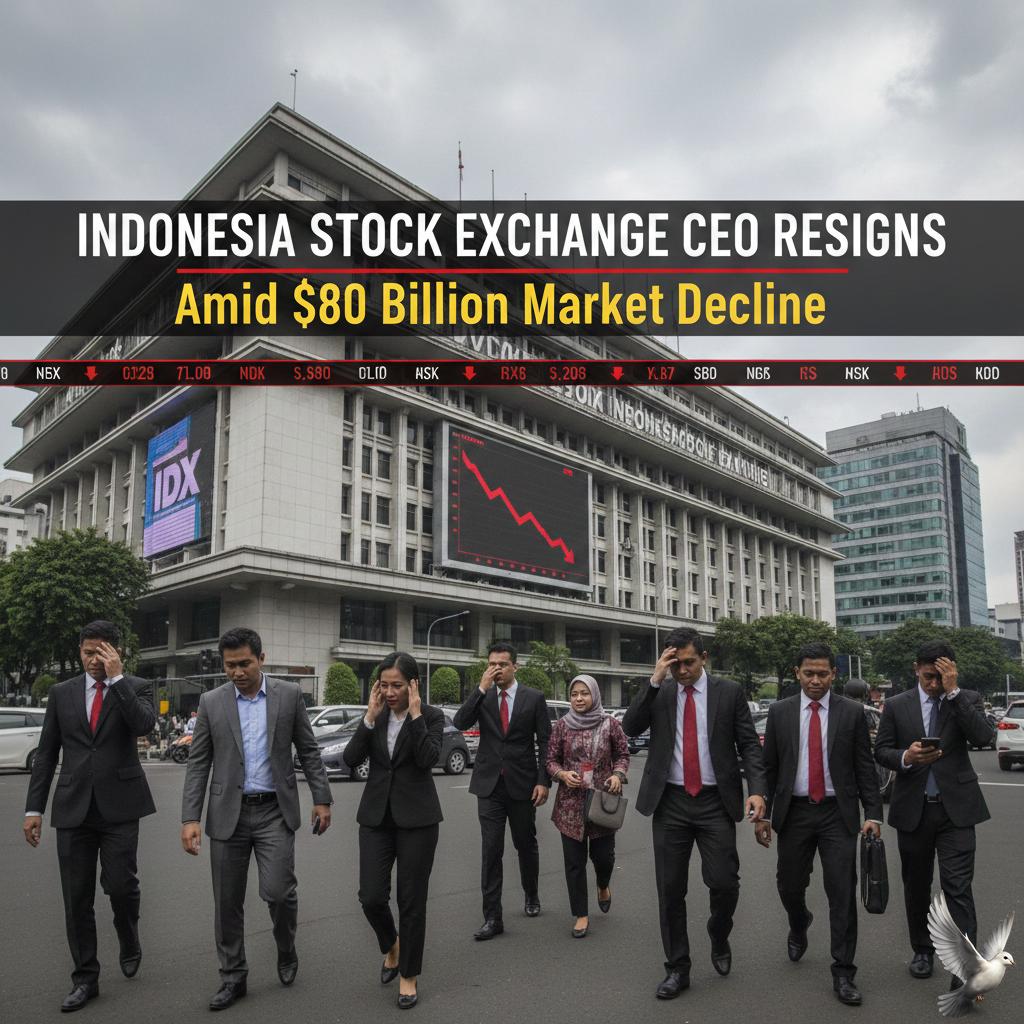
Indonesia Stock Exchange CEO Resigns Amid $80 Billion Market Decline
**Market Brief: Indonesia Stock Exchange Shake-up & Volatility** **Executive Summary** The Indonesia Stock Exchange (IDX) is undergoing a major leadership transition amid severe market volatility. **IDX CEO Iman Rachman** resigned today, January 30, 2026, assuming responsibility for a massive sell-off that erased approximately **$80 billion** in market value over two days. **Market Performance** * **Jakarta Composite Index (JCI):** The benchmark index plummeted more than **8%** earlier this week—its steepest decline in decades—before paring losses to trade near **8,372** on Friday. * **Currency:** The Indonesian Rupiah (IDR) weakened to a record low, trading around **16,985** against the US Dollar. * **Foreign Flows:** Foreign investors offloaded a net **$645 million** in Indonesian equities during the two-day rout. **Catalyst: MSCI Warning** The sell-off was triggered by a critical warning from index provider **MSCI**, which flagged serious concerns regarding ownership transparency and low free float in Indonesian stocks. MSCI has frozen index updates for the country and warned of a potential downgrade from "Emerging Market" to "Frontier Market" status—a move that would trigger automatic divestment by major global funds. **Regulatory Response & Measures** To stem the bleeding and restore investor confidence, the Financial Services Authority (OJK) and IDX announced immediate corrective measures: * **Free Float Requirement:** The minimum free float for listed companies will be doubled from **7.5%** to **15%**. * **Institutional Limits:** Pension funds and insurance firms are now permitted to increase their capital market exposure cap to **20%** (up from 8%). * **Transparency:** Authorities pledged to disclose Ultimate Beneficial Owner (UBO) data to address opacity concerns. **Outlook** While the index showed a slight rebound on Friday following the regulatory announcements, sentiment remains fragile. Market participants are closely monitoring the implementation of these reforms ahead of MSCI's next review deadline in **March 2026**.
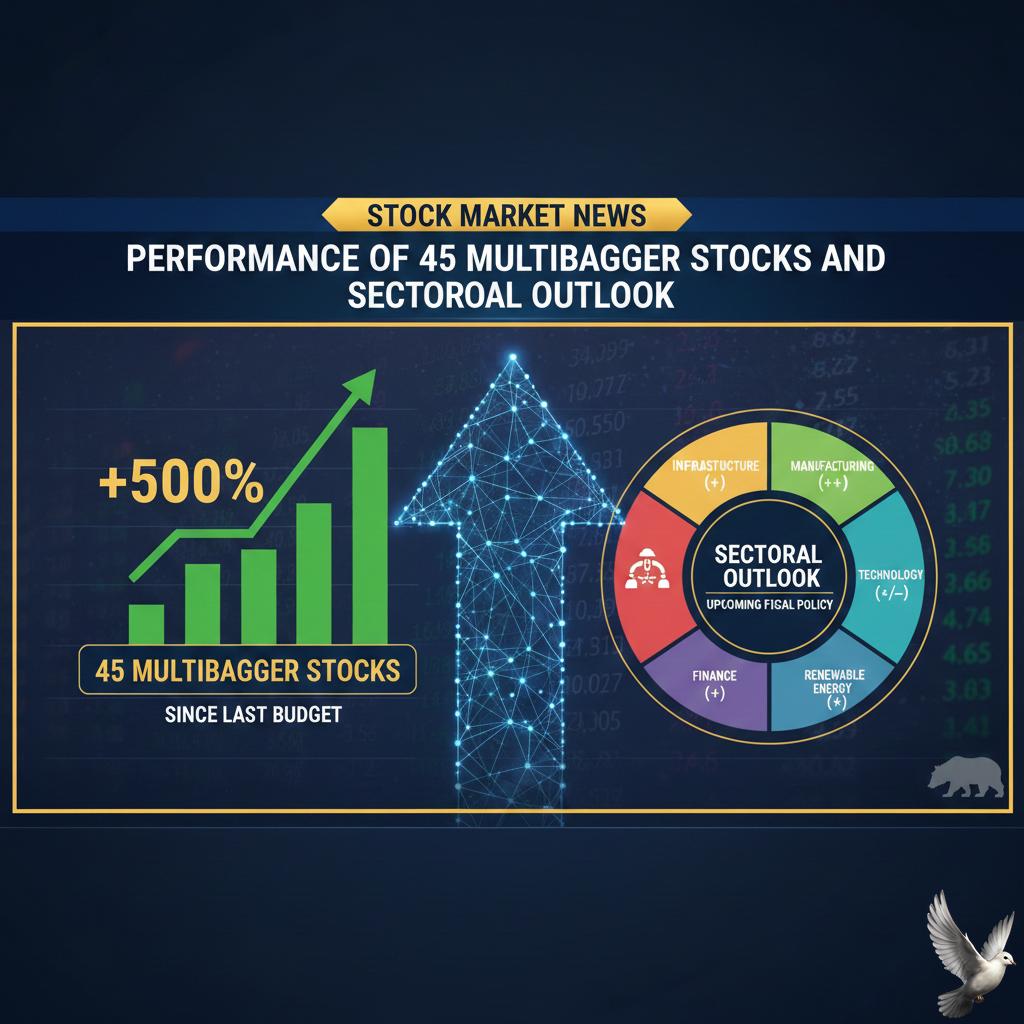
Performance of 45 Multibagger Stocks Since Last Budget and Sectoral Outlook for Upcoming Fiscal Policy
The market approaches the presentation of the Union Budget for Fiscal Year 2027 with rational, rather than speculative, expectations. The central theme remains one of **investment-led growth** anchored by public spending, coupled with firm **fiscal prudence**. A consensus among brokerages suggests the scope for a massive, broad-based fiscal stimulus is limited. Instead, the focus is on highly **targeted measures** designed to maximize the economic multiplier effect and crowd in private capital. This calibration will determine sectoral performance in the coming year. *** Macroeconomic Stability and Fiscal Anchors India’s macroeconomic fundamentals remain exceptionally strong, positioning it as a global outlier. The recent Economic Survey projects real GDP growth for FY27 to be robust, stabilizing in the range of **6.8% to 7.5%**. This continues India’s trajectory as the world’s fastest-growing major economy. Crucially, the government is committed to its consolidation roadmap. A primary expectation is a clear path to reducing the fiscal deficit to approximately **4.4% of GDP** for the next fiscal cycle, down from previous levels. This discipline is essential for long-term stability and sustained foreign investor confidence. The continued emphasis on **Capital Expenditure (CapEx)** is expected to be the main growth engine. Market estimates anticipate the central government's CapEx outlay to exceed **₹12 lakh crore** for FY27, representing a projected year-on-year increase of between **10% and 15%**. *** Infrastructure: From Outlay to Outcome Infrastructure investment remains central to the growth strategy. The spending push is heavily weighted toward core segments like roads, railways, and multimodal logistics, under the **PM Gati Shakti** initiative. The policy narrative is shifting from merely increasing the spending **outlay** to improving **outcome delivery** and execution efficiency. This involves maximizing the utilization of existing assets through monetization programs and accelerating project completion to reduce logistics costs nationwide. Sectors tied to execution, like cement, steel, and construction financing, are positioned to benefit structurally from this sustained, high-level public investment, providing long-term revenue visibility. *** Defence and Manufacturing: Structural Shifts The **Defence** sector continues its transformation from an import-dependent regime to a strategic growth story driven by indigenization. The Ministry of Defence allocation for the previous year was already significant at **₹6.81 lakh crore**. Further capital outlay growth of **10% to 15%** is priced in for the upcoming year. Indigenous production reached a record high of approximately **₹1.5 lakh crore** in FY25. Export performance is accelerating dramatically, having surged to **₹23,622 crore**. Policy support is aimed at achieving a domestic production target of **₹3 lakh crore** by 2029. In **Manufacturing**, the focus is on bolstering supply-side competitiveness and moving beyond basic assembly. Incentives under the Production-Linked Incentive (PLI) schemes are expected to be refined and expanded into emerging high-value areas. Targeted measures are anticipated to support investment in deep-technology domains, including **Artificial Intelligence (AI)**, robotics, and the semiconductor ecosystem. Clarity on the roadmap for **Green Mobility** and the battery ecosystem is also a key expectation, signaling the next phase of industrial policy. The overall approach is a policy affirmation: prioritizing **investment-led momentum** and structural reforms over short-term consumption boosts, cementing India's reputation as a stable, high-growth economy.

Hindustan Copper Stock Outlook After 133% Rally in Two Months
**Market Brief: Hindustan Copper (Jan 30, 2026)** **Executive Summary** Hindustan Copper (HINDCOPPER) has witnessed high-velocity price action, delivering triple-digit returns over the past year. While the structural story remains robust due to strategic acquisitions and record global commodity prices, the stock faces immediate volatility, correcting approximately **7-8%** in intraday trade on January 30, 2026, to trade near the **₹675–₹709** levels. **Strategic Acquisition & Domestic Triggers** The primary catalyst for the recent rally is the company’s emergence as the "Preferred Bidder" for the **Baghwari-Khirkhori copper block** in Madhya Pradesh. Secured via e-auction on January 22, 2026, this acquisition is pivotal for securing raw material security and expanding production capacity. This development aligns with India’s aggressive infrastructure push, directly benefiting state-owned miners. **Global Commodity Supercycle** The stock’s momentum is heavily correlated with a historic surge in global copper prices. LME copper futures recently breached **$13,000–$14,000 per tonne**, driven by: * **Supply Shocks:** Major disruptions, including the force majeure at the Grasberg mine (Indonesia), have tightened global output. * **Structural Demand:** Accelerating needs from Green Energy transitions, Electric Vehicle (EV) manufacturing, and the burgeoning AI data center sector. * **Regulatory Moves:** CME Group recently hiked margins by **20%** to manage extreme volatility, signaling a high-risk, high-reward environment. **Valuation & Technical Outlook** Despite the bullish macro backdrop, analysts advise caution regarding stretched valuations. * **Premium Pricing:** The stock currently trades at a Price-to-Earnings (P/E) multiple exceeding **100x–115x**, a significant premium over peers like Hindalco and Vedanta (trading closer to 12x–15x). * **Overbought Signals:** Technical indicators such as the RSI recently crossed **70**, triggering profit-taking. * **Wealth Creation:** Long-term holders have seen wealth multiply, with the stock gaining over **175–200%** in the last year, far outperforming the Nifty Metal index. **Investment Implication** The long-term trajectory for Hindustan Copper remains supported by a structural deficit in the global copper market and domestic capacity expansion. However, the current divergence between price and fundamental valuation suggests a phase of consolidation or volatility. Investors are navigating a trade-off between immediate overvaluation risks and the multi-year commodity upcycle.
Muthoot Finance Closes $600 Million Bond Issue
Muthoot Finance has successfully priced a **$600 million** dollar bond issuance, capitalizing on robust demand to secure a yield of **5.75%**—significantly tighter than the initial guidance of **6.125%**. The four-and-a-half-year senior secured notes, maturing in **2030**, underscore strong investor confidence in the gold loan giant's credit profile despite broader market volatility. **Issuance Details & Strategic Deployment** This transaction marks Muthoot Finance’s third venture into the overseas bond market within the last year, reinforcing its strategy to diversify funding avenues beyond domestic borrowings. Proceeds are earmarked for onward lending, aiming to fuel growth in its core gold loan portfolio. The issuance comes at a critical time as the company seeks to leverage its "Gold Loan" assets, which are currently backed by record-high underlying commodity prices. **Market Reaction & Sector Context** While the bond sale was well-received by global fixed-income investors, the company's equity faced headwinds in domestic trading. On January 30, 2026, Muthoot Finance shares witnessed a sharp correction, trading down approximately **6.8%** to the **₹3,812** level on the NSE, amidst a broader sell-off in financial stocks. **Macro Environment** The raise occurs against a backdrop of historic highs in the precious metals market, with gold prices recently surging past **$5,500 per ounce**. This valuation boost provides a substantial buffer for Muthoot’s loan-to-value ratios, potentially offsetting concerns about the stock's short-term volatility. The deal also highlights a revival in Indian corporate dollar bond activity, signaling an active start to 2026 for high-yield issuers tapping global liquidity.

SpaceX Explores Mergers with Musk Companies Ahead of IPO
**Market Brief: Musk Empire Consolidation & IPO Strategy** **Executive Summary** Reports emerging in late **January 2026** indicate that SpaceX is actively exploring merger discussions with xAI and potentially Tesla. These strategic moves appear designed to consolidate Elon Musk’s holdings into a unified "hard tech" conglomerate ahead of a landmark public listing. Legal filings in Nevada from **January 21, 2026**, reveal the creation of specific merger subsidiaries, signalling that formal structural preparations are already underway. **Merger Discussions & Structure** **SpaceX & xAI** The most advanced discussions involve a merger between SpaceX and xAI. This deal would likely involve a stock-for-stock exchange, integrating xAI’s generative models directly with SpaceX’s orbital infrastructure. This follows xAI’s aggressive expansion, having just closed a **$20 billion** Series E funding round in early **2026**. **SpaceX & Tesla** Simultaneously, reports suggest internal deliberations regarding a combination with Tesla. While more complex due to Tesla’s status as a publicly traded entity (market cap fluctuating between **$1.4 trillion** and **$1.56 trillion**), investors are analyzing this as a move to unify energy storage capabilities with space-based computation needs. **Legal Movements** The formation of entities named "K2 Merger Sub" in Nevada, listing SpaceX CFO Bret Johnsen as an executive, provides concrete evidence that corporate restructuring is active. **Valuation & IPO Targets** **SpaceX Public Listing** SpaceX is targeting a massive Initial Public Offering (IPO), tentatively scheduled for **June 2026**. * **Target Valuation:** **$1.5 trillion** * **Capital Raise:** Up to **$50 billion** * **Previous Valuation:** **$800 billion** (via private tender offers) If successful, this would be the largest IPO in history, surpassing Saudi Aramco’s **2019** record. **xAI Financial Standing** * **Current Valuation:** **$230 billion** (post-money, **January 2026**) * **Recent Inflows:** Tesla recently invested **$2 billion** into xAI, mirroring a previous **$2 billion** commitment from SpaceX. **Strategic Rationale: The Orbital AI Cloud** The primary driver behind these consolidations is the development of space-based data centers. * **Energy & Compute:** Moving AI training and inference to orbit allows access to unmitigated solar power and natural radiative cooling, addressing the critical energy bottlenecks faced by terrestrial data centers. * **Vertical Integration:** A merger allows the "Colossus" supercomputer clusters to be deployed via Starship launch vehicles without cross-company friction. * **Defense Contracts:** The combined entity would be uniquely positioned for Pentagon contracts, leveraging Starshield satellites enhanced with proprietary xAI defense algorithms—a market segment where xAI has already secured a **$200 million** contract. **Market Sentiment & Risks** Investors are currently pricing in a "conglomerate premium," anticipating that a unified Musk entity could dominate multiple sectors simultaneously: aerospace, energy, artificial intelligence, and telecommunications. However, the complexity of merging a public giant (Tesla) with private entities (SpaceX, xAI) raises significant questions regarding shareholder equity and governance. The probability of a standalone SpaceX-xAI merger is currently viewed as higher than a full three-way consolidation involving Tesla, given the regulatory scrutiny a take-private or merger of that scale would invite. **Timeline to Watch** * **Q1 2026:** Finalization of merger structures. * **June 2026:** Projected IPO window for the consolidated SpaceX entity.

Budget 2026: Market Preview, Key Triggers, and Investment Outlook
Market Brief: Budget 2026 & Key Indicators **Foreign Outflows & Currency Pressure** Market sentiment remains cautious as foreign institutional investors (FIIs) continue their selling streak, with January 2026 outflows surpassing **₹35,000 crore**. This sustained exit has exerted immense pressure on the domestic currency, pushing the Indian Rupee to a fresh lifetime low of **92.00** against the US Dollar. **Indices & Volatility** Equity benchmarks have shown high volatility ahead of the Union Budget. The Nifty 50 recently tested lows near **25,150** before staging a mild recovery to hover around **25,400**. Investors are treading carefully, balancing domestic growth signals against global headwinds like steady US Federal Reserve rates and rising oil prices. **Sectoral Watch: Defense, Railways, Data Centers** * **Defense:** Expectations are high for an **8–10%** increase in capital outlay. The focus is on indigenization and executing existing contracts rather than just new headline announcements. * **Railways:** A steady capital allocation of approximately **₹2.65 lakh crore** is anticipated. The priority has shifted toward safety upgrades, signaling systems, and rolling stock modernization. * **Data Centers:** With the AI boom driving demand, the industry awaits "green" incentives. Stakeholders are looking for tax breaks on renewable energy components and infrastructure status to support a projected **14 GW** capacity by 2035. **Global Headwinds & Trade** External risks loom large as the US administration maintains a tough trade stance. Concerns over potential **50% tariffs** on select Indian exports have dampened sentiment in export-oriented sectors. Markets are looking to Finance Minister Nirmala Sitharaman for a budget that balances fiscal consolidation with measures to insulate the economy from these trade shocks. **Fiscal Math & Strategy** Investors demand a credible path to fiscal prudence. The government is expected to prioritize capital expenditure (capex) execution over aggressive spending hikes, aiming to stabilize capital flows and reassure global rating agencies amidst the prevailing uncertainty.
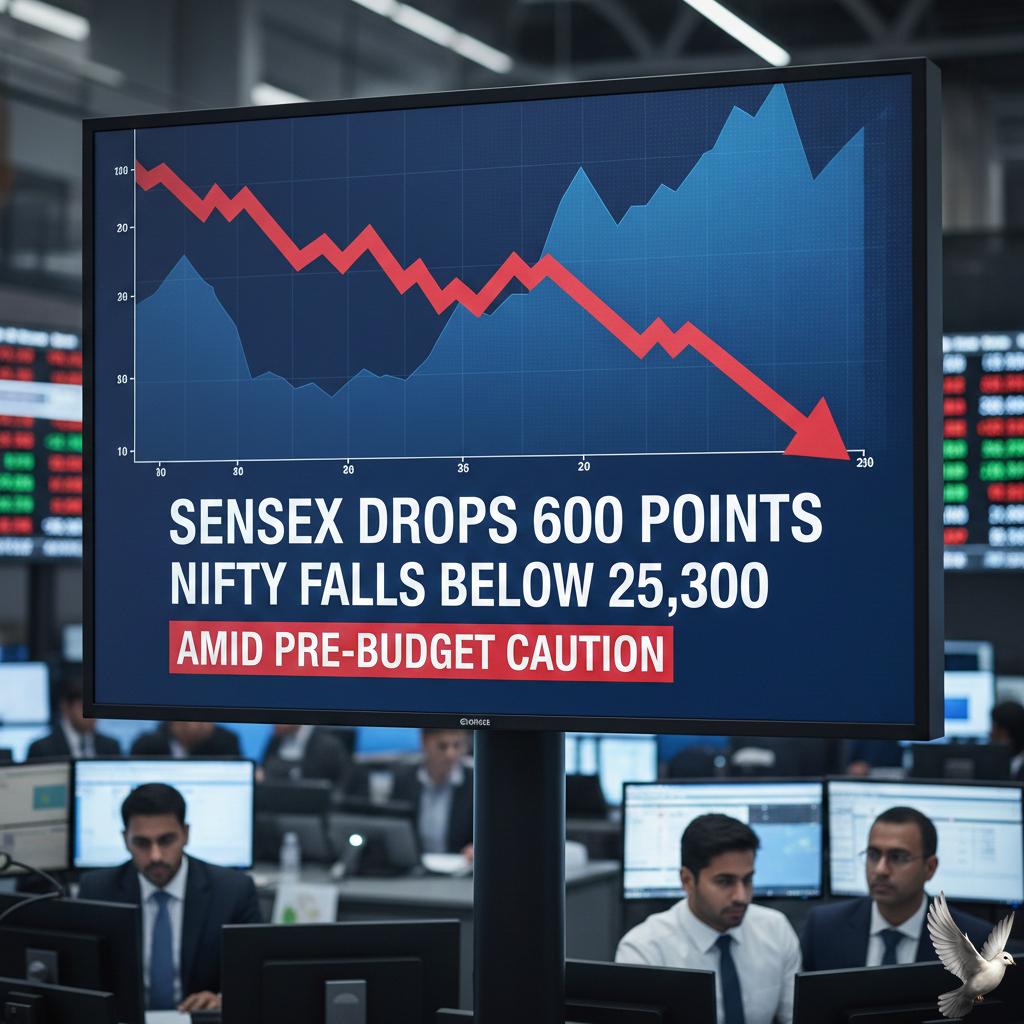
Sensex Drops 600 Points, Nifty Falls Below 25,300 Amid Pre-Budget Caution
**Market Brief: Friday Selloff Pre-Budget** **Market Snapshot** Indian equity benchmarks witnessed a sharp correction on Friday, **January 30**, snapping a three-day winning streak. Volatility spiked as investors booked profits and adopted a defensive stance ahead of the upcoming Union Budget. **Key Indices** * **BSE Sensex:** Tumbled over **500 points**, trading around the **82,000** mark. * **NSE Nifty:** Slipped below the psychological **25,300** level, shedding approximately **150–170 points**. * **Broader Market:** Midcap and Smallcap indices underperformed, dropping over **1%** as risk appetite faded. **Primary Drivers** * **Pre-Budget Caution:** With the Union Budget presentation scheduled for **February 1**, traders lightened positions to mitigate event risk. * **Foreign Outflows:** Persistent selling by Foreign Institutional Investors (FIIs) dampened sentiment. FIIs have offloaded nearly **₹43,000 crore** in Indian equities throughout January. * **Global Cues:** Weakness in US technology stocks and geopolitical tensions weighed on global markets, dragging domestic indices lower. **Sectoral & Currency Impact** * **Laggards:** IT and Metal sectors led the fall. Major heavyweights like **Tata Steel**, **Infosys**, and **HCL Tech** saw significant cuts. * **Resilience:** Defensive sectors offered some shelter, with select **FMCG** stocks like ITC and Hindustan Unilever trading in the green. * **Rupee Weakness:** The Indian Rupee remained under pressure, hovering near record lows of **91.92** against the US Dollar, further impacting investor confidence. **Outlook** The market remains in a "wait-and-watch" mode. Analysts expect volatility to persist until the Budget announcement clarifies the government's fiscal roadmap and capital expenditure plans for FY27.
Silver Falls Rs 24,000/kg to Below Rs 4 Lakh; Gold Drops Rs 10,000/10g
**Market Brief: Precious Metals See Sharp Profit-Taking Amid Historic Monthly Rally** **Date:** Friday, January 30, 2026 Gold and silver futures on the MCX witnessed a brutal sell-off today, opening sharply lower as investors rushed to lock in profits following a record-breaking rally. The volatility comes just a day after both metals hit fresh lifetime highs, driven by a rebound in the US dollar and nervousness ahead of key US economic announcements. **Price Action & Volatility** The correction has been steep. **MCX Silver** futures (March contract) crashed over **3%**, shedding more than **₹12,000** to trade near the **₹3,87,700** per kg level. This marks a sharp reversal from Thursday’s peak where prices briefly touched a historic **₹4,20,048**. **MCX Gold** (February contract) followed suit, dropping approximately **1.28%** (down over **₹2,100**) to trade around **₹1,67,241** per 10 grams. In the international market, Spot Gold retreated to the **$5,230–$5,350** per ounce range, pulling back from its record high of nearly **$5,600**. **Primary Drivers of the Dip** **1. Profit Booking:** After a relentless surge, the market was technically overbought. The sheer speed of the recent ascent—with Silver rallying **62%** in January alone—triggered a natural wave of liquidation as traders cashed out at peak valuations. **2. Dollar Rebound:** The US Dollar Index (DXY) bounced back from recent lows of **96**, creating immediate headwinds for dollar-denominated commodities. A stronger dollar makes bullion more expensive for overseas buyers, dampening demand. **3. Fed Chair Speculation:** Markets are jittery ahead of the expected announcement regarding the next Federal Reserve Chair. Rumors of a more "hawkish" nominee have prompted bond yields to tick higher, reducing the appeal of non-yielding assets like gold. **Historical Context: A Month for the History Books** Despite today’s red ink, the broader picture remains historically bullish. The pullback barely dents the massive gains accumulated throughout January 2026. * **Gold’s Milestone:** The yellow metal is still on track to close January with a gain exceeding **24%**. This represents its strongest monthly performance since **January 1980**, a period defined by extreme inflation and the Hunt brothers' silver crisis. * **Silver’s Record Run:** Silver’s performance is even more staggering. Up approximately **50–60%** month-to-date, the white metal is poised for its **best-ever monthly performance** on record. The industrial/precious hybrid has outperformed gold significantly, driven by acute physical shortages and mania-like sentiment in Asian markets. **Underlying Support** While the daily trend is negative, the fundamental floor remains elevated. Geopolitical friction continues to incentivize safe-haven buying. Tensions involving **Iran** and broader instability in the Middle East are keeping a risk premium embedded in prices. Furthermore, central bank accumulation and physical demand constraints suggest that dips are viewed by institutional players as consolidation phases rather than a trend reversal. **Summary** The market is currently digesting a massive run-up. While the short-term momentum has shifted to profit-taking, the medium-term trend remains anchored by historic buying pressure and systemic global risks. Investors are now watching the **$5,200** level for gold and **$110** for silver as critical support zones to gauge the strength of the next leg.