Bullish News
Collection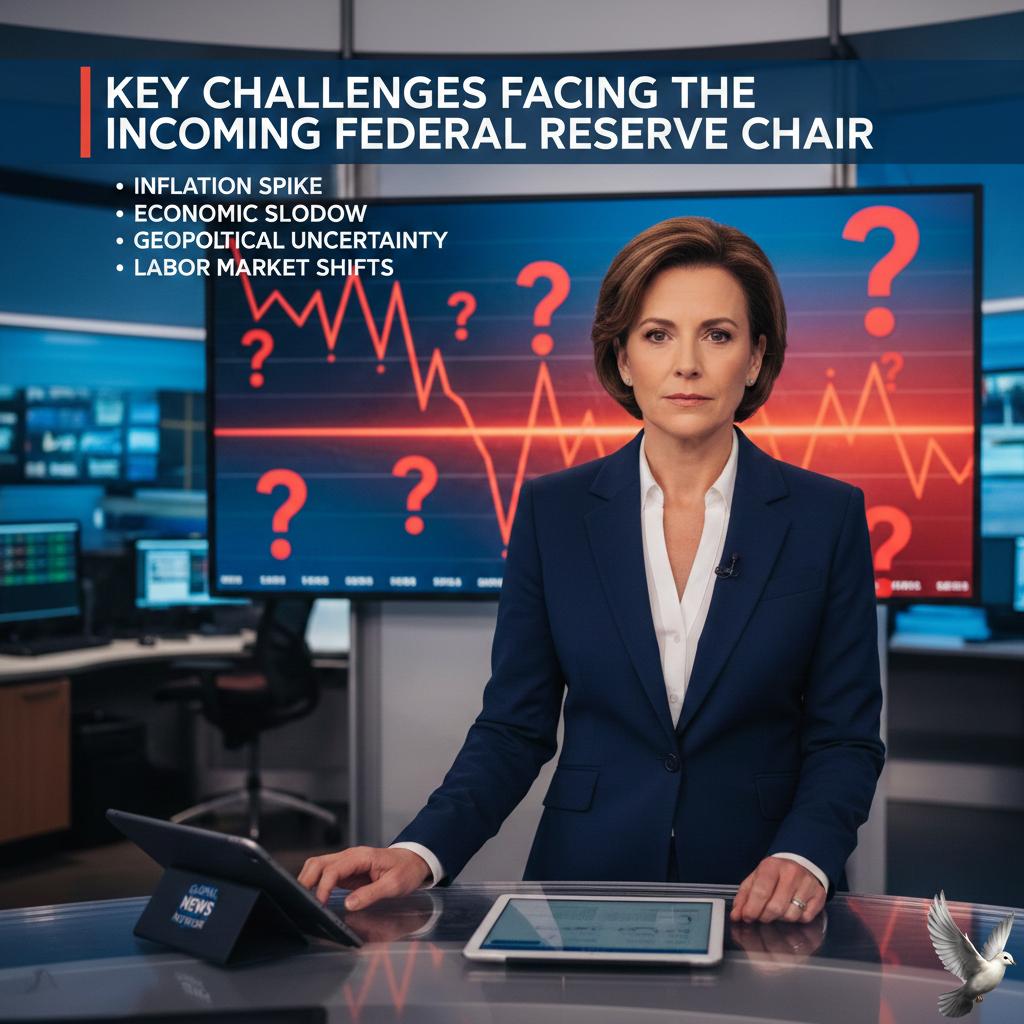
Key Challenges Facing the Incoming Federal Reserve Chair
**MARKET BRIEF: Trump Nominates Kevin Warsh as Fed Chair** **Saturday, January 31, 2026** **The Headline** President Donald Trump officially announced his nomination of former Federal Reserve Governor **Kevin Warsh** to succeed Jerome Powell as Chair of the Federal Reserve on Friday morning. The move signals a potential "regime change" at the central bank as Powell’s term approaches its May 2026 expiration. Trump described Warsh as "central casting" and predicted he would become one of the "great" Fed chairmen. The nomination follows months of speculation and marks a decisive shift toward a candidate who has historically criticized the Fed’s "easy money" policies while recently aligning with the White House’s push for lower rates. **Market Reaction: The "Warsh Tantrum"** Markets reacted sharply to the news on Friday, interpreting Warsh’s nomination as a prelude to a stronger dollar and potentially higher structural yields. * **Precious Metals Crash:** Gold and silver suffered a massive liquidity sell-off. Gold plunged over **4%**, falling to approximately **$5,115** per ounce. Silver collapsed nearly **13%**, dropping back to the **$100** level. * **Equities Dip:** Major indices finished Friday in the red, though they secured a positive month overall. The **S&P 500** slid **0.29%** to close near **6,949**, while the **Dow Jones** dropped **0.28%** to **48,932**. * **Yields & Dollar Rise:** The 10-year Treasury yield ticked up to **4.25%**, and the U.S. Dollar Index (DXY) strengthened, exerting immediate pressure on commodities and crypto assets like Bitcoin, which dipped to around **$83,000**. **The Policy Outlook** Warsh’s nomination comes just days after the Federal Open Market Committee (FOMC) voted to hold interest rates steady at the **3.50%–3.75%** range on January 28. While the current Fed leadership cites "solid" economic growth as a reason for patience, the incoming leadership transition introduces uncertainty. Investors are now recalibrating their models to account for Warsh’s complex reputation: a historical hawk on inflation who has recently echoed administration calls to support growth. The bond market’s immediate sell-off suggests traders are pricing in a higher probability of volatility and a definitive end to the Powell era’s consensus-driven approach.

Budget Day Settlement Rules and Implications for Equity Investors
Market Brief: Union Budget Special Session **Key Event: Special Sunday Trading** Indian stock markets (NSE & BSE) will remain **open** on Sunday, **February 1, 2026**, for a full live trading session during the Union Budget presentation. This marks a rare Sunday session to allow real-time price discovery as Finance Minister Nirmala Sitharaman presents the FY27 budget. **Trading Hours (Feb 1, 2026)** * **Pre-Open:** 09:00 AM – 09:08 AM * **Normal Market:** 09:15 AM – 03:30 PM * **Commodities (MCX):** 09:00 AM – 05:00 PM **Critical Settlement Update** Sunday, February 1 is a **settlement holiday**. * **Intraday:** Available as usual. * **T+0 Settlement:** **Suspended** for the day. * **Trade Settlement:** Transactions from **Friday, Jan 30** and **Sunday, Feb 1** will effectively settle on **Monday, Feb 2**. * **Selling Eligibility:** Shares purchased on Jan 30 may not be eligible for selling on Feb 1 due to the holiday gap, depending on broker policies. **Market Expectations & Strategy** Analysts expect a **fiscal consolidation** path with a deficit target near **4.3%** of GDP. * **Focus Areas:** Continued heavy lifting on **Capital Expenditure (Capex)** with projected growth of **~10-15%**. * **Key Sectors:** **Defence** (modernization push), **Infrastructure** (power & nuclear), and **Rural Consumption** (demand boosters). * **Volatility Alert:** Markets often see sharp intraday swings during the speech. Traders should maintain strict stop-losses as liquidity fluctuates with policy announcements. **Actionable Insight:** Review your **BTST (Buy Today, Sell Tomorrow)** positions from Friday; the settlement holiday may block selling these shares on Sunday. Ensure sufficient margin is available for Sunday trades as unsettled proceeds from Friday will likely be blocked until Monday.
Silver Drops 17% in Single Day to Trade Near Rs 70,000
**Silver Market Brief: Historic Rally Snapped by Sharp Correction** **Date:** January 31, 2026 **Market Status:** Volatile / Corrective Phase Silver’s unparalleled bull run hit a major turbulence zone this weekend. After a record-breaking January rally—where prices surged over 70%—the metal witnessed a massive single-day sell-off on January 30, plunging nearly **₹70,000** per kg in futures trade. **Key Market Data (as of Jan 31, 2026):** * **MCX Silver Futures:** Crashed approximately **17%** in a single session, slipping decisively below the psychological **₹4 lakh** mark. * **Current Spot Levels:** Consolidating near **₹3.95 lakh per kg** in retail markets (e.g., Mumbai, Delhi) after touching highs of ₹4.20 lakh earlier in the week. * **Global Benchmark:** Comex Silver retreated sharply from its peak of over **$120 per ounce**, dropping below **$107** amid heavy profit-booking. **Why the Sudden Drop?** * **Profit-Booking:** Investors rushed to cash in on "vertical" gains after one of the strongest monthly performances on record. * **Dollar Strength:** A rebound in the US Dollar Index (DXY) pressured precious metals, making them more expensive for foreign buyers. * **Fed Policy Fears:** Speculation regarding a hawkish Federal Reserve Chair nomination (Kevin Warsh) dampened sentiment for non-yielding assets like silver. **Analyst Outlook** Despite the steep correction, market veterans believe the structural bull trend remains intact, driven by: 1. **Industrial Demand:** Critical shortages persist in sectors like solar energy and AI hardware. 2. **Supply Deficit:** Global silver production continues to lag behind consumption for the sixth consecutive year. 3. **Support Zones:** Analysts identify the **₹3.55 lakh – ₹3.60 lakh** range as a critical base for potential re-entry. **Bottom Line:** While the long-term story is bullish, the market is currently working off "extreme overbought" conditions. Expect continued high volatility as traders weigh the risks of further profit-taking against buying the dip.

Nestle India Reports Q3 Results, Declares Rs 7 Interim Dividend
**Market Brief: Nestle India Q3 Earnings & Dividend** **Date:** January 31, 2026 **Headline Numbers** Nestle India has reported a stellar performance for the quarter ended December 31, 2025 (Q3 FY26), posting a **46% year-on-year surge in net profit** to approximately **₹1,018 crore**. Revenue from operations climbed **18.5%** to **₹5,667 crore**, driven by the company's strongest volume growth in nearly five years. **Dividend Declaration** The Board of Directors announced an interim dividend of **₹7 per equity share** for the financial year 2025-26. * **Record Date:** February 6, 2026 * **Payout Date:** From February 26, 2026 **Key Growth Drivers** * **Volume Surge:** All four major product groups (Confectionery, Beverages, Prepared Dishes, Milk Products) delivered positive volume-led growth. * **Strategic Investments:** A **42% increase** in consumer-facing media and advertising spending boosted brand visibility. * **Channel Momentum:** Rapid expansion seen in Quick Commerce and rural markets, alongside double-digit growth in the Out-of-Home segment. * **Operational Efficiency:** EBITDA margins remained resilient at **21.3%** despite higher marketing outlays. **Market Reaction** Following the announcement on Friday, January 30, Nestle India shares surged over **3.4%** to close at **₹1,332.40** on the NSE, outperforming the broader sector. The stock hit an intraday high near its 52-week peak, reflecting strong investor sentiment. **Commodity & Cost Outlook** * **Coffee:** Prices have stabilized at lower levels compared to last year due to favorable yields. * **Milk & Oils:** Milk prices remain firm due to robust demand, while edible oil prices are expected to stay elevated through the first half of 2026. *

EMS Valuations, Oil, and Paytm in Focus Amid Pre-Budget Caution
**Market Brief: EMS Correction, Oil Surge & Fintech Turnaround** **Date:** January 31, 2026 **EMS Sector: Valuation Reality Check** **Dixon Technologies** Market expert Sandip Sabharwal’s caution regarding high-valuation EMS stocks appears validated as **Dixon Technologies** faces a significant correction. * **Current Status:** The stock is trading around **₹10,444**, down sharply from its 52-week high of over **₹18,400**. * **Valuation Concerns:** Despite a reported Q3 profit increase (~67% YoY), the market is reacting to "expensive" valuation multiples (P/E ~40x) rather than just earnings growth. * **Outlook:** Investors are prioritizing earnings quality over pure revenue numbers. The steep price erosion suggests the "growth at any price" narrative is fading, aligning with the view that structural margins in EMS remain thin relative to valuations. **Oil & Gas: Tactical Outperformance** **ONGC (Oil and Natural Gas Corporation)** The "tactical" call on oil plays is delivering results, driven by a sudden spike in global crude prices. * **Price Action:** ONGC shares have surged to a **15-month high** of approximately **₹275**, gaining nearly **11%** in recent sessions. * **Key Drivers:** * Global crude rallying to **$67/barrel** on supply concerns. * **4.5% Dividend Yield** providing a safety net. * New resource-sharing pacts with private players (e.g., Reliance) boosting sentiment for deepwater projects. * **Verdict:** The stock remains a strong tactical play, benefiting from undervalued entry points and favorable macro tailwinds in the energy sector. **Fintech: Profitability vs. Structural Doubts** **Paytm (One 97 Communications)** While the "guarded stance" persists due to business model risks, the operational numbers show a stark turnaround. * **Financial Shift:** Paytm reported a consolidated Q3 net profit of **₹225 crore**, swinging from a loss of ₹208 crore a year ago. * **Market Reaction:** The stock has recovered to trade around **₹1,138**, showing resilience. * **The Caveat:** Despite the profit jump, caution remains regarding the "low-PE" nature of the payment distribution business. The debate continues on whether this profitability is sustainable long-term or merely a cyclical recovery from regulatory lows. **Summary:** The market is punishing "priced-to-perfection" growth stocks (Dixon) while rewarding value plays with tangible cash flows (ONGC). Fintech (Paytm) is in a recovery phase but still demands scrutiny on long-term structural margins. [Sandip Sabharwal Analytics On Defense, CVs & Corporate Earnings](https://www.youtube.com/watch?v=dXB3kkd3Upw) This video provides the latest direct commentary from Sandip Sabharwal on sector moves, including his specific rationale for caution on high-valuation segments and tactical views on commodities. http://googleusercontent.com/youtube_content/0
Brookfield India REIT Reports Q3 Net Profit of Rs 201 Crore
**Market Brief: Brookfield India REIT Q3 FY26 Performance** **Report Date:** January 31, 2026 **Headline Performance** Brookfield India Real Estate Trust (BIRET) delivered a standout performance for the quarter ended December 2025, reporting a consolidated net profit of **₹201.22 crore**. This marks an **8-fold increase** year-on-year compared to ₹23.42 crore in the same period last fiscal. **Financial Highlights** * **Total Income:** Rose to **₹727.86 crore**, up from ₹635.38 crore in the previous year, driven by strong leasing momentum and escalation in operating rentals. * **Unitholder Distribution:** The Trust declared a total distribution of **₹404.66 crore**, translating to **₹5.40 per unit** for the quarter. * **Tax Efficiency:** Recent reports indicate a sharp reduction in effective tax rates contributed significantly to the bottom-line surge. **Operational Footprint** The REIT continues to strengthen its position as a leading office landlord in India: * **Portfolio Size:** Manages **37 million sq ft** of total leasable area across 11 Grade-A assets. * **Asset Breakdown:** Includes 32.4 million sq ft of operating area, 0.6 million sq ft under construction, and 4 million sq ft of future development potential. * **Key Markets:** diverse presence in Mumbai, Gurugram, Delhi, Noida, Bengaluru, and Kolkata. **Market Reaction & Stock Update** Following the results, BIRET shares witnessed positive traction: * **Current Price:** Trading at approximately **₹353**, reflecting a nearly **5% gain** in recent sessions. * **Market Cap:** Stands at roughly **₹27,300 crore**. * **Valuation Context:** While the profit jump is substantial, analysts note the stock trades at a premium to the broader realty sector, supported by its high-quality institutional portfolio and consistent payout history. **Strategic Outlook** The significant rise in profitability underscores the trust's ability to leverage operational efficiencies and scale its portfolio through strategic acquisitions. With occupancy levels stabilizing and rental income growing, the focus remains on organic growth and timely execution of the under-construction pipeline.
Strides Pharma Q3 Net Profit More Than Doubles to Rs 208.12 Crore
**Market Brief: Strides Pharma Science Q3 FY26 Results** **Strides Pharma Science Ltd** has reported a robust financial performance for the third quarter ended **December 31, 2025**, driven by operational efficiency and significant one-time gains. The results triggered immediate bullish sentiment, with the stock witnessing a sharp rally in Friday's trade. **Financial Highlights** * **Net Profit:** Consolidated net profit surged over **2x** to **Rs 208.12 crore** year-on-year (YoY), compared to **Rs 90.04 crore** in the same quarter last fiscal. * **Revenue:** Consolidated revenue from operations grew moderately by **3.6%** to **Rs 1,194.65 crore**, up from **Rs 1,153.67 crore** in Q3 FY25. * **EBITDA:** The company achieved its highest-ever quarterly EBITDA of **Rs 235.9 crore**, reflecting a **12.2%** increase YoY. EBITDA margins expanded by **160 basis points** to **19.8%**, signaling improved operational health. **Key Growth Drivers** * **Operational Boost:** The growth was primarily fueled by strong performance in **"Other Regulated Markets"** and **"Growth Markets,"** which helped offset flat performance in the US business. * **Exceptional Income:** A significant contributor to the bottom line was a one-time gain of **Rs 102.14 crore** from the sale of an investment property (land and building), which boosted reported profits beyond operational growth. * **Margins:** Gross margins improved substantially to **61.2%** (up **280 bps** YoY), attributed to a better product mix and cost control measures. **Market Reaction** Following the announcement, Strides Pharma shares witnessed strong buying interest on Friday, January 30, 2026. The stock surged approximately **8-10%** intraday, closing near **Rs 876–886** levels, outperforming the broader market trend. Trading volumes spiked nearly **tenfold**, indicating high investor conviction. **Management Commentary** MD & Group CEO **Badree Komandur** emphasized that the results demonstrate consistent execution and a strategic pivot toward profitability. While the US market remained flat, the company is actively strengthening its leadership there with the recent appointment of a new CEO for the North America business to drive future growth. **Next Steps** Monitor the sustainment of EBITDA margins in the upcoming quarters and the impact of the new North America leadership on US revenue trajectories.
Nestlé India Reports 45% YoY Q3 Profit Growth to ₹998 Crore; Declares ₹7 Dividend
**Nestlé India Q3 FY26: Record Volume Growth & ₹7 Dividend** **Financial Performance** Nestlé India delivered a robust performance for Q3 FY26 (ended December 2025), reporting a **45% YoY surge** in net profit to **₹998 crore**, significantly beating street estimates. Revenue from operations grew **19% YoY** to **₹5,667 crore**, driven by broad-based demand. Sequential profit momentum was equally strong, rising **34%** from the previous quarter. **Operational Highlights** The quarter marked the company's highest-ever quarterly turnover, underpinned by **18.5% volume growth**—the strongest in nearly five years. * **Segments:** Confectionery emerged as the fastest-growing category. Beverages recorded their **18th consecutive quarter** of double-digit growth. * **Channels:** E-commerce (led by Quick Commerce) and Out-of-Home (OOH) businesses posted accelerated double-digit expansion. * **Rural vs. Urban:** Growth was broad-based across all town classes, with rural markets showing significant resilience. **Corporate Action: Interim Dividend** The Board declared an interim dividend of **₹7 per share** for FY 2025-26. * **Record Date:** February 6, 2026 * **Payment Date:** From February 26, 2026 **Market Reaction & Stock Action** Following the results, Nestlé India shares rallied **~3.5%** to close near **₹1,332**, hitting a fresh **52-week high** of **₹1,339.85** on January 30. Technical analysts note a bullish breakout, driven by the highest volume-led recovery in the sector. **Management Commentary & Outlook** CMD Manish Tiwary attributed the performance to strategic capacity investments and a "consumer-first" media spend, which rose **42% YoY**. * **Commodities:** Milk prices remain firm due to robust demand. Coffee prices have stabilised lower than last year's peaks, while edible oil prices are expected to trade sideways through H1 2026. **Key Takeaway** With **EBITDA margins at 21.3%** and volume growth outpacing peers, Nestlé India continues to demonstrate pricing power and operational efficiency despite mixed input cost trends.

Cupid Shares Rise 13% Following Q3 Results and 4:1 Bonus Issue Announcement
Shares of Cupid Limited saw a sharp surge, peaking at an intraday high of **₹442** on the NSE, following the announcement of stellar Q3 FY26 performance and a highly anticipated **4:1 bonus issue**. The counter closed the session near **₹401.00**, sustaining a daily jump of approximately **10%** at its peak during heavy trading volume. The combination of record financial results and the strategic capital move signaled robust investor confidence in the company’s structural growth and aggressive future outlook. This movement continues a long-term upward trajectory, with the equity delivering exceptional returns of over **450%** in the past year alone. *** The December 2025 quarter proved to be the strongest in the company's operational history, with consolidated figures crushing previous benchmarks. **Net Profit** for Q3 FY26 rocketed to **₹33 crore**, marking an exponential jump of **196%** compared to the same period in the prior fiscal year. This massive surge in the bottom line was supported by corresponding strength in the top line. Total operating income also demonstrated explosive growth, surging **106%** year-on-year to reach **₹104 crore**. Sequentially, the performance remained strong, with net profit rising **36%** and total income up **16%** over the preceding quarter. *** Operational efficiency drove a remarkable improvement in profitability. Earnings Before Interest, Taxes, Depreciation, and Amortisation (**EBITDA**) soared by an impressive **201%** year-on-year. Correspondingly, the **EBITDA margin** expanded significantly, rising over **1,212 basis points** to a strong **37%**. This high margin profile is a clear indicator of successful execution of high-value international contracts and effective cost optimization. The operational excellence showcased in the quarterly results has helped maintain the firm's almost **debt-free** status and a strong liquidity position, with a total market capitalization currently exceeding **₹10,800 crore**. *** The company’s board approved a proposal for a **4:1** bonus issue, pending shareholder and regulatory approvals. This strategic capital restructuring is designed to achieve multiple key objectives. Primarily, it will improve stock affordability by proportionately reducing the per-share price, making the equity more accessible to a wider base of retail investors. The expanded equity base is also expected to enhance trading liquidity, offering greater flexibility to existing shareholders. This bonus is presented as a confident reflection of the management’s belief in Cupid’s sustainable growth trajectory and commitment to long-term value creation. *** The record performance was fundamentally driven by strength across three interconnected business pillars. The established **export-led B2B segment** continues to leverage high entry barriers supported by global certifications. Domestically, the scaling **FMCG brand** is rapidly increasing its footprint, utilizing a wide distribution network. Crucially, the **diagnostics division**, which includes various IVD kits, is seeing improving traction and is earmarked for future expansion. Management has issued a strong outlook for the full fiscal year. Based on the robust Q3 results and a record order book, they are confident of exceeding the revised **FY26 revenue guidance of ₹335 crore**. Furthermore, they expect the full-year net profit to exceed the **₹100 crore** milestone. Strategic capacity expansion plans, including scaling diagnostic kit production to approximately **4 lakh** kits per day by the end of **2026**, underscore the commitment to building a balanced and scalable business for the future.

Sabharwal Sees Value in ITC, Supportive CV Cycle, and Selective Defence Bets
**Market Brief: Pre-Budget Sectoral Outlook** **Defense Sector: Caution & Selectivity** Ahead of the Union Budget, the defense theme remains relevant but requires a shift in strategy. After a broad-based rally over the last 24 months, the sector has entered a consolidation phase. Experts advocate for **selective picking** rather than blind accumulation. While the Nifty Defence Index has delivered **22% gains** year-on-year, recent corrections suggest the easy money has been made. * **Trend:** The focus is now on execution capabilities rather than order book announcements. * **Strategy:** Investors are advised to avoid overvalued names and stick to companies with clear delivery visibility. **Commercial Vehicles (CV): The Cyclical Up-move** The Commercial Vehicle cycle is signaling a strong structural uptrend, driven by replacement demand and sustained infrastructure activity. * **Tata Motors vs. Ashok Leyland:** A clear divergence in valuation makes **Tata Motors (trading ~₹469)** the preferred pick over its peer. Despite Ashok Leyland’s strong operational performance, its valuation appears stretched at **~34x P/E** with a price of **₹195**. * **Outlook:** Tata Motors offers a more favorable risk-reward ratio, with analysts noting potential efficiency gains that are yet to be fully priced in. The general CV cycle remains supportive, with expectations of high single-digit growth if industrial activity holds. **ITC: The Value Defensive** ITC stands out as a stable value play in a volatile market. The stock offers a defensive safety net with a dividend yield of approximately **2%**. * **Valuation:** Trading at a comfortable **18x forward earnings**, ITC is not expected to deliver explosive growth but offers high probability for moderate returns (estimated **12–15%**). * **Trigger:** Recent quarterly results were solid across both Cigarettes and FMCG segments, reinforcing the "value buying" narrative despite broader market skepticism. **Swiggy: Profitability Concerns Persist** Sentiment around new-age tech, specifically Swiggy, remains bearish despite bullish analyst targets. * **Price Action:** The stock is currently trading near **₹310–313**, significantly below its 52-week high of **₹474**. * **Headwinds:** Intense competition from quick-commerce players (Zepto, Blinkit) is forcing a trade-off between growth and margins. Continued net losses and high cash burn make the path to profitability unclear. * **Expert View:** There is skepticism regarding the high price targets (some brokerage targets >₹550) assigned to the stock, given the difficult operational environment. **Summary Data Points** * **Tata Motors:** ~₹469 (Bullish Setup) * **Ashok Leyland:** ~₹195 (Expensive) * **Swiggy:** ~₹313 (Bearish Trend) * **ITC:** Value Buy at ~18x P/E [Auto, IT, Media & Energy Picks: Sandip Sabharwal Insights on Bajaj, Tata Power, IT Stocks & More](https://www.youtube.com/watch?v=QK2ZDn5AeSc) This video is relevant as it features Sandip Sabharwal discussing his specific sectoral views, including his bullish stance on the auto sector and cautious approach to others, directly complementing the market brief. http://googleusercontent.com/youtube_content/0

Gold Premiums Reach Decade High Amid Resilient Chinese Demand
**Market Brief: Gold's Historic Surge & Asian Premiums** **Global Markets: Record Highs** Gold prices touched a historic peak of nearly **$5,600 per ounce** this week before a corrective pullback to the **$5,100–$5,400** range. The unprecedented rally is driven by heightened geopolitical instability, central bank accumulation, and safe-haven capital flight. Volatility remains elevated as markets digest the new pricing paradigm. **India: Pre-Budget Buying Frenzy** Domestic markets are witnessing a sharp dislocation between spot prices and demand. * **Premiums:** Dealers are charging premiums up to **$121 per ounce**—the highest in over a decade. * **Drivers:** Aggressive investment buying is fueled by speculation that the upcoming Union Budget (Feb 1) may announce an import duty hike. * **Local Rates:** Domestic prices have surged past **₹1.67 Lakh per 10 grams**, yet investment appetite remains robust as buyers hedge against potential tax increases. **China: Lunar New Year Demand** Despite record global valuations, Chinese demand has shown resilience. * **Premiums:** Local premiums jumped to **$32 per ounce** (up from single digits previously). * **Sentiment:** Activity is driven by the pre-Lunar New Year rush and a renewed interest in bullion as a hedge against currency volatility. Retail investors are buying into the dip, betting on the long-term bullish trend. **Key Outlook** Traders are now focused on the **February 1 Union Budget** in India and the **Federal Reserve's** next policy signals. Immediate support lies near $5,240, with resistance re-forming at the $5,600 all-time high.
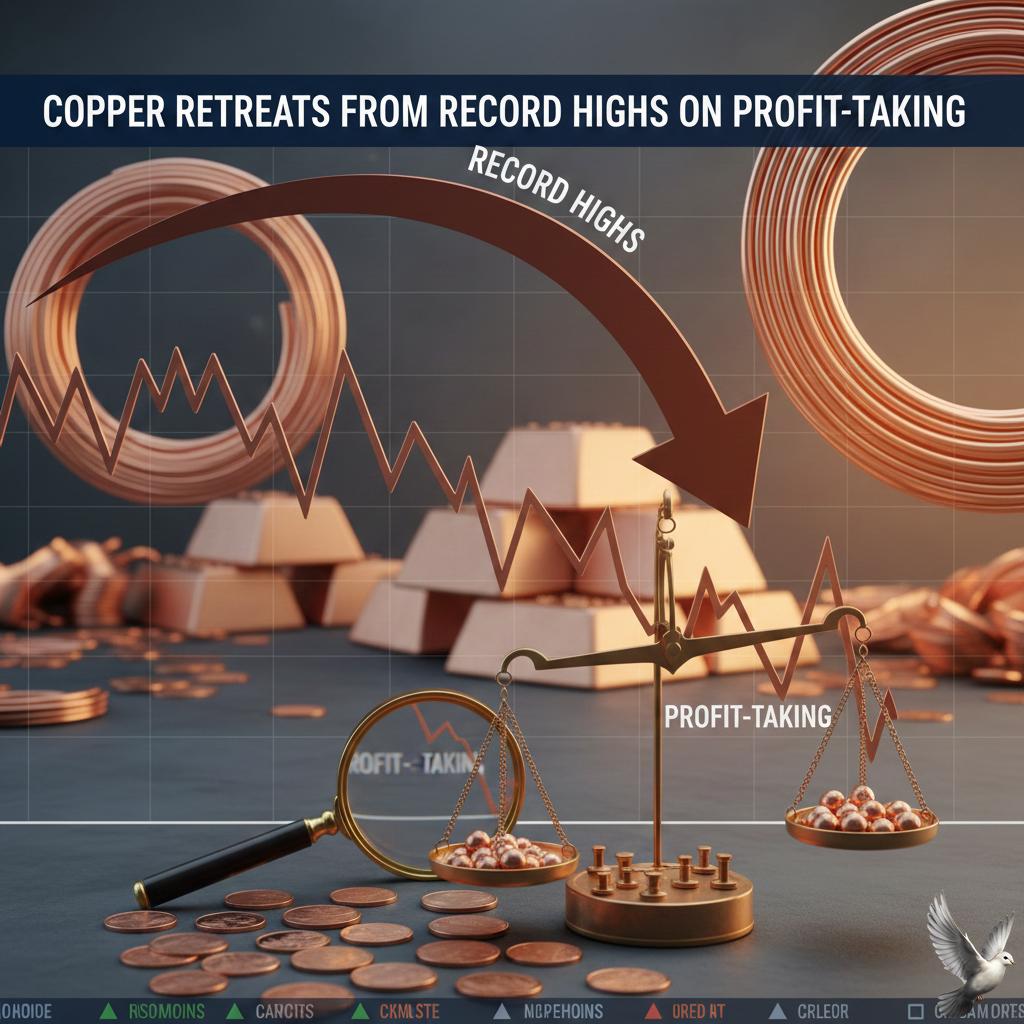
Copper Retreats From Record Highs on Profit-Taking
**Copper Retreats from Record Highs Amid Speculative Unwind** Copper prices faced a sharp correction on **Friday, January 30, 2026**, erasing a significant portion of the week's speculative gains. Despite hitting an all-time high just a session earlier, the red metal succumbed to profit-taking and tighter trading conditions, though it remains on track for a **monthly gain of approximately 6%**. **Market Moves & Key Figures** * **Record Peak:** Prices spiked to a historic high of **$14,527.50 per tonne** on the London Metal Exchange (LME) early Thursday, driven by aggressive fund buying. * **Friday Correction:** The metal gave back gains to trade near **$13,465 – $13,700 per tonne** on Friday, a drop of over **1%** intraday. * **Monthly Performance:** Even with the pullback, copper has risen roughly **6% in January**, following an **11% surge in December 2025**. **Drivers of the Sell-Off** **Profit Taking & Margin Hikes** Investors moved swiftly to lock in profits after the "debasement trade" rally. A critical trigger for the sell-off was the CME Group’s decision to **raise margins on copper futures by 20%**, effective January 30. This forced speculative traders to liquidate positions, accelerating the price decline. **Currency & Demand Signals** A recovering **US dollar** added pressure, making dollar-denominated metals more expensive for foreign buyers. Furthermore, physical demand indicators from China remain weak. The Yangshan copper premium—a key gauge of Chinese import demand—hovered near lows of **$20–$27 per tonne**, suggesting the recent rally was disconnected from actual industrial consumption. **Sector Impact** The volatility spilled over into equity markets, with major metal stocks crashing significantly. Key producers like **Hindustan Copper** and **Vedanta** saw share price declines ranging from **5% to 10%** on Friday, reflecting the broader risk-off sentiment in the commodities sector. **Outlook** While the long-term narrative around AI data centers and electrification supports the "supercycle" thesis, short-term market dynamics are currently dominated by technical positioning and volatility. Analysts caution that prices may remain unstable as the market digests the rapid run-up against a backdrop of muted physical demand.

Devina Mehra Forecasts Improved Outlook for Indian Stocks in 2026
Market Brief: January 2026 Update **Global Markets: Caution Prevails** Global indices are seeing profit-taking as 2026 begins, with growth projected at **3.3%**. While inflation is easing, trade policy shifts and US-China tensions are driving volatility. Investors are pivoting to safer assets, weighing the impact of "higher-for-longer" rates in select regions. **Indian Equities: Sentiment & Opportunity** Indian markets are diverging. While the Nifty 50 remains resilient (P/E ~22x), broader sentiment has turned deeply negative following a sharp correction in January. * **The Opportunity:** This widespread pessimism may set the stage for a strong recovery later in 2026. Historical trends suggest entry points during such "sentiment washouts" often yield superior long-term returns. * **Strategy:** Expect a shift from broad index rallies to stock-specific performance. **Sector Watch** * **Smallcaps:** Under severe pressure. The index is down significantly in January, with over **600 stocks** slipping into double-digit negatives. Stress is likely to persist until valuations normalize further. * **FMCG:** A key defensive play. The sector anticipates **high single-digit volume growth** and improved margins due to benign input costs and a gradual rural recovery. * **Pharma:** Outlook remains robust with **9–11% export growth** projected. Focus is shifting to complex generics and quality compliance. * **Auto:** Selective buying expected, particularly in commercial vehicles and EV segments, supported by policy continuity. **Union Budget 2026: Fiscal Reality** Expectations for the upcoming Union Budget are tempered. * **Fiscal Tightrope:** The government is likely to aim for a fiscal deficit of **~4.3–4.4%**, limiting room for populist spending. * **Stimulus Shift:** Policy emphasis will likely transition from "Buy India" (consumption stimulus) to "Build India" (Capex and manufacturing). * **Impact:** Do not expect a blanket market lift; gains will be tied to specific policy announcements in infrastructure and manufacturing rather than broad consumption boosters. **Summary Outlook** Volatile start to 2026. Large-caps offer stability; Smallcaps require extreme caution. The upcoming Budget will likely reinforce fiscal discipline over aggressive stimulus. [Global Economy: Steady amid Divergent Forces - IMF](https://www.youtube.com/watch?v=tizrLHAEDf8) *This video provides a relevant macroeconomic backdrop, discussing the global and Indian economic factors influencing the current market sentiment.* http://googleusercontent.com/youtube_content/0

Crypto Markets Anticipate Regulatory Framework in Budget 2026
**Market Brief: India Crypto Sector & Budget 2026** **Current Landscape: The Offshore Exodus** As Finance Minister Nirmala Sitharaman prepares to present the Union Budget 2026-27 on February 1, the Indian crypto sector stands at a critical juncture. The strict tax regime introduced in 2022—specifically the flat **30% tax on gains** and **1% Tax Deducted at Source (TDS)**—has triggered a massive flight of capital. Recent industry data highlights a severe impact on domestic exchanges: * **91.5%** of Indian crypto trading volume has shifted to offshore platforms as of late 2025. * Approximately **₹4.87 lakh crore** in trading volume migrated between October 2024 and October 2025. * The Indian treasury faces an estimated revenue loss nearing **₹36,000 crore**, with uncollected TDS alone accounting for over **₹11,000 crore**. Despite these hurdles, India remains the **#1 nation for global crypto adoption** (Chainalysis 2025), with domestic user bases exceeding **2.5 crore** across major platforms like CoinSwitch and CoinDCX. **Budget 2026: The Core Demands** The Bharat Web3 Association (BWA) and major exchange heads have submitted a unified "survival wishlist" to the Finance Ministry. The industry argues that the current framework acts as a "deterrence model" rather than a revenue model. **1. Rationalization of TDS** The primary demand is a reduction of TDS from **1% to 0.01%**. * **Rationale:** The 1% levy sucks liquidity out of the market, making high-frequency trading unviable on compliant Indian exchanges. * **Expected Impact:** A reduction to 0.01% would maintain the government's "tracking and traceability" objective without killing market depth. **2. Provision for Loss Set-Off** Currently, traders cannot offset losses from one asset (e.g., Bitcoin) against profits from another (e.g., Ethereum). * **The Ask:** Allow set-off of losses within the Virtual Digital Asset (VDA) class, aligning crypto taxation with equities and other financial instruments. * **Investor Sentiment:** A January 2026 survey indicates **66% of investors** view the current regime as "unfair," with **59%** admitting they reduced trading activity solely due to tax pressure. **3. Regulatory Clarity** Beyond tax, the sector seeks a formal regulatory bill. The demand is for VDAs to be treated as a regulated asset class under the purview of SEBI or a dedicated body, moving beyond the current PMLA (anti-money laundering) compliance mandates. **Market Outlook** The consensus among stakeholders is that Budget 2026 is a "make or break" event for the onshore industry. If the government maintains the status quo, experts predict the near-total dominance of offshore/shadow platforms, leaving Indian users vulnerable to fraud without legal recourse. Conversely, a tax reduction could instantly repatriate billions of dollars in volume, reviving domestic liquidity and boosting tax revenues through higher compliance.
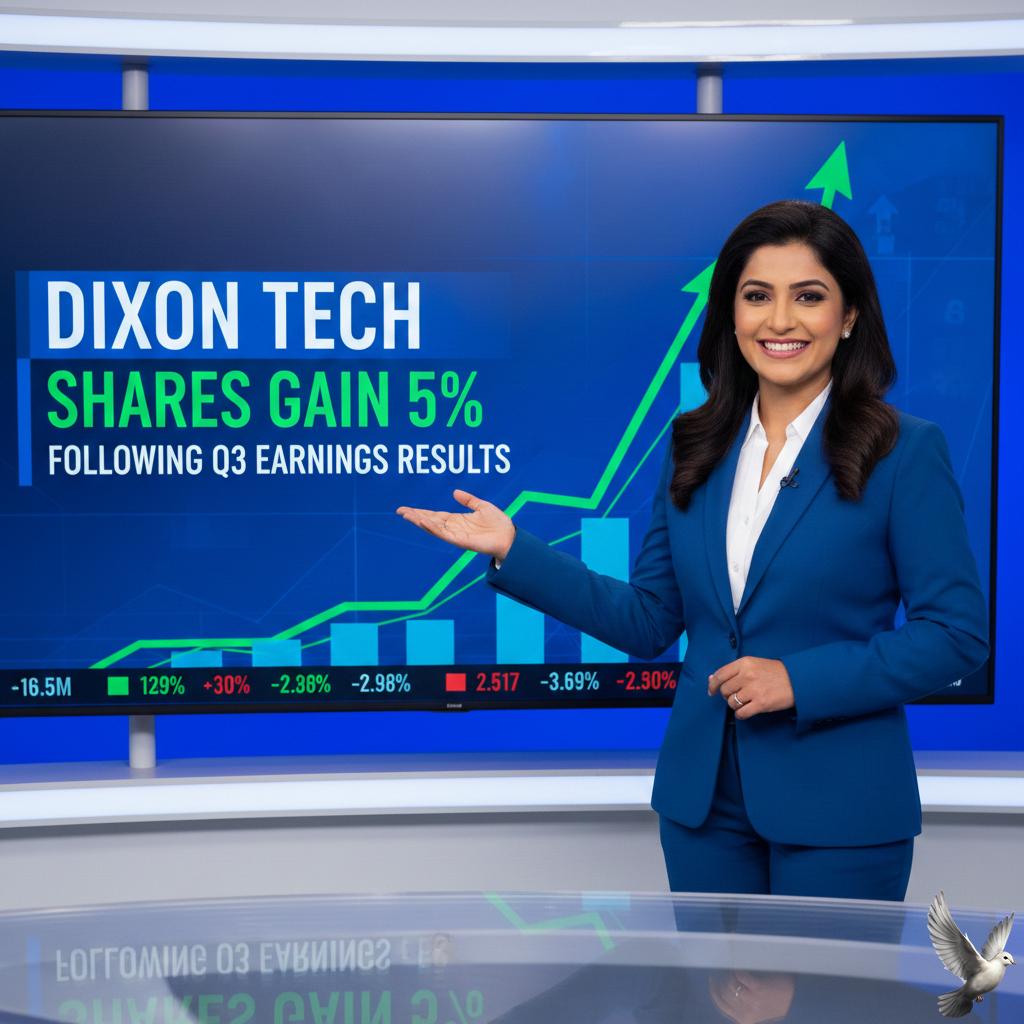
Dixon Tech Shares Gain 5% Following Q3 Earnings Results
**Market Brief: Dixon Technologies Q3 FY26 Update** **Market Reaction & Price Action** Dixon Technologies (India) Ltd shares surged in today’s trading session, climbing over **4%** to hit an intraday high near **₹10,846**. The stock defied broader market weakness, reacting positively to the company’s third-quarter earnings announcement. As of the latest update, the stock was trading around **₹10,330–₹10,450**, significantly outperforming the benchmark indices. **Financial Performance: Q3 FY26 Snapshot** The company reported a headline net profit jump of approximately **48% year-on-year (YoY)** to **₹321 crore** for the quarter ended December 2025. However, this figure includes a significant exceptional gain of **₹125 crore** from the fair value adjustment of its stake sale in Aditya Infotech. * **Adjusted Net Profit:** Excluding the one-off gain, the core net profit remained largely flat at **₹214 crore**, compared to **₹217 crore** in the same period last year. * **Revenue:** Consolidated revenue grew marginally by **2% YoY** to **₹10,678 crore**. * **Operating Profit (EBITDA):** Adjusted operating profit rose **6% YoY** to **₹415 crore**, with margins holding steady at **3.9%**. **Segment Performance** The Mobile and EMS (Electronics Manufacturing Services) division—which contributes nearly **92%** of total revenue—posted a modest **5% YoY** revenue growth to **₹9,750 crore**. However, on a sequential basis, the mobile segment faced pressure, with analysts noting a sharp decline in volumes. High channel inventory and elevated memory chip costs continue to weigh on demand, impacting production targets for key clients like Motorola. **Brokerage Verdict: Deeply Divided** The street remains polarized on Dixon’s valuation and near-term growth prospects following the Q3 print. * **The Bull Case (Motilal Oswal):** Domestic brokerage Motilal Oswal retained its **BUY** rating but cut its target price to **₹16,700** (from higher levels). They acknowledge "uncertain times" due to memory price inflation but remain optimistic about Dixon’s backward integration strategy (display modules, enclosures) and long-term manufacturing value. They believe the stock’s correction—down significantly from its 52-week high of **₹18,471**—factors in most risks. * **The Bear Case (Goldman Sachs):** Goldman Sachs maintained a cautious stance (Sell/Neutral bias), raising its target price slightly to **₹10,000** but keeping it below the current market price. The firm flagged that the earnings downgrade cycle might continue, citing flat mobile volumes and regulatory headwinds. They emphasized that while value-addition initiatives are positive, customer stickiness and demand recovery remain uncertain. * **Other Key Views:** **Emkay Global** described the quarter as "soft" due to the **30% sequential fall** in mobile phone business revenues but found comfort in the company's margin resilience. **CLSA** noted that elevated memory prices would likely pressure the lower and mid-tier smartphone segments in the upcoming quarter. **Strategic Outlook** Management has guided for smartphone volumes of **7–7.5 million units** in Q4, lowering the full-year FY26 guidance to **34–35 million units** (down from an earlier 40–45 million). Despite near-term volume headwinds, the company is aggressively pursuing backward integration and new component partnerships to defend margins and diversify beyond pure assembly work.
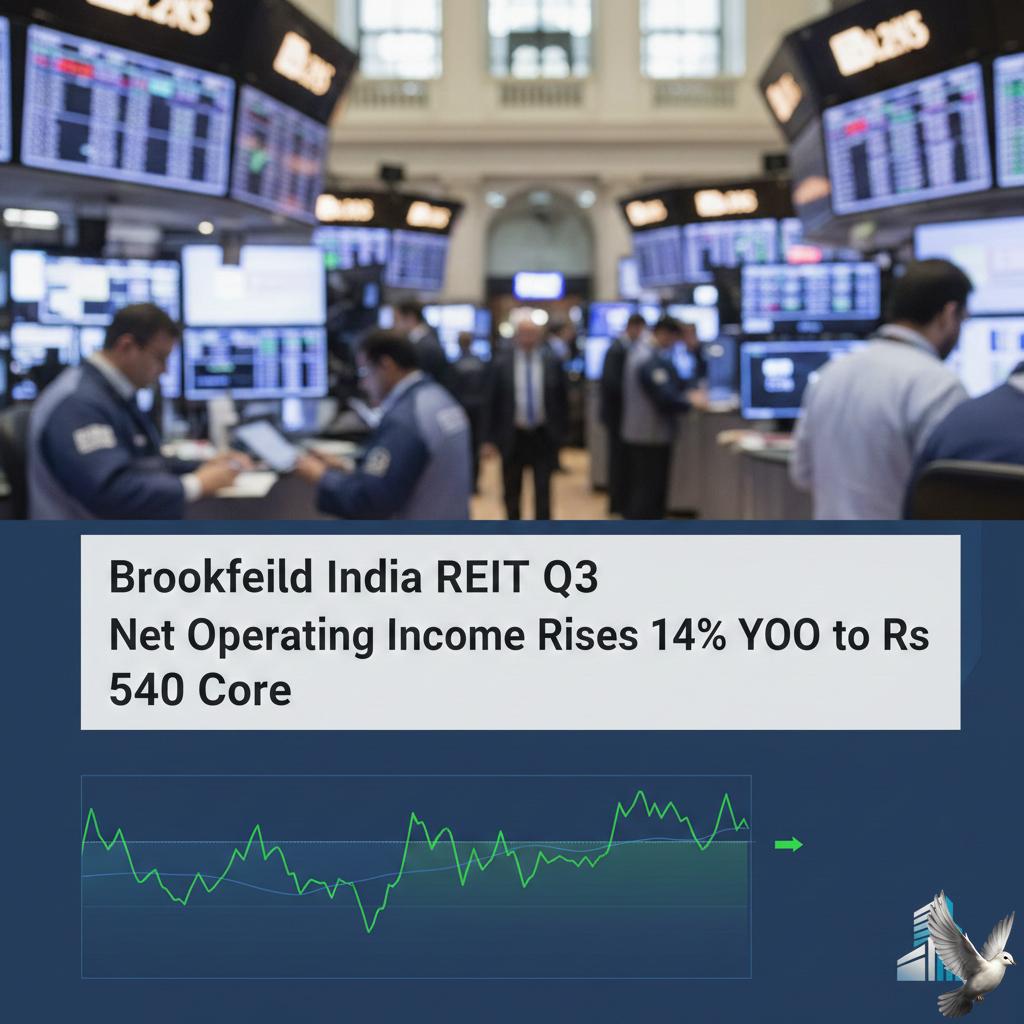
Brookfield India REIT Q3 Net Operating Income Rises 14% YoY to Rs 540 Crore
**Brookfield India REIT Q3 FY26: Profit Surges 8x, Ecoworld Deal Sealed** **Financial Performance** Brookfield India Real Estate Trust delivered a robust Q3 FY26, with Net Operating Income (NOI) rising **14% YoY** to **Rs 540.4 crore**. Consolidated net profit saw a massive **8-fold jump** to **Rs 201.2 crore**, compared to Rs 23.4 crore in the same period last year. Revenue from operations grew **13% YoY** to **Rs 500.3 crore**. **Distributions & Returns** The REIT declared a distribution of **Rs 5.40 per unit** for the quarter, totaling roughly **Rs 405 crore**. This represents a **10% YoY growth** in payouts, reinforcing its commitment to unitholder returns. **Operational Highlights** Leasing momentum remained strong with **1.2 million sq ft** of gross leasing achieved during the quarter. The portfolio recorded a healthy **17% re-leasing spread**, while committed occupancy improved to **92%**. The strategic focus on Global Capability Centres (GCCs) continues to pay off, contributing significantly to demand. **Strategic Growth** The quarter marked the completion of the **Ecoworld acquisition** in Bengaluru, a 7.7 million sq ft Grade-A office campus. This addition scales the portfolio significantly and diversifies its footprint. To fund growth, the REIT successfully raised **Rs 55 billion** through a mix of Qualified Institutional Placement (QIP) and Sustainability-Linked Bonds. **Market Snapshot** As of January 30, 2026, the unit price trades around **Rs 353**, nearing its 52-week high of **Rs 357.39**. Market sentiment remains bullish, with over **90% of analysts** maintaining a 'Buy' rating, driven by the REIT's expanded asset base and consistent operational delivery.
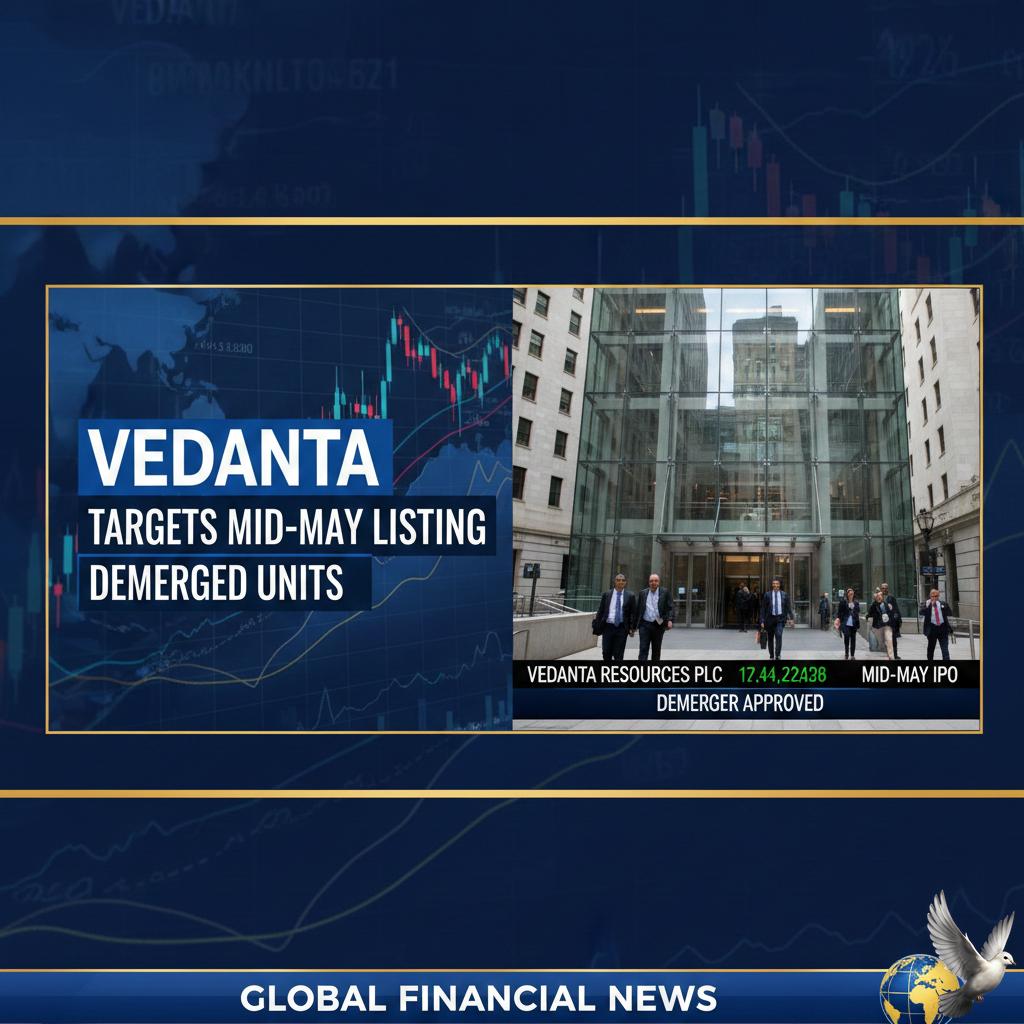
Vedanta Targets Mid-May Listing for Demerged Units
**MARKET BRIEF: VEDANTA DEMERGER UPDATE** **Vedanta Set to List Four Demerged Units by Mid-May 2026** Vedanta Limited has confirmed its timeline to finalize a major corporate restructuring, aiming to list four newly demerged business units on Indian stock exchanges by **mid-May 2026**. This strategic move, now cleared by the National Company Law Tribunal (NCLT), is designed to unlock shareholder value by splitting the conglomerate into pure-play sector leaders. **Timeline and Regulatory Status** Following approval from the NCLT Mumbai bench in **December 2025**, the demerger is scheduled to become effective from **April 1, 2026**. Chief Financial Officer Ajay Goel recently stated that the listing process for the new entities will take approximately **4 to 6 weeks** post-implementation, targeting a mid-May completion. This timeline represents a slight adjustment from earlier estimates but confirms the execution phase is fully underway. **Structure of the New Entities** The restructuring transforms Vedanta from a diverse conglomerate into five independent, listed companies. The split follows a vertical demerger structure: * **Vedanta Aluminium:** Focused on aluminium mining and smelting operations. * **Vedanta Oil & Gas:** Consolidating upstream hydrocarbon assets. * **Vedanta Power:** Housing independent power generation assets. * **Vedanta Steel and Ferrous Materials:** Combining iron ore and steel businesses. * **Vedanta Limited (Parent):** Retains the base metals unit, the **64.9% stake** in Hindustan Zinc, and serves as an incubator for new ventures like semiconductors and display manufacturing. **Shareholder Entitlements** The demerger offers a **1:1 share entitlement ratio**. For every **1 share** of Vedanta Limited held, shareholders will receive **1 additional share** in each of the four newly listed entities. Investors will retain their original share in the parent company, effectively resulting in ownership of five distinct equity instruments for every single share held previously. **Market Performance and Financial Backdrop** As of **January 30, 2026**, Vedanta Limited shares faced significant volatility, trading around **₹702**, down nearly **8%** intraday despite reporting robust quarterly numbers. The stock recently touched a **52-week high of ₹769.80**, driven by investor optimism surrounding the split. In its Q3 FY26 earnings report released in late January, the company demonstrated strong operational health: * **Net Profit:** Jumped **60% YoY** to **₹7,807 crore**. * **EBITDA:** Reached a record **₹15,171 crore**, up **34% YoY**. * **Revenue:** Rose **37% YoY** to **₹23,369 crore**. Despite these strong fundamentals, the immediate stock price correction reflects broader weakness in the global metals sector and profit-booking after a significant rally. **Strategic Rationale and Debt Management** The primary objective of this restructuring is to eliminate the "conglomerate discount" and allow the market to value each business independently based on its specific sector dynamics. Debt management remains a central focus. As of December 2025, Vedanta’s net debt stood at **₹60,624 crore**. The company plans to allocate this debt across the demerged entities in proportion to their respective cash flows and asset bases. This segregation aims to ring-fence risks and allow each entity to pursue independent capital allocation strategies. **Outlook** With the "Effective Date" set for April 1, market participants will now closely monitor the official record date announcement. The restructuring creates five large-cap sized entities, with management projecting that each unit has the potential to scale significantly. While the long-term thesis rests on value unlocking, near-term price action remains sensitive to global commodity cycles, particularly in aluminium and crude oil.
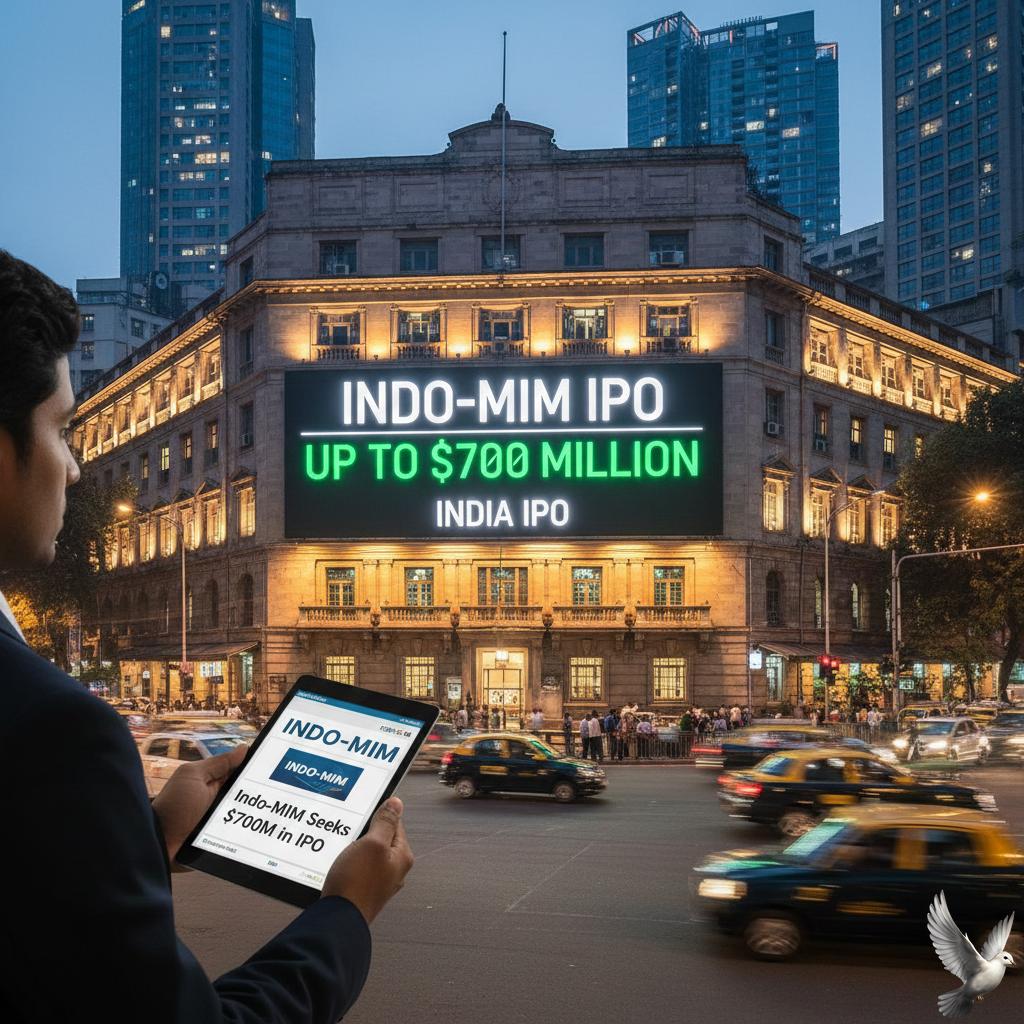
Indo-MIM Said to Seek Up to $700 Million in India IPO
**Market Brief: Indo-MIM IPO Valuation Reset** **Date:** January 30, 2026 **Topic:** Indo-MIM Ltd. IPO & Valuation Adjustment Precision components manufacturer **Indo-MIM Ltd.** is recalibrating its listing strategy amidst a shifting market landscape. The Bengaluru-based firm is pressing ahead with its initial public offering (IPO) plans but has significantly dialed back its valuation expectations to align with the cautious sentiment currently gripping India's primary market. **Key Developments** **Valuation Cut** Indo-MIM has reportedly lowered its target valuation to approximately **$2.5 billion**, a sharp reduction from the earlier projection of **$3.2 billion**. This **~22%** haircut reflects investor sensitivity to pricing as the Indian IPO market faces a sluggish start to 2026. **Deal Size & Structure** The company aims to raise up to **$700 million**. The offering is structured as a mix of: * **Fresh Issue:** Approximately **₹1,000 crore** (primary capital). * **Offer for Sale (OFS):** Around **129.7 million** shares (secondary sale). Existing backers, including the **Indian Institute of Technology (IIT) Madras** and other early investors, are expected to offload nearly **26%** of the total equity capital through the OFS route. **Market Context: A Cautious Start to 2026** After a record-breaking 2025, the Indian IPO arena has cooled in January 2026. Volatility in the secondary market and global geopolitical headwinds have prompted institutional investors to demand more attractive entry price points. Indo-MIM’s decision to cut its valuation suggests a pragmatic approach to ensure subscription success in a risk-averse environment. **Company Snapshot** **Business Profile** Indo-MIM is a global leader in **Metal Injection Molding (MIM)** technology, commanding an estimated **7% global market share** as of FY2025. It supplies precision components to critical sectors including automotive, aerospace, defense, and medical devices. **Financial Performance (FY25)** * **Revenue:** ₹3,330 crore * **Net Income:** ₹428 crore The company manages a "dual-shore" manufacturing network with **15 facilities** spread across India, the US, and the UK. Proceeds from the fresh issue are earmarked primarily for debt repayment (approx. **₹720 crore**) and general corporate purposes. **Timeline** Roadshows and investor meetings are reportedly underway, with the potential for the issue to launch as early as **February 2026**, pending final regulatory clearances and market stability. Lead managers for the issue include Kotak Mahindra Capital, Axis Capital, and HDFC Bank.

Vodafone Idea Shares Rise 13% on Turnaround Plan as Brokerages React
**Market Brief: Vodafone Idea (Vi) – January 30, 2026** **Current Status: Volatile Surge Amid Strategic Pivot** Vodafone Idea (Vi) stock has witnessed a sharp rally, trading at approximately **Rs 11.23** as of today, marking a **13%** surge in recent sessions. The buying interest follows the management’s unveiling of an aggressive **Rs 45,000 crore** capital expenditure (capex) plan over the next three years to bridge the 4G/5G coverage gap with rivals Reliance Jio and Bharti Airtel. **The Turnaround Blueprint** In its Q3 FY26 earnings call, Vi leadership outlined a roadmap to deploy this capital for network expansion in **17 priority circles** (contributing **99%** of revenue). This investment is *in addition* to the **Rs 18,000 crore** already infused over the last six quarters. * **Key Focus:** Expanding 4G coverage and rolling out 5G in key urban centers. * **Funding Mix:** The company is finalizing **Rs 25,000 crore** in bank funding and a **Rs 10,000 crore** non-fund-based facility to support this rollout. * **Promoter Backing:** Confidence was further boosted by a recent **Rs 5,836 crore** infusion proposal from the promoter group. **Financial Health Check: Q3 FY26** The latest quarterly results present a mixed picture of recovery and lingering stress: * **Net Loss:** Narrowed to **Rs 5,286 crore** (down from **Rs 5,524 crore** in Q2), aided by a one-time exceptional gain. However, adjusted losses widened. * **ARPU Growth:** Average Revenue Per User improved by **3%** QoQ to **Rs 172**, reflecting the impact of tariff hikes and 4G upgrades. * **Subscriber Churn:** A critical concern remains—Vi lost **3.8 million** subscribers in Q3, reversing the previous trend of stabilizing numbers. The total subscriber base now stands at roughly **193 million**. **The Debt & Regulatory Landscape** The company’s survival hinges on managing its massive debt pile, which currently stands at **Rs 2.09 lakh crore**. * **AGR Relief:** A major overhang was lifted in **October 2025**, when the Supreme Court allowed the government to reconsider Adjusted Gross Revenue (AGR) dues. * **Moratorium:** The Cabinet has frozen AGR dues as of December 31, 2025, granting a **5-year moratorium** on payments. This defers significant cash outflows, providing a lifeline until **FY31-32**. **Brokerage Verdict: Caution Prevails** Despite the stock's recent momentum, analysts remain divided on the long-term execution story. While some acknowledge the improved cash runway, concerns persist regarding the steep subscriber loss and the massive funding required to compete effectively. * **Consensus View:** The street is cautious, with price targets revised to a lower band compared to earlier optimism. * **Target Range:** Current brokerage targets largely hover between **Rs 6** and **Rs 11**, with a consensus estimate suggesting potential downside from current levels. * **Key Risks:** Execution of the **Rs 45,000 crore** capex, arresting subscriber churn, and the final outcome of the AGR debt recalculation by the DoT.
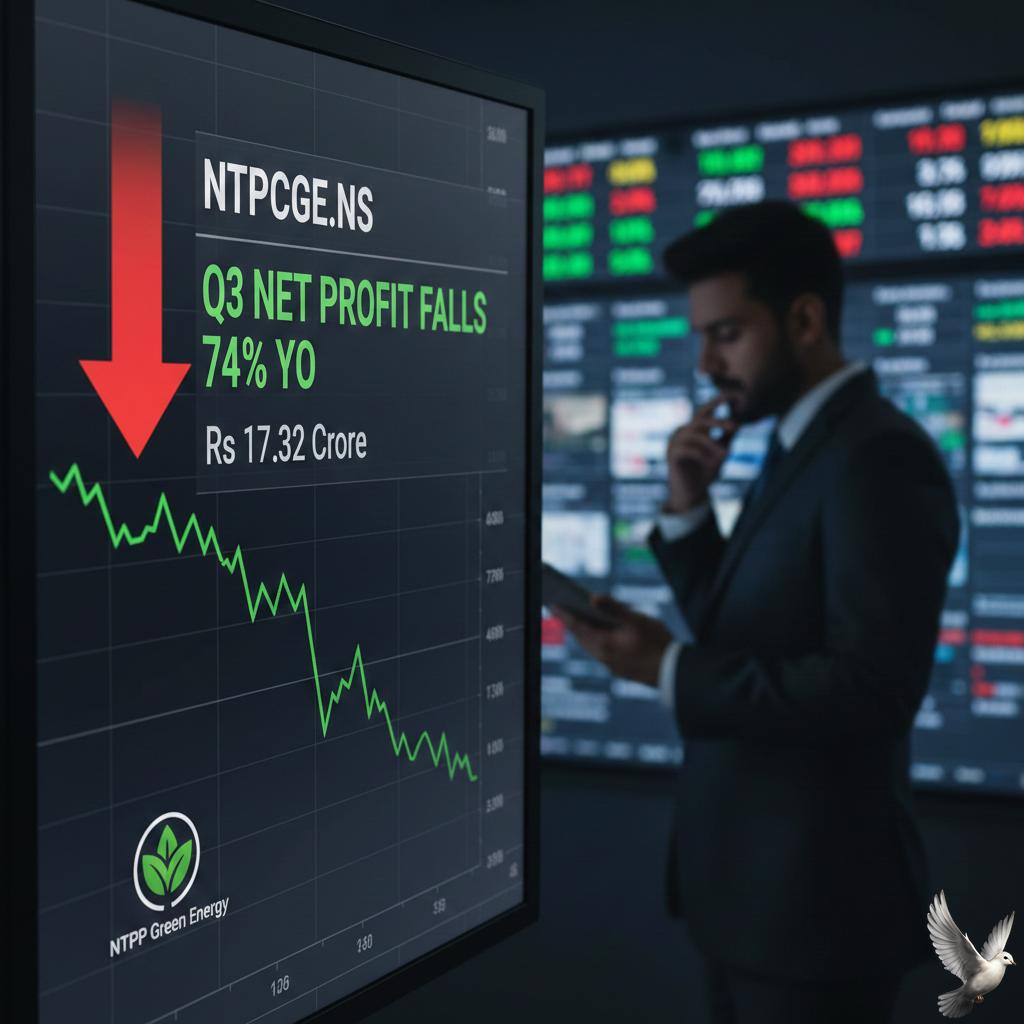
NTPC Green Energy Q3 Net Profit Falls 74% YoY to Rs 17.32 Crore
**Market Brief: NTPC Green Energy Ltd (NGEL)** **Financial Performance: Profit Contraction Amid Revenue Growth** NTPC Green Energy Ltd (NGEL), the renewable energy arm of state-run power giant NTPC, reported a mixed financial performance for the quarter ended **December 31, 2024**. While top-line growth remained robust, bottom-line figures faced severe pressure due to escalating operational costs. * **Net Profit:** Consolidated net profit plunged by **74%** year-on-year to **₹17.32 crore**, down from **₹65.61 crore** in the same period last year. * **Total Income:** Despite the profit squeeze, the company demonstrated strong revenue traction. Total income climbed to **₹684.22 crore**, marking a significant increase from **₹581.46 crore** in the corresponding quarter of the previous fiscal. * **Revenue from Operations:** Core operational revenue saw a healthy jump of approximately **26%**, reaching **₹635.3 crore**. * **EBITDA Growth:** Earnings Before Interest, Taxes, Depreciation, and Amortization (EBITDA) rose by **34%** to **₹567 crore**, indicating that core operational efficiency remains intact despite the net earnings hit. **Key Drivers of Underperformance** The steep decline in net profit was primarily driven by a sharp surge in total expenses, which rose to **₹615.60 crore** from **₹481.22 crore** a year ago. Analysts attribute this disparity to higher depreciation costs associated with new capacity commissioning and finance costs. Additionally, previous financial periods were buoyed by significant interest income from IPO proceeds, a non-operational revenue stream that has since normalized, creating an unfavorable base effect for year-on-year comparisons. **Stock Market Reaction** The market reacted negatively to the earnings miss. Following the announcement, NGEL shares faced selling pressure, dropping approximately **5%** intraday to trade around the **₹87–₹88** levels. * **Current Valuation:** The company’s market capitalization currently stands in the range of **₹73,000 crore** to **₹74,000 crore**. * **Listing Context:** NGEL recently debuted on the stock exchanges in **November 2024** after a successful **₹10,000 crore** IPO. The stock has since seen volatility as investors digest its first few quarterly reports as a publicly listed entity. **Operational Milestones & Expansion** Despite the immediate financial headwinds, NGEL continues to aggressively expand its asset base. In a major operational update released alongside earnings, the company declared the commercial operation of an additional **130.47 MW** solar capacity. * **Project Location:** This new capacity is part of the massive **Khavda Renewable Energy Park** in Gujarat, a strategic site for India’s clean energy goals. * **Portfolio Growth:** With this addition, the total installed capacity of the NTPC Green Energy Group has crossed the **8,400 MW** mark. * **Execution Pace:** The company is accelerating project execution to meet its ambitious long-term targets. It has a robust pipeline of projects under various stages of construction and tendering. **Strategic Outlook** NTPC Green Energy remains central to its parent company's transition away from fossil fuels. The management has reiterated its long-term vision to achieve **60 GW** of renewable energy capacity by **FY32**. Investors are likely to focus closely on the company's ability to stabilize margins in upcoming quarters while sustaining its aggressive capital expenditure for capacity addition. The focus will remain on how quickly new assets can start contributing to the revenue stream to offset rising finance and depreciation costs. *** **Data as of January 30, 2026.**