Bullish News
Collection
SEBI Allows Direct Credit of Securities to Demat Accounts, Scraps Letter of Confirmation Requirement
**MARKET BRIEF: SEBI REFORMS & PRE-BUDGET ACTION** **Major Regulatory Shift: Direct Credit of Securities** The Securities and Exchange Board of India (SEBI) has announced a significant overhaul of investor service processes, marking a decisive move towards operational efficiency. In a circular dated **January 30, 2026**, the regulator eliminated the requirement for issuing a 'Letter of Confirmation' (LOC) for the credit of securities. Under the existing framework, when investors submit service requests—such as issuing duplicate certificates, transmission of shares, or claiming unclaimed suspense accounts—companies or Registrars to an Issue and Share Transfer Agents (RTAs) issue an LOC. The investor must then present this letter to their demat participant to get the shares credited. This multi-step process is often cumbersome, taking approximately **150 days** to complete. **New System & Timeline** Effective **April 2, 2026**, this intermediate step will be abolished. * **Direct Credit:** Listed companies and RTAs will now credit securities *directly* to the investor’s demat account after completing necessary due diligence. * **Drastic Time Reduction:** The timeline for crediting securities is expected to drop sharply from **150 days** to just **30 days**. * **Risk Mitigation:** The move eliminates the risks of loss, misuse, or pilferage associated with physical Letters of Confirmation. SEBI clarified that any LOC issued prior to the April 2 deadline will remain valid for dematerialization within the previously prescribed timelines. This initiative is part of a broader push to enhance the "Ease of Doing Investment" in the Indian securities market. **Additional Compliance Window Opened** In parallel, SEBI has introduced a special one-year window to resolve legacy issues with physical shares. * **Duration:** **February 5, 2026** to **February 4, 2027**. * **Purpose:** To allow investors to transfer and dematerialize physical securities bought before **April 1, 2019**, which were previously rejected due to documentation errors. * **Mandate:** All transfers processed via this window will be credited strictly in demat form and subject to a **1-year lock-in**. **Market Snapshot: Pre-Budget Volatility** Domestic equity markets remained under pressure during the last trading session of January 2026, characterized by muted sentiment ahead of the Union Budget presentation. **Key Indices Performance (January 30 Close):** * **BSE Sensex:** Closed at **82,339.32**, down by **0.27%**. * **Nifty 50:** Ended at **25,320.65**, slipping **0.39%**. * **Nifty Bank:** Witnessed a decline of **0.64%**, closing at **59,576**. The broader market also saw profit booking, with the Nifty Midcap 100 falling over **0.5%**. Sectoral trends indicated weakness in banking and metals, while defensive buying was observed in select pockets. **The Week Ahead** Investors are bracing for high volatility with the Union Budget scheduled for **February 1, 2026**. Stock exchanges have announced a special trading session on Sunday to accommodate the event. Market participants will be closely monitoring fiscal deficit targets and capital expenditure announcements, which are expected to dictate the near-term trend for the indices.

Glenmark Q3 Profit Rises 16% on India, US Growth
**Market Brief: Glenmark Pharmaceuticals Q3 FY26 Performance** **Overview** Glenmark Pharmaceuticals has delivered a robust financial performance for the third quarter ended December 31, 2025 (Q3 FY26). The company reported double-digit growth across key metrics, driven by domestic strength and a revitalized North American business. Operational efficiency significantly boosted profitability, while a critical regulatory clearance in the US signals resolved supply chain bottlenecks. **Financial Highlights** The company posted a **16% year-on-year (YoY)** rise in consolidated net profit, reaching **₹403 crore**. Consolidated revenue grew **15% YoY** to approximately **₹3,900 crore**, reflecting broad-based gains across geographies. Operational performance improved sharply, with **EBITDA surging 45%** to **₹869 crore**. Consequently, EBITDA margins expanded to **22.3%**, a substantial improvement from the previous year, underscoring successful cost control measures and a superior product mix. **Segment Performance** * **India Business:** Domestic formulations remained the primary growth engine, recording a **22% YoY increase** in revenue to **₹1,298 crore**. The segment continues to outperform the wider market, driven by volume growth in chronic therapies and new launches. * **North America:** Revenue from this key geography jumped **24.2% YoY** to **₹970 crore**. While this figure was aided by one-time out-licensing income from the **ISB 2001** asset, the core business grew steadily at **4.1%**, indicating stabilizing demand and improved pricing power. * **Europe & Emerging Markets:** European operations grew **9.1%** to **₹796 crore**, supported by seasonal respiratory demand. The Emerging Markets segment (including Russia and LatAm) rose **8.4%** to **₹811 crore**. **Regulatory Breakthrough** A significant positive development during the quarter was the regulatory clearance for the manufacturing facility in **Monroe, North Carolina**. The US FDA classified the facility as **Voluntary Action Indicated (VAI)**, effectively clearing the path to restart commercial manufacturing. This resolution is expected to unblock supply constraints and accelerate product approvals for the US market in upcoming quarters. **Market Reaction** Investor sentiment remained buoyant following the results. The stock gained approximately **2%** in recent trading, hovering around the **₹2,026** level on the NSE. With a market capitalization now standing at **₹56,889 crore**, the street has positively priced in the margin expansion and the resolution of regulatory overhangs. **Outlook** Management has reiterated its focus on the innovative portfolio, including key assets like **Ryaltris** (respiratory) and **Winlevi** (dermatology). With the Monroe facility back online and the India business delivering consistent volume-led growth, the company remains on track to meet its near-term guidance for FY26.
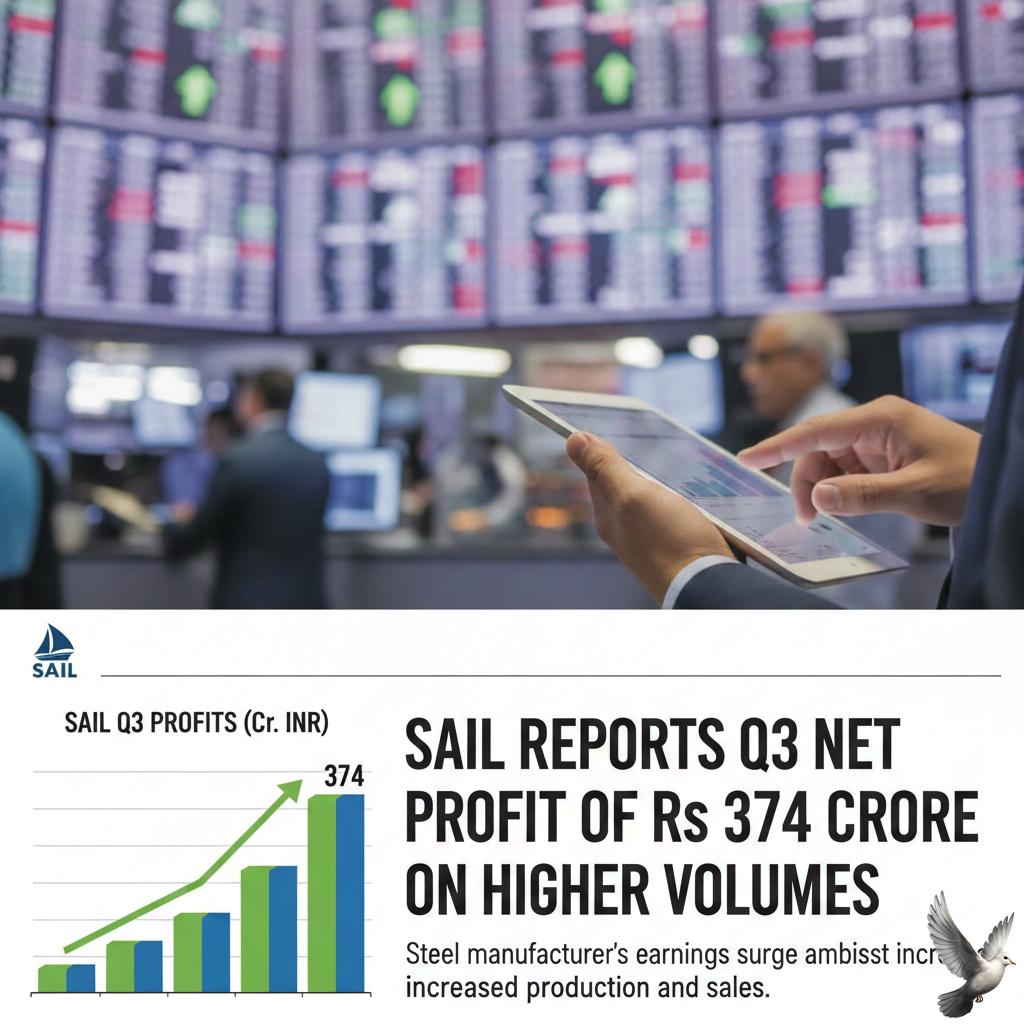
SAIL Reports Q3 Net Profit of Rs 374 Crore on Higher Volumes
**Market Brief: Steel Authority of India Ltd (SAIL) – Q3 FY26 Update** **Date:** January 31, 2026 **Subject:** Quarterly Earnings Analysis & Market Impact **Executive Summary** State-owned steel major SAIL has delivered a robust financial performance for the quarter ended December 31, 2025 (Q3 FY26). The company defied sector-wide headwinds—specifically volatile input costs and pricing pressures—to report a significant surge in profitability. This growth underscores the efficacy of its volume-led strategy and rigorous cost-control measures. **Financial Highlights: Q3 FY26** **Net Profit Surge** SAIL reported a consolidated net profit of **₹374.03 crore** for the December quarter. This represents a massive **>2x jump** (over 160% increase) compared to the ₹141.89 crore profit reported in the corresponding quarter of the previous fiscal (Q3 FY25). **Revenue Growth** Total income for the quarter climbed to **₹27,545.93 crore**, marking an **~11% increase** year-on-year from ₹24,723.43 crore in Q3 FY25. This top-line expansion was primarily driven by higher sales volumes and improved market penetration, despite a competitive pricing environment. **Nine-Month (9M) Performance** For the cumulative April–December period (9M FY26), Profit After Tax (PAT) stood at **₹1,554 crore**, a sharp rise of **60%** against ₹970 crore in the same period last year. **Operational Drivers & Strategy** **Volume-Led Growth** The company’s strategy to offset margin pressure through scale is yielding results. * **Production:** Crude steel production for the nine-month period reached **14.35 Million Tonnes (MT)**. * **Sales:** Sales volumes were robust at **16.61 MT** for 9M FY26. **Efficiency Measures** Management attributed the profitability spike to "operating leverage" and "disciplined cost control." By optimizing the product mix and maintaining strict oversight on overheads, SAIL protected its margins despite the dual challenges of high coking coal prices and depressed global steel realizations. **Management Commentary** CMD Amarendu Prakash highlighted that the strong sales traction is supported by **robust domestic demand**, which continues to decouple from the sluggish global steel cycle. The focus remains on maximizing capacity utilization to lower the cost per tonne. **Market Reaction & Stock Performance** **Immediate Sentiment** Despite the positive earnings beat, the stock witnessed profit-booking in the immediate aftermath, tracking broader weakness in the metal index. * **Current Price:** Trading near **₹151.15** level. * **Intraday Movement:** Down approximately **3.9%** post-announcement. * **Valuation Context:** The company currently commands a market capitalization of approximately **₹62,400 crore**. **Technical Trend** * **52-Week High/Low:** ₹160 / ₹99.15. * **Returns:** The stock has delivered a strong **1-year return of ~43%**, significantly outperforming the broader market indices over the last 12 months. **Sector Outlook & Challenges** **Input Cost Volatility** The steel sector remains sensitive to fluctuations in raw material prices, particularly coking coal. While SAIL has managed this effectively in Q3, global supply chain tightness remains a key monitorable for Q4 margins. **Pricing Power** Domestic steel prices have shown resilience compared to international benchmarks. However, the influx of cheaper imports (particularly from China) continues to cap significant price hikes. SAIL’s ability to sustain volume growth will be critical to defending market share in this environment. **Strategic Focus** Going forward, the market will closely watch SAIL’s debt reduction trajectory and the execution of its modernization plans, which are essential for sustaining this profitability momentum into FY27.
US Shutdown Risk Increases as Senate Funding Deal Stalls
**Partial U.S. Shutdown Active: Senate Passes Deal, House Vote Delayed** A partial U.S. government shutdown officially began at **12:00 AM Saturday** after Congress failed to finalize a funding package before the midnight deadline. While the Senate successfully passed a bipartisan deal late Friday in a **71-29** vote, the House of Representatives had already departed Washington and is not scheduled to return until Monday. **The Sticking Point: DHS Funding** The deadline lapse was driven by intense friction over Department of Homeland Security (DHS) funding. Negotiations stalled following the controversial deaths of two U.S. citizens in Minneapolis involving federal agents, leading Democrats to demand stricter oversight of immigration enforcement. **The Compromise Package** The Senate-approved measure, now awaiting House action, offers a two-tier solution: * **Full-Year Funding:** Clears appropriations for major agencies (Pentagon, State Dept, etc.) through **September 30**. * **Short-Term Patch:** Extends DHS funding for just **two weeks**, allowing time for further policy negotiations without keeping the broader government closed. **Market Reaction & Data (Friday Close)** Investors showed caution ahead of the deadline, though reaction was tempered by expectations of a swift resolution next week. Tech weakness also weighed on indices. * **S&P 500:** Closed at **6,939** (**-0.43%**). * **10-Year Treasury Yield:** Hovered near **4.24%**. * **Gold:** Suffered a sharp decline as the dollar strengthened. **What to Watch** The operational impact is expected to be limited, as the lapse coincides with the weekend when most federal employees are off-duty. House Speaker Mike Johnson has indicated plans to bring the Senate package to a floor vote immediately upon reconvening Monday evening. If passed, funding would be restored retroactively, minimizing disruption to agency operations.
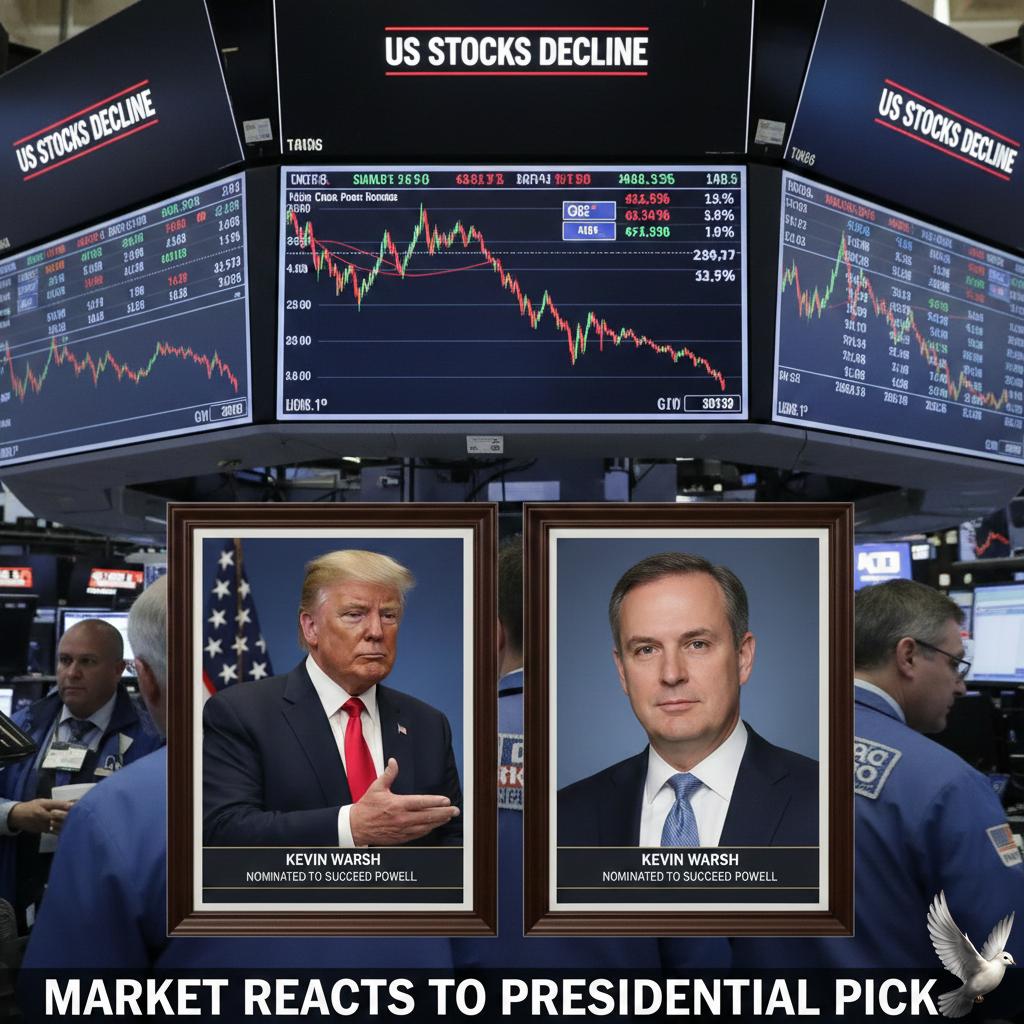
US Stocks Decline as Trump Nominates Warsh to Succeed Powell
**Market Brief: Warsh Nomination Rattles Investors** **Friday Close & Weekly Wrap** US markets retreated on Friday, January 30, 2026, ending a volatile week on a down note. The **Dow Jones Industrial Average** shed **179 points** (**-0.4%**) to close at **48,892**, while the **S\&P 500** slipped **0.4%** to **6,939**. The tech-heavy **Nasdaq Composite** saw the steepest decline, dropping **0.9%** to finish at **23,461**. **Fed Chair Nomination** Volatility spiked after President Donald Trump officially nominated former Federal Reserve Governor **Kevin Warsh** to replace Jerome Powell as Fed Chair. Warsh, historically known as a monetary policy "hawk," has sparked debate on Wall Street. Traders are aggressively repricing risk as they weigh his past support for higher rates against his recent alignment with the administration's pro-growth, lower-rate agenda. **Commodities & Currency Reaction** The "Warsh trade" triggered violent moves in alternative assets. **Gold** prices crashed over **9%** to trade near **$4,880** per ounce, snapping a record-breaking rally. **Silver** plummeted nearly **28%**, reflecting fears of a stronger dollar and tighter future monetary policy. Conversely, the **US Dollar Index** rallied **0.8%** to **97.07**, rebounding from four-year lows. **Rates & Economic Outlook** Treasury yields inched higher, with the **10-year note** rising to **4.25%**. The move comes as the Federal Reserve held interest rates steady at **3.50%–3.75%** earlier in the week. Recent data showed Producer Price Inflation (PPI) ticking up to **0.5%** in December, further complicating the path for rate cuts in early 2026. **Crypto Markets** Digital assets remained relatively resilient compared to precious metals. **Bitcoin** held steady near **$84,000**, recovering from a brief dip to **$82,000**, as crypto investors assessed the potential regulatory implications of the new Fed leadership. [Trump nominates Kevin Warsh as next Fed chair](https://www.google.com/search?q=https://www.youtube.com/watch%3Fv%3DkYJz6wX2z50) This video provides immediate context and expert analysis regarding the market's reaction to Kevin Warsh's nomination as the next Federal Reserve Chair.
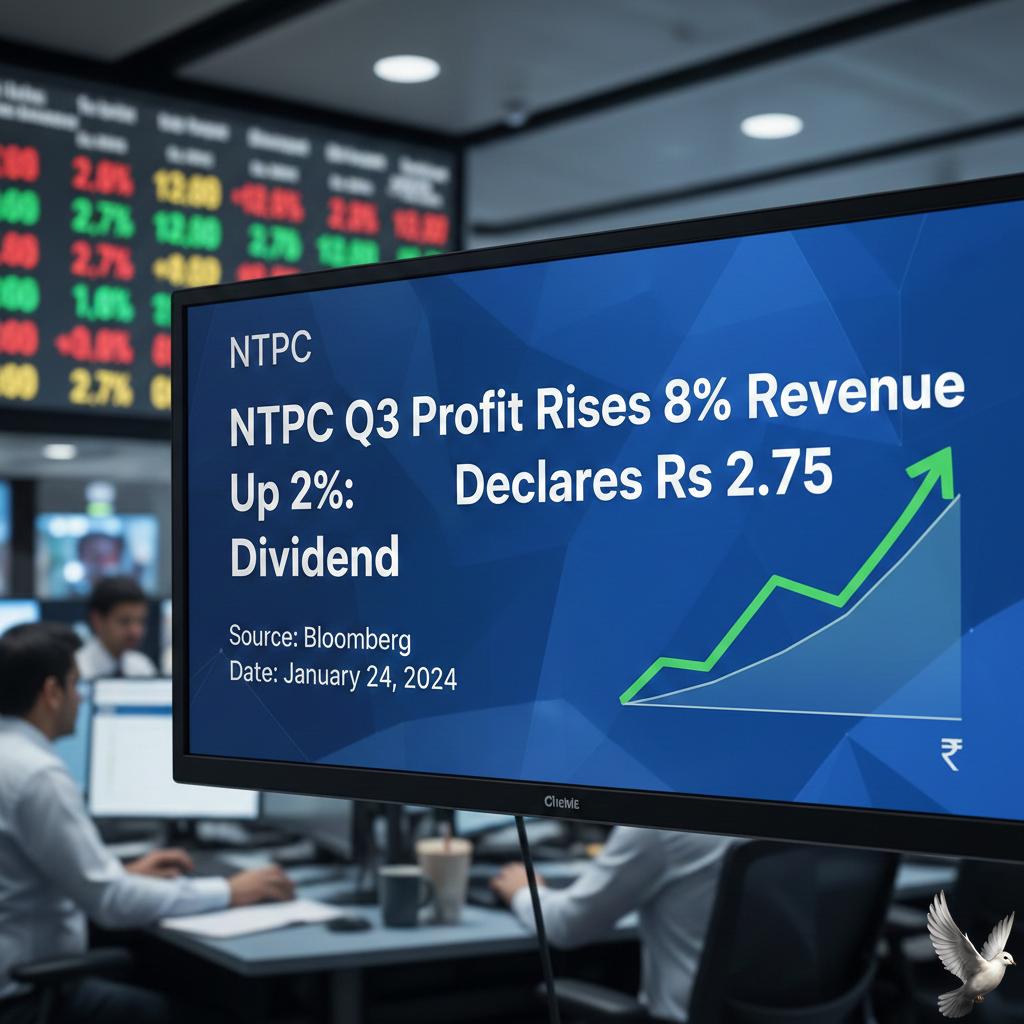
NTPC Q3 Profit Rises 8%, Revenue Up 2%; Declares Rs 2.75 Dividend
**Market Brief: NTPC Q3 FY26 Results** **NTPC Limited** reported a steady performance for the quarter ended December 31, 2025, driven by improved operational efficiency and regulatory gains. The state-run power giant posted an **8.3% year-on-year growth** in consolidated net profit, reaching **₹5,597 crore**, up from ₹5,170 crore in the same period last year. **Financial Highlights** The company witnessed modest top-line growth, with consolidated revenue from operations rising **1.7%** to **₹45,846 crore**. While standalone revenue saw a slight decline of **1.7%**, consolidated earnings were supported by a **sequential drop** in expenses, which fell by **1.7%** quarter-on-quarter to **₹39,533 crore**. Operating performance remained stable, with the EBITDA margin expanding to **31.78%**. However, the results were partially aided by a **₹467 crore** positive adjustment in regulatory deferral accounts, masking some pressure on core standalone earnings. **Dividend Declaration** The Board of Directors declared a second interim dividend of **₹2.75 per share** (27.5% of face value) for FY26. Shareholders can expect the payout on **February 25, 2026**. This follows the first interim dividend paid earlier in the fiscal year, maintaining NTPC’s consistent track record of shareholder returns. **Market Reaction & Subsidiary Update** NTPC shares closed the week at **₹354.10** on the NSE, slipping **1%** post-announcement as investors digested the mixed standalone figures and the lack of forward guidance. Separately, its renewable arm, **NTPC Green Energy**, reported a sharp **74% decline** in net profit to **₹17.32 crore** for the quarter, primarily due to higher finance costs and the absence of prior one-off income, despite a **26% jump** in revenue.
Godfrey Phillips Q3 Net Profit Rises 8.7% to Rs 343.3 Crore
**Market Brief: Godfrey Phillips India – Q3 FY26 Performance Update** **Date:** January 31, 2026 **Subject:** Q3 FY26 Earnings & Strategic Developments **Headline:** Godfrey Phillips India (GPI) posts **8.7% profit growth** in Q3 FY26; Revenue surges **16%** amid cost headwinds. **Financial Highlights (Q3 FY26)** * **Net Profit:** Consolidated profit climbed to **Rs 343.3 crore**, an **8.7% increase** year-on-year (YoY) from Rs 315.8 crore in Q3 FY25. * **Revenue:** Operations revenue saw a robust jump of **15.7% YoY** to **Rs 2,190 crore**, driven by higher volumes in the core cigarette portfolio. * **EBITDA:** Earnings before interest, tax, depreciation, and amortization rose **5.2%** to **Rs 380 crore**. * **Margin Pressure:** Operational margins contracted to **20.8%** (down from 22.7% last year) due to sharp increases in raw material costs and employee expenses. **Market Reaction & Stock Data** * **Closing Price:** Shares settled at **Rs 2,035.50** on Friday (Jan 30), up **0.43%**. * **Trading Volume:** Moderate activity with approx. **3.6 lakh shares** traded. * **Valuation:** The stock currently trades at a P/E of **25.15x**, reflecting sustained investor confidence despite broader FMCG volatility. * **Technical Trend:** The stock remains in a consolidation zone, holding support near the **Rs 2,000** mark. **Strategic Developments** * **Insurance Claim Filed:** The company filed a **Rs 284 crore** insurance claim related to the fire incident at a third-party processing plant in October 2025. Management expects full recovery of losses. * **Retail Exit Complete:** The divestment from the loss-making retail division **'24Seven'** is now finalized, allowing capital reallocation to the profitable tobacco core. * **Leadership Update:** The Board appointed **Marco Mariotti** as an Additional Director (Non-Executive) effective Feb 1, 2026, reinforcing the strategic alignment with partner **Philip Morris Global Brands**. **Sector & Outlook** * **Core Strength:** The cigarette segment (brands like *Four Square*, *Red & White*, and *Marlboro*) continues to drive over **90%** of total revenue. * **Cost Headwinds:** While top-line growth is healthy, input inflation remains a monitorable risk for near-term profitability. * **Regulatory Watch:** The company recently disclosed a minor GST penalty order (approx. Rs 24.7 lakh), which management confirmed has no material impact on financials. **Summary:** Godfrey Phillips delivered a mixed set of numbers—**strong double-digit revenue growth** proves demand resilience, though rising costs capped bottom-line expansion. The exit from non-core retail and stability in the tobacco partnership offer long-term clarity for shareholders.
Meesho Q3: Revenue Grows 32%, Consolidated Loss Widens to Rs 491 Crore
**Market Brief: Meesho Q3 FY26 Performance** **Financial Snapshot** Meesho has reported a sharp widening in net losses for Q3 FY26, reaching **₹491 crore** compared to **₹37 crore** in the same period last year. This **13-fold** increase in deficit comes despite a strong **31%** year-on-year surge in revenue from operations, which stood at **₹3,518 crore**. **Expense Surge & Strategic Spending** The widening loss is primarily attributed to a **44%** spike in total expenses, which hit **₹4,071 crore**. Management cited aggressive investments in three key areas: * **User Acquisition:** Marketing spends nearly doubled as the company prioritized expanding its customer base. * **Logistics (Valmo):** Heavy capital was deployed to scale its in-house logistics network, Valmo, leading to temporary inefficiencies. * **Festive Season Push:** Higher advertising costs were incurred to capture volume during the critical festive sales window. **Operational Highlights** Despite the bottom-line pressure, operational metrics showed robust growth. Annual Transacting Users (ATUs) grew **34%** to **251 million**, while Net Merchandise Value (NMV) rose **26%** to **₹10,995 crore**. Order volumes also saw a healthy uptick of **36%**. **Liquidity & Market Context** Following its public listing on **December 10, 2025**, Meesho maintains a solid liquidity position with a cash balance of **₹7,277 crore**, bolstered by **₹4,088 crore** raised via its IPO. Management reiterated its strategy to prioritize long-term "flywheel health" over near-term profitability, aiming to normalize logistics costs in the coming quarters.

SEBI Approves 7 IPOs as 2026 Listing Pipeline Expands
**SEBI Clears 7 IPOs: 2026 Pipeline Gains Momentum** The Securities and Exchange Board of India (SEBI) has issued final observations for seven companies, effectively clearing them for initial public offerings (IPOs). This regulatory green light reinforces expectations for a record-breaking year in India's primary market, with analysts projecting fundraising could reach between **₹3.5 lakh crore** and **₹4 lakh crore** in 2026. Here is a breakdown of the approved issuers and their proposed structures. **Real Estate & Infrastructure** **Eldeco Infrastructure and Properties** Leading the pack by size, the Haryana-based developer has secured approval for a **₹1,000 crore** IPO. The structure includes a fresh issue of **₹800 crore** and an Offer for Sale (OFS) of **₹200 crore**. Capital from the fresh issue is largely earmarked for debt repayment (approx. **₹600 crore**) and general corporate needs. **Energy & Manufacturing** **Rotomag Enertec** Operating in the renewable energy and industrial drive space, Gujarat-based Rotomag Enertec plans a significant listing. The issue comprises a fresh equity injection of **₹500 crore** alongside an OFS of up to **2.40 crore** shares by existing shareholders. Funds will primarily address debt reduction and working capital requirements. **HD Fire Protect** This Mumbai-based fire safety manufacturer has opted for a pure Offer for Sale route. Promoters will offload approximately **2.63 crore** shares, with no fresh capital entering the company. HD Fire Protect is a key player in a domestic market valued at **₹10,200 crore**, supplying projects like the new Parliament building and ISRO launch pads. **Technology & Services** **CSM Technologies** The Bhubaneswar-based GovTech and IT solutions provider has received approval for a fresh issue of **1.29 crore** equity shares. Uniquely, this issue carries no OFS component, ensuring all proceeds go directly into the company for growth initiatives and technological infrastructure upgrades. **Xtranet Technologies** Focused on IT services and enterprise applications, Xtranet aims to raise approximately **₹190 crore** through a purely fresh issue. The capital is designated for debt repayment and working capital, positioning the firm to expand its digital services footprint. **AITMC Ventures** Formerly AVPL International, this drone technology and skill development firm is targeting a **₹200 crore** fresh issue. The funds are intended to support business expansion in the drone sector and general corporate purposes. **Agrochemicals** **Parijat Industries** The New Delhi-based agrochemical firm will launch a mixed issue featuring a fresh capital raise of **₹160 crore** and an OFS of **2.04 crore** shares. A significant portion of the fresh proceeds (approx. **₹121 crore**) is allocated for debt repayment. **Market Context** While approval activity is high, market entry remains selective. Associated Power Structures, which had also filed draft papers, withdrew its IPO application on **January 30, 2026**, citing strategic reasons. The primary market outlook for early 2026 remains robust, driven by strong domestic liquidity and a shift toward quality-led listings. Investors are advised to monitor the Red Herring Prospectus (RHP) filings for final price bands and issue dates.

SEBI Issues No-Objection for NSE IPO
**MARKET BRIEF: SEBI Clears Way for NSE IPO** **Major Regulatory Breakthrough** As of **January 30, 2026**, the Securities and Exchange Board of India (SEBI) has officially granted a "no-objection" certificate (NOC) to the National Stock Exchange (NSE). This critical approval ends a decade-long regulatory standstill and clears the path for India's largest stock exchange to go public. **Key Financials & Valuation** * **Valuation:** The NSE is currently commanding a valuation of over **₹5 lakh crore** in the unlisted market. * **Share Price:** Unlisted shares are trading at approximately **₹2,165**, with recent demand driving prices up by 10–15%. * **Recent Performance:** Despite its dominant position, recent financials show sensitivity to market conditions. In the September 2025 quarter (Q2 FY26), the exchange reported a **33% decline** in profit after tax and an **18% drop** in consolidated revenue compared to the previous year. **IPO Timeline & Structure** * **Filing:** The exchange is expected to file its Draft Red Herring Prospectus (DRHP) within the next **3 to 4 months**. * **Listing:** Market analysts anticipate the final listing could take place in **8 to 9 months** (late 2026). * **Structure:** The public issue is likely to be an Offer for Sale (OFS), allowing existing shareholders—including banks and insurance companies—to exit. The government has also approved a **2.5% stake dilution**. **Context & Challenges** This clearance follows the NSE's settlement of the long-standing "co-location" case in late 2024 for **₹643 crore**. While the NOC is a decisive green light, the exchange must still navigate final regulatory reviews and volatile market sentiment before the bell rings on its own listing.
US Futures Pare Losses After Trump Nominates Warsh for Fed Chair
**Market Brief: Warsh Nomination Calms Volatility, Metals Plunge** **indices Stabilize on Fed Clarity** U.S. equity futures and major indices pared earlier significant losses on Friday, January 30, 2026, finding footing after President Donald Trump officially nominated Kevin Warsh as the next Chairman of the Federal Reserve. The announcement provided much-needed clarity to a market recently rattled by uncertainty over central bank leadership and monetary policy direction. **Key Market Moves** * **Equities:** Major benchmarks, including the **S&P 500** and **Dow Jones Industrial Average**, cut overnight deficits to finish the session with stabilized trading ranges. The **Nasdaq** managed to capture upside momentum, aided by mixed mega-cap tech earnings. * **Precious Metals Crash:** In a sharp reversal, commodities faced heavy selling pressure. **Gold** prices plummeted nearly **5%**, while **Silver** tumbled approximately **13%**, erasing recent safe-haven premiums as the dollar strengthened. * **Currency & Rates:** The **U.S. Dollar Index** regained ground, snapping a recent slump. The **10-year Treasury yield** remained largely unchanged, signaling bond market neutrality regarding the appointment. **The Warsh Nomination** President Trump confirmed via social media that former Fed Governor Kevin Warsh will replace Jerome Powell when his term expires in May 2026. Warsh, a known critic of recent Fed policy who has advocated for "regime change" at the central bank, is nevertheless viewed by Wall Street as a credible, "safe" pick compared to other potential candidates. His nomination bridges the gap between the administration's desire for lower rates and the market's need for institutional stability. **Sector Highlights** * **Mining Weakness:** The collapse in metal prices weighed heavily on the materials sector. Major miners like **Newmont Corporation** and **Freeport-McMoRan** saw shares slide significantly, dropping **11%** and **7.5%** respectively. * **Tech Divergence:** Technology stocks traded on earnings-specific news. **Meta Platforms** surged **7%** following strong results, while **Microsoft** slipped **7%** on concerns over cloud growth deceleration, creating a mixed backdrop for the Nasdaq. **Transition Outlook** Attention now shifts to the Senate confirmation process. While Warsh is expected to face scrutiny regarding central bank independence, his previous tenure as a Fed Governor (2006–2011) and crisis-era experience likely position him for approval. Investors are now recalibrating expectations for a potential policy pivot in mid-2026.
MCX, NCDEX to Hold Special Trading Session on Sunday, February 1 for Budget 2026
**SPECIAL SUNDAY SESSION: MARKET BRIEF** **Date:** February 1, 2026 Indian markets open for a rare **Sunday trading session** today, marking only the second time in history the exchanges will operate a full session on a Sunday. This special session aligns with the presentation of the **Union Budget 2026** by Finance Minister Nirmala Sitharaman. **SESSION TIMINGS (Feb 1)** * **Pre-Open:** 09:00 – 09:08 AM * **Normal Market:** 09:15 AM – 03:30 PM * **Derivatives/Currency:** Standard commercial timings apply. * **Settlement:** Today is a settlement holiday. Trades executed today will settle under the regular T+1 cycle starting Monday; **T+0 settlement is unavailable**. **MARKET RECAP (Friday Closing)** Indices ended the week on a cautious note, snapping a three-day winning streak due to profit booking and pre-Budget jitters. * **Nifty 50:** Closed at **25,320** (-98 pts / -0.39%) * **Sensex:** Closed at **82,270** (-297 pts / -0.36%) * **Bank Nifty:** Closed at **59,578** (-0.63%) * **Volatility:** India VIX rose **1.96%** to **13.63**, signaling heightened anxiety ahead of the Budget speech. **SECTOR WATCH** * **Weakness:** **Metals** crashed over **5%** on Friday, emerging as the biggest drag. **IT** stocks slipped ~1% amid global growth concerns and rising US bond yields. * **Defensives:** **FMCG**, **Consumer Durables**, and **Media** bucked the trend, rising over **1%** each as investors shifted to safer bets. * **Focus:** Infrastructure, Defence, and Railways remain key high-beta sectors to watch during the Finance Minister's speech (11:00 AM). **COMMODITIES & GLOBAL CUES** * **Silver Crash:** MCX Silver witnessed a massive sell-off Friday, plunging nearly **15%** to settle around **₹3,42,390/kg**, reversing from record highs near ₹4.2L due to margin hikes and global profit-taking. * **Gold:** Prices corrected sharply, tracking global weakness. * **US Markets:** Wall Street closed lower (Nasdaq **-0.9%**, Dow **-0.4%**), weighed down by tech weakness and mixed economic data. * **Currency:** The Rupee weakened to a record low of **91.98** against the Dollar on Friday. **TRADING OUTLOOK** Expect high intraday volatility. Historical data suggests markets often consolidate during the speech and react decisively post-event. Traders should monitor margin requirements strictly given the expected spikes in VIX.
Indian Stock Markets to Remain Open on Sunday, February 1 for Union Budget 2026
**Sunday Session: Market Brief** **Unprecedented Sunday Trade** Indian equity markets will conduct a full live trading session tomorrow, **Sunday, February 1, 2026**, aligning with the presentation of the Union Budget. This marks a rare departure from standard schedules, being only the second Sunday session in independent India. **Trading Logistics** * **Hours:** Regular market timing applies. Pre-open at **09:00 AM**, normal trading from **09:15 AM** to **03:30 PM**. * **Settlement:** February 1 is a settlement holiday. Trades executed on Friday (**Jan 30**) and Sunday (**Feb 1**) will settle together on Monday, **February 2**. Intraday profits from Friday are effectively locked until Monday. **Current Market Pulse** Sentiment remains cautious leading into the event. Markets closed the Friday session on a weak note due to profit-booking in metals and global headwinds. * **Sensex:** Closed at **82,269.78** (down **296** points) * **Nifty 50:** Settled at **25,320.65** (down **98** points) * **Trend:** January has been shaky, with nearly **70%** of Nifty 500 stocks witnessing corrections. **Budget Day Dynamics** Finance Minister Nirmala Sitharaman will present the Budget at **11:00 AM**. While high volatility is anticipated intraday, historical data suggests the "real" trend often emerges later. * **Day-of Impact:** Historically muted. Average Nifty returns on Budget Day hover around **+0.19%**. * **Post-Event:** The week following the budget typically sees stronger directional moves, with Nifty averaging **+1.35%** returns once policy clarity sets in. **Sector Watch** Traders are closely monitoring fiscal deficit targets (expected around **4.1–4.2%**) and borrowing numbers. Volatility is expected to remain elevated as the market digests announcements in real-time. ... [Union Budget 2026 | Sunday Budget & Markets Open](https://www.youtube.com/watch?v=3SAMz1svQeI) This video provides a quick visual overview of the special Sunday trading schedule and expectations for the Union Budget 2026 session. http://googleusercontent.com/youtube_content/0

Vodafone Leads Seven Major Market Movers Amid Friday Volatility
**Market Closing Brief – Friday, January 30, 2026** **Indices Snap Winning Streak** Indian equity benchmarks ended a three-day rally on Friday, weighed down by heavy profit-booking ahead of the Union Budget. The **Sensex** shed **297 points** (0.36%) to close at **82,270**, while the **Nifty 50** slipped **98 points** (0.39%) to settle at **25,321**. Caution prevailed as investors trimmed positions in high-flying sectors like Metals and IT. **Metals Meltdown** The Nifty Metal index was the biggest drag, crashing over **5%**—its sharpest single-day fall in months. **Hindustan Copper** plummeted nearly **10.5%** to **₹680**, reversing sharp gains from the previous session due to volatile global copper prices. **Vedanta** also faced intense selling pressure, dropping approximately **8%**. Despite reporting a stellar **60% YoY jump** in Q3 net profit to **₹7,807 crore**, sentiment was dampened by the broader sector sell-off and its recent stake sale in Hindustan Zinc. **Key Gainers & Strategic Movers** Defensive buying and strong earnings lifted select counters. **Nestle India** surged over **3%** to emerge as a top Nifty gainer, buoyed by a **45% YoY rise** in Q3 net profit to **₹998 crore** and robust volume growth. **Vodafone Idea** witnessed high investor interest, extending its rally with significant trading volumes. The stock gained ground following reports of narrowing losses and an improved Average Revenue Per User (ARPU) of **₹186**. **Garden Reach Shipbuilders (GRSE)** continued its upward momentum, jumping roughly **8%** to trade near **₹2,790**. The defense PSU reported a strong **74% surge** in Q3 profit to **₹171 crore** and maintained its debt-free status, reinforcing investor confidence. **Short-Term Outlook** Market breadth remained mixed with attention now squarely fixed on the upcoming Union Budget presentation. Volatility is expected to persist as the street awaits clarity on fiscal deficit targets and capital expenditure announcements.
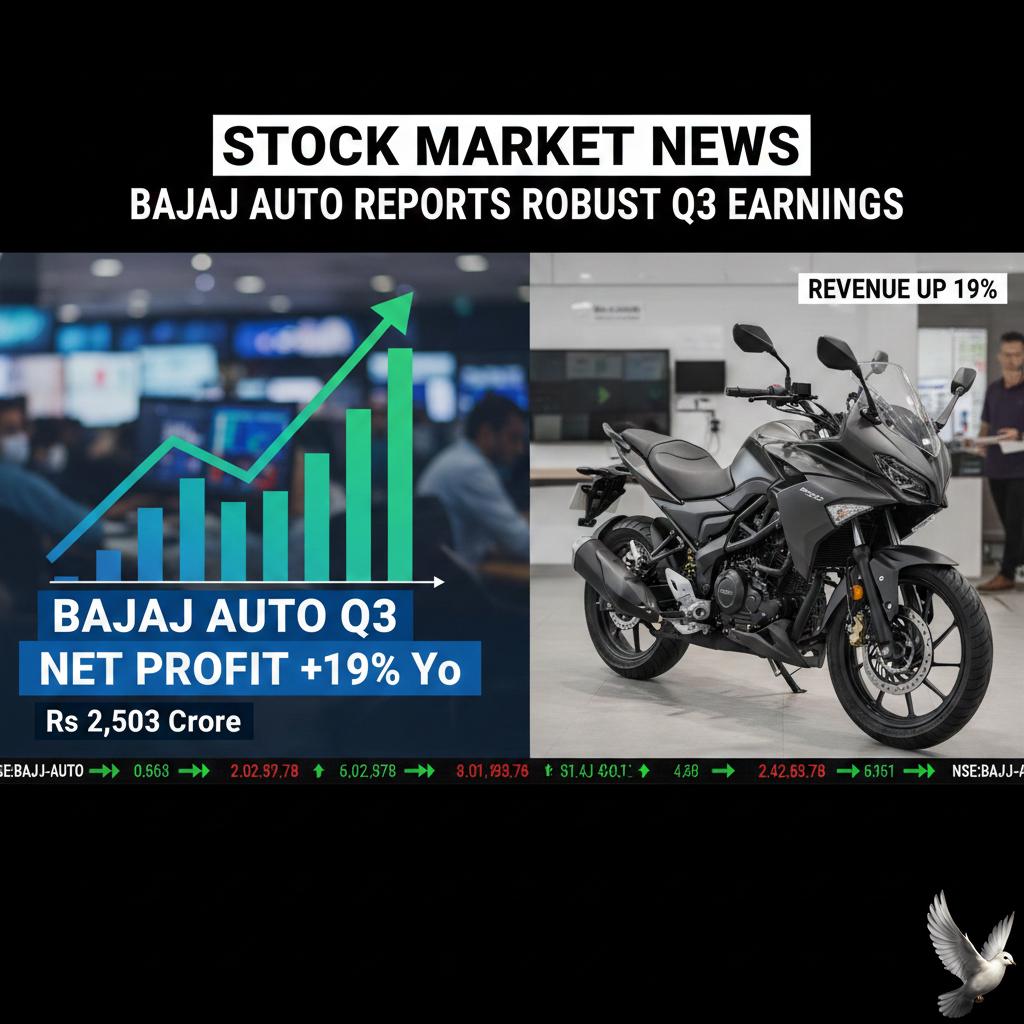
Bajaj Auto Q3 Net Profit Rises 19% YoY to Rs 2,503 Crore; Revenue Up 19%
**Market Brief: Bajaj Auto Q3 FY26 Performance** **Snapshot** Bajaj Auto has delivered a record-breaking performance for the third quarter ended December 31, 2025. The two-wheeler major achieved a historic revenue milestone, crossing the **₹15,000 crore** mark for the first time, underpinned by robust volumes and a richer product mix. **Key Financial Figures** * **Net Profit:** **₹2,503 crore** (↑ 19% YoY) * **Revenue from Operations:** **₹15,220 crore** (↑ 19% YoY) * **EBITDA:** **₹3,161 crore** (↑ 22% YoY) * **EBITDA Margin:** **20.8%** (Expanded by 60 bps) **Operational Highlights** The quarter witnessed historic high retail numbers, driven by sharp execution during the festive season. * **Exports Resurgence:** International business saw a strong recovery with quarterly export volumes crossing **600,000 units** for the first time in 15 quarters. * **EV Momentum:** The electric vehicle portfolio—contributing **25%** of domestic revenues—surpassed the entire previous year's revenue in just this quarter. The **Chetak** scooter recorded an all-time high, growing **70%** over the previous quarter. * **Premium Segment:** The 125cc+ motorcycle segment and the KTM/Triumph portfolio delivered double-digit revenue growth. **Market Reaction & Financial Health** The company maintains a fortress balance sheet with surplus funds of nearly **₹15,000 crore**, even after a significant dividend payout of **₹5,864 crore**. Following the announcement, Bajaj Auto shares closed firm at **₹9,584** on the NSE.

CARE Ratings Revises Vodafone Idea Outlook to Positive on AGR Relief and Capex Plans
**Vodafone Idea (Vi): Credit Outlook & Liquidity Brief** **CARE Ratings Upgrade** CARE Ratings has revised Vodafone Idea’s outlook to **'Positive'** from 'Stable' (reaffirming **BBB-** rating) as of late **January 2026**. This shift reflects improved creditworthiness following recent regulatory relief and clarity on statutory dues. **AGR Deferral & Cash Flow Impact** The Department of Telecommunications (DoT) has frozen Adjusted Gross Revenue (AGR) dues at approximately **₹87,695 crore** (as of Dec 31, 2025). * **Payment Structure:** Repayment is deferred and back-loaded to the **FY32–FY41** window. * **Near-Term Relief:** The freeze eliminates interest accrual on this amount, significantly reducing immediate cash outflows and easing liquidity pressures for the next 5–6 years. **The Spectrum Dues Cliff (FY28)** Despite AGR relief, the financial risk profile remains constrained by massive spectrum obligations. * **FY27:** Annual repayment obligation stands at **~₹6,200 crore**. * **FY28 Surge:** Repayments jump sharply to **~₹16,600 crore**. * **FY29–32:** Obligations escalate further to **~₹27,000 crore** annually. **Turnaround Execution Critical** Meeting these future liabilities hinges on three core factors: 1. **Capex Deployment:** Efficient execution of the planned **₹45,000 crore** capital expenditure over three years to reach 4G/5G parity with rivals. 2. **Tariff Hikes:** Industry-wide tariff revisions (anticipated **July 2026**) are essential to boost Average Revenue Per User (ARPU). 3. **Promoter Support:** Inflow of **₹2,307 crore** cash from Vodafone Group (part of the CLAM settlement) will support immediate funding needs. **Market Reaction** Stock currently trades at **~₹11.15**, reacting positively to the repayment clarity but constrained by the long-term debt wall. [Vodafone Idea AGR relief analysis](https://www.youtube.com/watch?v=0efLxKtrjzc) This video provides a detailed breakdown of the recent government relief on AGR dues and its rescheduling impact on Vodafone Idea's cash flows through FY41. http://googleusercontent.com/youtube_content/0

SBI General Insurance 9M FY26: Gross Direct Premium Up 15%, PAT at Rs 522 Crore
**Market Brief: SBI General Insurance (9M FY26)** **Executive Summary** SBI General Insurance has delivered a robust set of numbers for the nine months ended December 31, 2025. The insurer reported a Profit After Tax (PAT) of **₹522 crore**, driven by disciplined underwriting and significant growth in retail segments. **Top-Line Performance** Gross Direct Premium (GDP) climbed **14.5%** year-on-year to reach **₹10,769 crore**, outpacing the industry average. Growth was particularly aggressive in the non-crop segment, which surged **25.5%**, reflecting a strategic pivot toward more predictable retail lines. **Segment Drivers** Health and Personal Accident (PA) verticals emerged as the primary growth engines, aligning with broader industry trends where health has overtaken motor as the dominant non-life segment. * **Personal Accident:** +49% * **Health Insurance:** +29% * **Motor Insurance:** +19% **Operational Efficiency** Profitability was bolstered by a sharp improvement in the loss ratio, which dropped to **78.5%** from 84.3% in the previous year. This indicates tighter risk selection and better claims management. The company also expanded its market share among private and SAHI players to **6.64%**. **Financial Stability** The insurer maintains a fortress balance sheet with a solvency ratio of **2.12x**, operating well above the regulatory minimum of 1.50x. This capital buffer positions the company to capitalize on recent regulatory tailwinds, including the "Sabka Bima, Sabki Suraksha Act, 2025" and GST exemptions on individual health plans effective since late 2025. **Outlook** With the "Health First" market shift and a digitized distribution model, SBI General is effectively leveraging its parent bank's massive footprint while successfully scaling independent digital channels. The focus remains on profitable growth over pure volume market share.
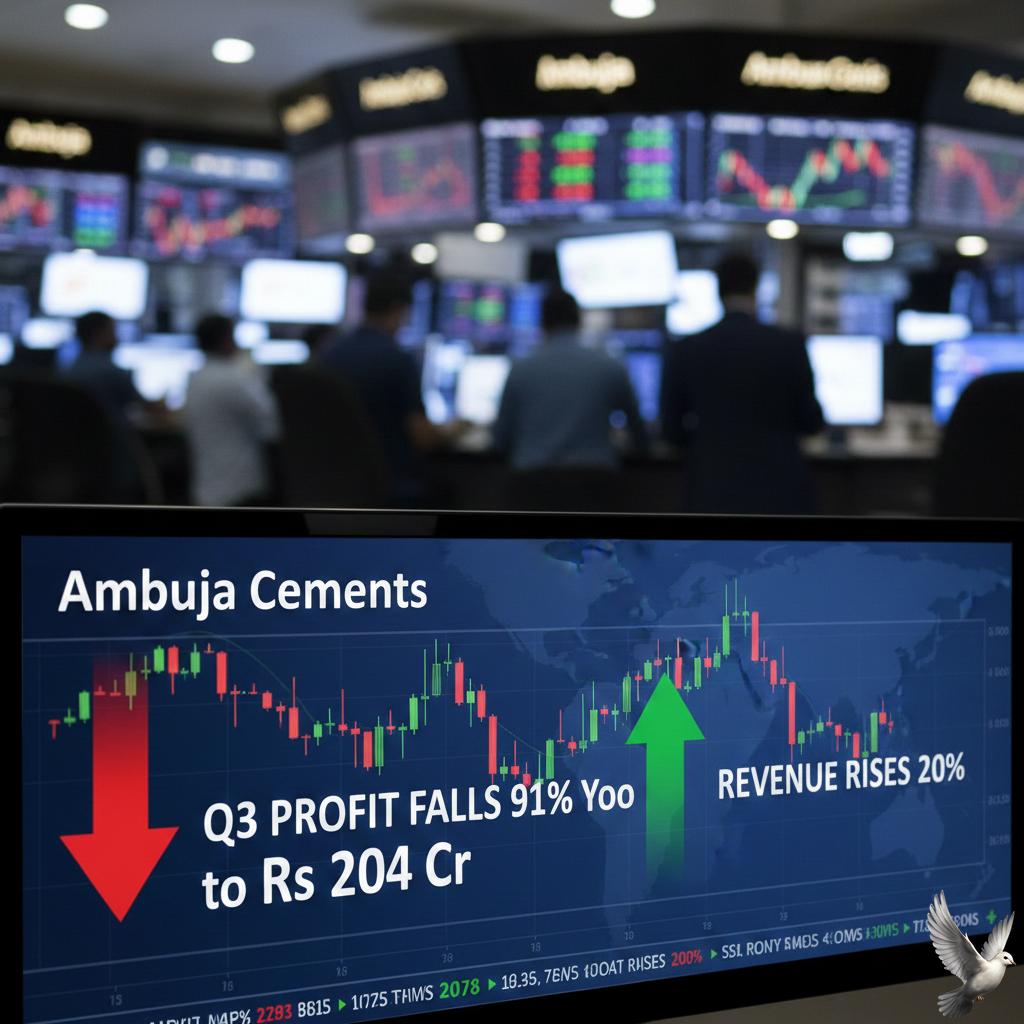
Ambuja Cements Q3 Profit Falls 91% YoY to Rs 204 Crore, Revenue Rises 20%
**Ambuja Cements Market Brief: Q3 FY26 Update** **Volume & Capacity Expansion** Ambuja Cements has reported its highest-ever quarterly sales volume of **18.9 Million Tonnes** for the quarter ended December 31, 2025. This represents a robust **17% YoY growth**, effectively clocking **2x the industry average** (estimated at ~8%). The company’s total cement capacity has solidified at **109 MTPA**, following the successful operationalization of the **2.4 MTPA** Marwar Grinding Unit. Capacity utilization has also seen a significant uptick, improving from **37%** to **58%** YoY for acquired assets. **Premium Portfolio & Realizations** The strategy to prioritize trade sales continues to yield dividends. The share of premium cement is sustained at **35%** of trade sales, with premium volumes surging **31% YoY**. This mix shift has enabled Ambuja to deliver superior realizations compared to peers, with realizations improving by **₹5 per bag** YoY. **Financial Performance** Despite volume leadership, profitability faced headwinds from rising input costs. * **Revenue:** Reached a record **₹10,277 Cr**, up **20%** on a normalized basis. * **EBITDA:** Stood at **₹1,353 Cr**, with margins compressing to **13.2%** (down from ~18% previously) due to higher power and fuel expenses. * **Net Profit:** Reported at **₹378 Cr** (normalized), adjusting for prior one-offs. **Strategic Outlook** The company is aggressively pursuing its 'One Cement Platform' strategy, amalgamating ACC and Orient Cement to streamline operations. Management maintains a strict cost leadership target, aiming to reduce production costs to **< ₹3,650 PMT** by March 2028 through green power initiatives and logistics optimization. **Market Reaction** Following the earnings announcement on January 30, 2026, the stock witnessed immediate pressure, correcting approximately **4.6%** to trade near **₹511**, as the market digested the margin compression despite the topline beat.

NALCO Quarterly Profit Increases on Higher Aluminium Prices
**Market Brief: NALCO Q3 FY26 Financial Results** **Date:** January 31, 2026 **Subject:** Quarterly Earnings Update & Market Reaction National Aluminium Company (NALCO) released its unaudited financial results for the third quarter of FY26 (ended December 31, 2025) on Friday. Despite achieving its highest-ever nine-month performance, the state-run miner reported only a marginal rise in quarterly profit, leading to a sharp correction in its stock price. **Key Financial Highlights** * **Net Profit:** Rose marginally by **1.14%** YoY to **₹1,601 crore**, compared to ₹1,583 crore in Q3 FY25. * **Revenue:** Increased by **1.47%** YoY to **₹4,731 crore**, up from ₹4,662 crore in the corresponding quarter last year. * **Nine-Month Performance:** Recorded a **26%** surge in net profit to **₹4,098 crore** and an **11%** growth in revenue to **₹12,830 crore** for the April–December 2025 period. **Shareholder Returns** The Board declared a substantial second interim dividend of **₹4.50 per share** (90% of face value). * **Total Payout:** Approximately **₹826 crore**. * **Record Date:** February 6, 2026. * **Payment Date:** On or before March 1, 2026. **Market Reaction & Trends** Despite the steady operational numbers, the market reacted negatively, likely due to profit-booking or earnings missing elevated street expectations. * **Stock Price:** NALCO shares plunged approximately **10%** on Friday, closing near **₹385.45** on the NSE. * **Global Context:** Aluminium prices remain robust globally, with LME cash offer prices surging past **$3,325 per tonne** in late January 2026, supported by tight inventories and supply constraints. **Operational Insight** The marginal quarterly growth was sustained by firm global metal prices and higher sales volumes in both the alumina and aluminium segments. However, the stock's double-digit drop suggests that the positives were already priced in following a strong rally earlier in the month.

Silver Drops Below $100, Gold Breaches $5,000 as Dollar Rises on Fed Nominee Report
**🚨 Market Brief: Precious Metals Crash from Record Highs** **January 31, 2026** **📉 The Flash Crash** Global commodity markets witnessed a historic sell-off today, ending a relentless rally that had pushed precious metals to uncharted territories. After touching all-time peaks just yesterday, prices collapsed in one of the most volatile trading sessions in decades. * **Gold (XAU/USD):** Plunged approximately **9%**, shedding nearly **$500** in a single day. Prices dropped from a record high of **~$5,600/oz** to trade below the psychological **$5,000/oz** level. * **Silver (XAG/USD):** Suffered a massive blow, crashing over **25%**. The metal fell from a peak of **~$120/oz** to hover around **$85/oz**, erasing weeks of gains in hours. **🏛️ The Catalyst: New Fed Chair Nominated** The primary driver of this reversal is the official nomination of **Kevin Warsh** as the next Chair of the Federal Reserve. President Trump announced the selection of the former Fed Governor this morning, ending months of speculation. Markets view Warsh as a "hawk"—someone likely to prioritize fighting inflation and defending the currency over loose monetary policy. This stands in sharp contrast to the aggressive rate-cut expectations that fueled the recent metals rally. **💵 Dollar Resurgence (DXY)** The US Dollar Index (DXY) staged a sharp rebound on the news. * The Greenback recovered to **~96.85**, bouncing off multi-year lows. * A stronger dollar makes dollar-denominated commodities (like Gold and Silver) more expensive for foreign buyers, triggering an immediate repricing of assets. **💥 Profit Taking & "Sell the News"** Analysts describe the move as a classic "liquidation event." * **Overextended Rally:** Before today's crash, Gold had surged over **20%** in January alone, driven by geopolitical fears and speculation against the dollar. * **Profit Booking:** With the "Fed Chair mystery" resolved, traders rushed to lock in life-changing gains, leading to a crowded exit. * **Liquidity Flush:** The sheer speed of the drop triggered stop-loss orders, accelerating the decline further as billions in market cap were wiped out in minutes. **📊 Market Context** Despite the brutality of today's drop, the broader trend remains historically significant. * Even with today's losses, Gold is on track for its **best monthly performance since the early 1980s**. * Silver remains up significantly year-to-date, though volatility has reached extreme levels. * Geopolitical tensions (Iran/nuclear talks) continue to provide a floor of support, preventing a total trend reversal for now. **Outlook** Traders are now watching to see if the **$4,880** support level for Gold holds. The market has shifted from "panic buying" to a "wait-and-see" approach as investors digest the implications of a Warsh-led Federal Reserve.