Bullish News
Collection
FMCG Sector Projected for Growth in FY27
**INDIA FMCG SECTOR: RURAL REVIVAL & VOLUME RECOVERY (FEB 2026)** **Sector Overview** India's Fast-Moving Consumer Goods (FMCG) sector is witnessing a decisive turnaround, driven by a robust rural comeback and stabilizing input costs. Industry data for early **2026** projects a **5%** uptick in overall volume growth for the first quarter, with full-year expectations set for **high single-digit** expansion. The market is shifting from price-led growth to volume-led recovery as inflation cools. **Rural vs. Urban Dynamics** Rural India is currently the heavy lifter for the sector, outperforming urban markets for **7 consecutive quarters**. * **Rural Volume Growth:** surged to approximately **7.7%** in recent readings. * **Urban Volume Growth:** trails at roughly **3.7%**, though signs of recovery are emerging in tier-2 cities. * **Driver:** Better agricultural yields and government spending have restored rural purchasing power, prompting companies to expand distribution deeper into the hinterland. **Key Trends & Drivers** **Premiumization vs. Value:** While urban consumers continue to upgrade to premium products (driving value growth), mass-market players are aggressively pushing affordable "bridge packs" (priced at **₹10–₹20**) to recapture volume in price-sensitive regions. **Quick Commerce Boom:** Rapid delivery platforms are becoming a primary sales channel in metros, now accounting for a significant double-digit share of sales for premium brands in top cities. **Cost Environment:** Prices for key raw materials like palm oil and packaging have stabilized, allowing major players like **HUL**, **ITC**, and **Britannia** to improve gross margins. This creates room for increased advertising spend to stimulate further demand. **Corporate Moves** Leading firms are recalibrating strategies to balance volume and margins. Companies like **Marico** and **Godrej Consumer** are targeting double-digit revenue growth by leveraging the rural uptake. **Nestlé India** and **Tata Consumer** continue to focus on innovation in the packaged food and wellness segments to counter competitive intensity from smaller, regional brands. **Future Outlook** The trajectory for **2026** remains positive. With anticipated GST rationalization on essential goods and a forecast of stable monsoons, the sector is poised for a synchronized recovery across both "Bharat" and "India." **Disclaimer:** *This brief is for informational purposes only and does not constitute financial advice.*

7 Stocks Held by a Single Mutual Fund Scheme With Up to 55% Annual Declines
Market data as of mid-February 2026 reveals a stark contrast in the performance of stocks held exclusively by a single mutual fund scheme. Recent analysis of 31 shortlisted unique holdings shows that while concentration can lead to outsized gains, it also exposes investors to significant downside risk. High-conviction bets have produced remarkable outliers. Leading the pack, Knowledge Marine & Engineering Works has surged 143% in the current fiscal year, rising from ₹698 to ₹1,697. This stock is held solely by the Invesco India Infrastructure Fund. Similarly, Rossell Techsys, an exclusive pick by Quant Multi Cap Fund, has climbed 110% to reach ₹595. Other notable gainers include Best Agrolife, up 70%, and Garuda Construction, which rose 60% within the same period. On the other end of the spectrum, exclusive holdings in the small-cap and technology sectors have faced intense pressure. Several stocks in this category have plunged between 41% and 55% over the past year. RK Swamy, held exclusively by Nippon India Small Cap Fund, saw its price slashed by 50%, falling from ₹217 to ₹108. Protean e-Gov Technologies followed a similar trajectory, dropping 47% to ₹708. Broad market trends show mutual funds are shifting their weight toward more stable sectors. In January 2026, many fund houses increased their exposure to PSU Banks, with sector allocation hitting a three-year high of 3.7%. Meanwhile, funds have begun trimming positions in IT and FMCG sectors. The total value of IT holdings dropped slightly to ₹3.95 lakh crore as major players like Wipro and TCS traded nearly 30% below their 52-week highs. Liquidity remains a key focus for institutional players. Total assets under management for the industry stood at approximately ₹64.53 trillion as of February. While equity inflows remain positive, there is a visible move toward "alpha hunting" in thematic and multi-cap funds. This is occurring alongside a 25-basis point cut in the repo rate to 6.25%, the first reduction after a long period of status quo. Investors are seeing high volatility in other asset classes as well. Silver and gold ETFs recently slipped up to 7% as profit-booking intensified. MCX gold futures are currently trading around the ₹1,54,575 mark. With market valuations in certain sectors trading at high multiples, institutional interest is increasingly focused on earnings backing rather than speculative momentum. [Analysis of Indian Mutual Funds](https://www.youtube.com/watch?v=WMABAiW3lhM) This video provides a detailed breakdown of current mutual fund buying patterns and portfolio changes for the year 2025. http://googleusercontent.com/youtube_content/0
ASX Rises as BHP Hits Record High Following First-Half Profit Beat
Australian shares gained momentum on Tuesday, February 17, 2026, as the **S&P/ASX 200** closed **0.32% higher** at **8,965.5 points**. The session was defined by a surge in the resources sector, which offset broader weakness in technology and real estate. The day’s standout performer was **BHP Group**, which saw its shares jump as much as **7.7%** to hit a new all-time high of **$54.20**. This rally followed a blockbuster half-year earnings report, where the mining giant posted a **22% increase** in underlying profit to **US$6.2 billion**. BHP also surprised the market by raising its interim dividend to **US$0.73 per share**, a **46% jump** from the previous year. Copper was the primary engine for this growth, now contributing **51%** of the group’s total earnings. The materials sector led the broader market with a **6.1% gain**, largely driven by the **$16 billion** added to BHP's market capitalization. This strength helped the index recover from a sharp drop seen late last week, even as major global markets in the U.S. and Asia remained closed for holidays. Iron ore remains a critical anchor for the Australian economy. Benchmark prices for **62% Fe** iron ore have remained resilient in early 2026, trading between **US$115 and US$125 per tonne**. This stability continues to provide a steady revenue stream for major domestic miners. Investor attention is now pivoting toward upcoming economic indicators. The **January unemployment rate**, scheduled for release on February 19, is a major focal point. Current data shows the labor market remains exceptionally tight, with unemployment at **4.1%**, the lowest level in seven months. Economists are watching to see if the jobless rate stays below the **4.2%** trend. Sustained strength in the jobs market has increased the likelihood of further interest rate moves from the Reserve Bank of Australia, with a potential cash rate hike to **3.85%** being actively discussed by market analysts. While the heavyweight miners and banks like **CBA**—which rose **12%** over the last five sessions—propped up the index, smaller companies faced headwinds. The **Small Ordinaries** index slipped **0.34%**, signaling that the current rally is highly concentrated in mega-cap stocks.
Motilal Oswal Identifies 10 Bullish Stock Picks Including Groww and Dixon Technologies
Market Brief: High-Conviction Growth Bets Motilal Oswal has identified **Billionbrains Garage Ventures** (Groww) and **Dixon Technologies** as standout "Buy" ideas in its latest non-Nifty coverage. The brokerage is betting on a structural earnings recovery in **2026**, forecasting an improved performance for Indian equities after midcaps trailed estimates in late **2025**. Billionbrains Garage Ventures (Groww) Groww has solidified its position as India’s leading retail brokerage, commanding a dominant active client market share. The platform has successfully disrupted the space with a digital-first approach that now captures nearly **78%** of the industry's active users. * **Financial Growth:** Analysts forecast a robust **30%** EPS CAGR for the **FY25–27** period. * **Revenue Diversification:** While brokerage fees account for **85%** of revenue today, high-margin segments like Margin Trade Funding (MTF) are expected to scale from **1%** to **12%** of the total mix by **2028**. * **Recent Performance:** The stock recently faced a short-term hit of **4%**, trading near **₹166**, following new regulatory norms from the RBI affecting capital market intermediaries. Dixon Technologies (India) Ltd As a high-conviction pick in the Electronics Manufacturing Services (EMS) sector, Dixon is positioned to benefit from the **₹40,000 crore** electronics component outlay announced in the **2026 Budget**. * **Sector Tailwinds:** India's electronics production has reached an estimated **₹11.3 trillion**, with mobile phone manufacturing driving a massive portion of this volume. * **Valuation & Targets:** Motilal Oswal maintains a bullish stance with a target price of **₹20,500**. The stock currently trades near **₹11,751**, reflecting a recovery from its **52-week low** of **9,835**. * **Future Guidance:** Management anticipates mobile phone volumes reaching **60–65 million** units by **2028**. Revenue growth remains aggressive, supported by an EPS CAGR projection of **27%** through **2027**. Strategic Outlook The EMS sector continues to see **30%** year-on-year growth, bolstered by the "China+1" strategy and domestic PLI schemes. Despite recent margin pressures in the mobile segment, high-capacity players like Dixon are achieving operational leverage that justifies a premium valuation. Meanwhile, Groww’s lean, tech-led model is expected to drive EBITDA margins toward **66%** by **2028**. Both companies represent a shift toward secular growth themes where market leadership and scale provide a significant competitive moat.

Gaudium IVF to Launch ₹165 Crore IPO on February 20 as First Fertility Sector Listing
Gaudium IVF and Women Health Limited has finalized its initial public offering (IPO) parameters, setting a price band of Rs 75 to Rs 79 per share. The company seeks to raise Rs 165 crore, a move that values the fertility specialist at approximately Rs 575 crore. The bidding process for the public issue is scheduled to open on February 20 and will conclude on February 24. Retail investors can participate with a minimum lot size of 189 shares, requiring an investment of Rs 14,931 at the upper price cap. Shares are expected to be credited to demat accounts by February 26, with the official listing on the BSE and NSE set for February 27. The offering is structured as a combination of a fresh issue worth Rs 90 crore and an offer for sale (OFS) of Rs 75 crore by the promoter. Out of the fresh proceeds, the company has earmarked Rs 50 crore to establish 19 new IVF centers across India. Another Rs 20 crore is designated for the repayment or prepayment of existing debt, with the remainder supporting general corporate expansion. Gaudium IVF has demonstrated robust financial momentum leading up to its market debut. For the fiscal year ending March 31, 2025, the company reported operational revenue of Rs 70.72 crore, marking a 32% increase from the previous year. Profit after tax reached Rs 19.13 crore for the same period. For the first half of the current fiscal year (H1FY26), the firm recorded a total income of Rs 49.75 crore and a profit of Rs 12.51 crore. The company currently operates a hub-and-spoke model with 7 primary centers and 28 strategic alliance locations across 30 cities. This infrastructure positions Gaudium to capitalize on a rapidly expanding domestic fertility market. The Indian In-Vitro Fertilization (IVF) sector is projected to grow at a CAGR of approximately 13%, reaching an estimated valuation of USD 4.54 billion by 2034. This IPO represents a landmark event as Gaudium becomes the first dedicated fertility services provider to list on Indian exchanges. The move follows a broader trend of investor interest in the Assisted Reproductive Technology (ART) sector, driven by rising infertility rates, delayed parenthood, and increased medical awareness. While the grey market premium (GMP) currently remains muted at Rs 0, the subscription phase will serve as a key sentiment indicator for the healthcare services sector. Following this debut, other major players like Indira IVF are expected to monitor performance closely as they consider their own public listings.
PSU Momentum Persists with Strategic Focus on Defense and Power Sectors
The Nifty PSE Index reached **10,340.60** on February 16, 2026, marking a **1.63%** daily increase as public sector stocks solidify their role as market anchors. The sector's momentum is supported by a significant **11.5%** projected rise in capital expenditure for state-owned firms, totaling **4.84 lakh crore** for the upcoming fiscal cycle. Defence and Power Leadership The defence sector is entering a high-execution phase with revenue growth projected at **15% to 17%** for 2026. This surge is underpinned by a massive order-to-income ratio of **4.4 times**. Major entities like Hindustan Aeronautics (HAL) and Mazagon Dock are benefiting from a **15%** jump in capital outlay, specifically targeting advanced platforms such as submarines and fighter aircraft. The power sector has achieved a record installation of **52.5 GW** of generation capacity so far this year. Renewable energy dominates this expansion, contributing **39.7 GW** of the total. Leading players such as NTPC are aggressively scaling, with targets to add **5,200 MW** of capacity in the current year alone, supported by a planned capex of **28,000 crore** for smart grid and transmission infrastructure. Strategic Caution in Energy The oil and gas segment faces structural challenges as domestic crude output continues a long-term decline from **36 million tonnes** in 2017 to roughly **29.4 million tonnes** recently. While upstream players like ONGC expect modest production gains of **19.8 MMT** this year, the sector remains sensitive to high import dependency, which currently stands at **88%**. Infrastructure underutilization persists, with national gas pipelines operating at only **41%** capacity. Growth in this segment is largely tactical, driven by high dividend yields—averaging between **6.1%** and **7.4%** for major oil and mining PSUs—rather than aggressive capital appreciation. Tactical Outlook for IT The IT sector is transitioning toward a recovery phase with spending in India expected to reach **$176.3 billion** in 2026, a **10.6%** year-on-year increase. Market experts view the current environment as a tactical opportunity rather than a structural breakout, as global tech budgets remain disciplined. Data center systems are the primary growth engine within tech, projected to grow by **20.5%** in 2026. While traditional outsourcing faces margin pressure, specialized segments like software and AI-centric services are seeing double-digit growth. Large-cap firms are maintaining stability through robust dividend payouts and a focus on high-margin cloud modernization projects.
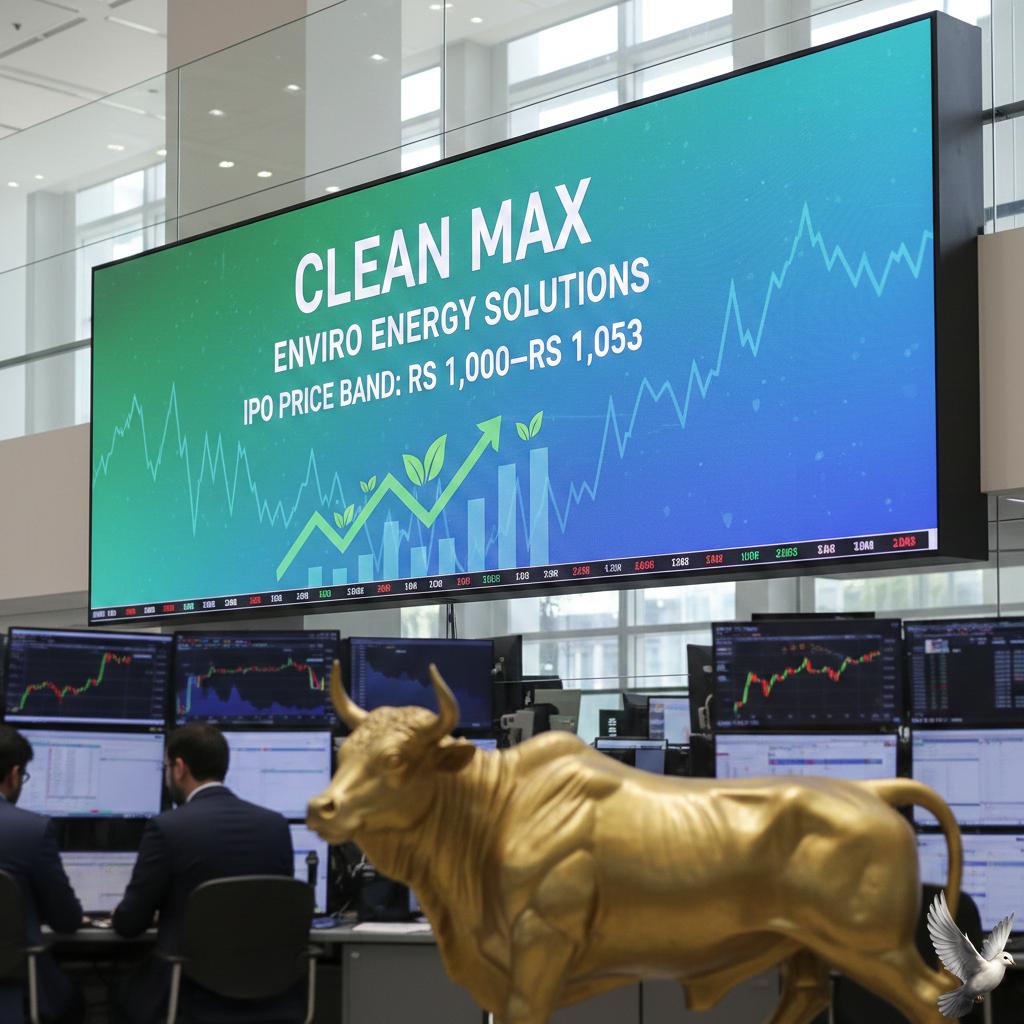
Clean Max Enviro Energy Solutions Sets IPO Price Band at Rs 1,000–Rs 1,053
CleanMax Enviro Energy Solutions has finalized the details for its upcoming Initial Public Offering (IPO), marking a significant milestone in India’s renewable energy sector. The company has set the price band at ₹1,000 to ₹1,053 per equity share. The subscription window is scheduled to open on February 23, 2026, and will close on February 25, 2026. Anchor investor participation is expected to commence on February 20. At the upper end of the price band, the company aims to raise a total of ₹3,100 crore. This capital raise is structured as a mix of a fresh issue worth ₹1,200 crore and an offer for sale (OFS) of 1.80 crore shares, valued at approximately ₹1,900 crore. Notably, the total issue size was revised downward from an earlier proposal of ₹5,200 crore to better align with current market conditions. The proceeds from the fresh issue are largely earmarked for strengthening the balance sheet. Approximately ₹1,122.6 crore will be used for the repayment or prepayment of debt, which is expected to lower interest costs and improve overall profitability. Retail investors can participate with a minimum lot size of 14 shares, requiring an entry-level investment of ₹14,742. A special reservation of shares worth ₹30 crore has been made for employees, who are eligible for a discount of ₹100 per share. CleanMax enters the public market following a strong financial performance. The company reported a turnaround in the 2025 fiscal year, posting a profit of ₹19.43 crore compared to a loss in the previous year. Revenue from operations climbed 13% to reach ₹1,610 crore. More recently, for the quarter ended September 2025, the company saw a massive 222% surge in net profit to ₹239 crore. The company currently manages an operational capacity of 2.54 GW, with an additional 2.53 GW under contract. As the leading provider of renewable energy to the commercial and industrial (C&I) segment, CleanMax serves high-demand clients including data centers and technology firms. The timing of the IPO coincides with a broader surge in India's green energy landscape. The sector added a record 44.5 GW of capacity in 2025, and Budget 2026 has further bolstered the industry with an allocation of over ₹75,000 crore to the Ministry of New and Renewable Energy. Share allotment is expected to be finalized by February 26, 2026, with the official listing on the BSE and NSE tentatively scheduled for March 2, 2026. The issue is being managed by a consortium of lead managers including Axis Capital, JP Morgan, and HSBC.

India Bonds Steady Ahead of Large State Debt Auction
Indian government bonds are trading with a steady to firm bias as the market processes a significant supply of state debt and shifting global cues. The benchmark 10-year bond yield is currently hovering near **6.67%**, reflecting a period of relative stability despite ongoing pressure from state-level borrowing. Market attention is centered on the latest State Development Loan (SDL) auctions. Recent issuances saw states and Union Territories raising approximately **8,450 crore** to **25,000 crore** in various tranches. Cut-off yields for these state bonds have largely settled between **7.26% and 7.45%**, maintaining a consistent spread over central government securities. Domestic inflation dynamics are providing a supportive backdrop for the fixed-income market. India’s retail inflation recently cooled to **2.75%**, staying well within the central bank's comfort zone. This follows a significant base year revision to **2024**, which has reduced the weight of food items in the consumer basket. While price pressures remain low, the Reserve Bank of India maintains a neutral stance after its previous **25 basis point** rate cut, which brought the repo rate to **6.25%**. Global factors are further influencing domestic sentiment. U.S. Treasury yields have faced downward pressure, with the 10-year note yield falling toward the **4.03% to 4.05%** range. This decline is fueled by slowing U.S. retail inflation and heightened expectations for interest rate cuts by the Federal Reserve later this year. Liquidity conditions in the Indian banking system remain a key focus for traders. While the central bank has focused on ensuring orderly conditions, market participants are watching for any potential intervention or shifts in durable liquidity management to drive the next move in yields. The Indian Rupee has shown resilience amidst these fluctuations, trading near **90.71** against the U.S. Dollar. The combination of stable domestic yields, moderated inflation, and favorable demand-supply dynamics for government securities continues to define the current market environment.
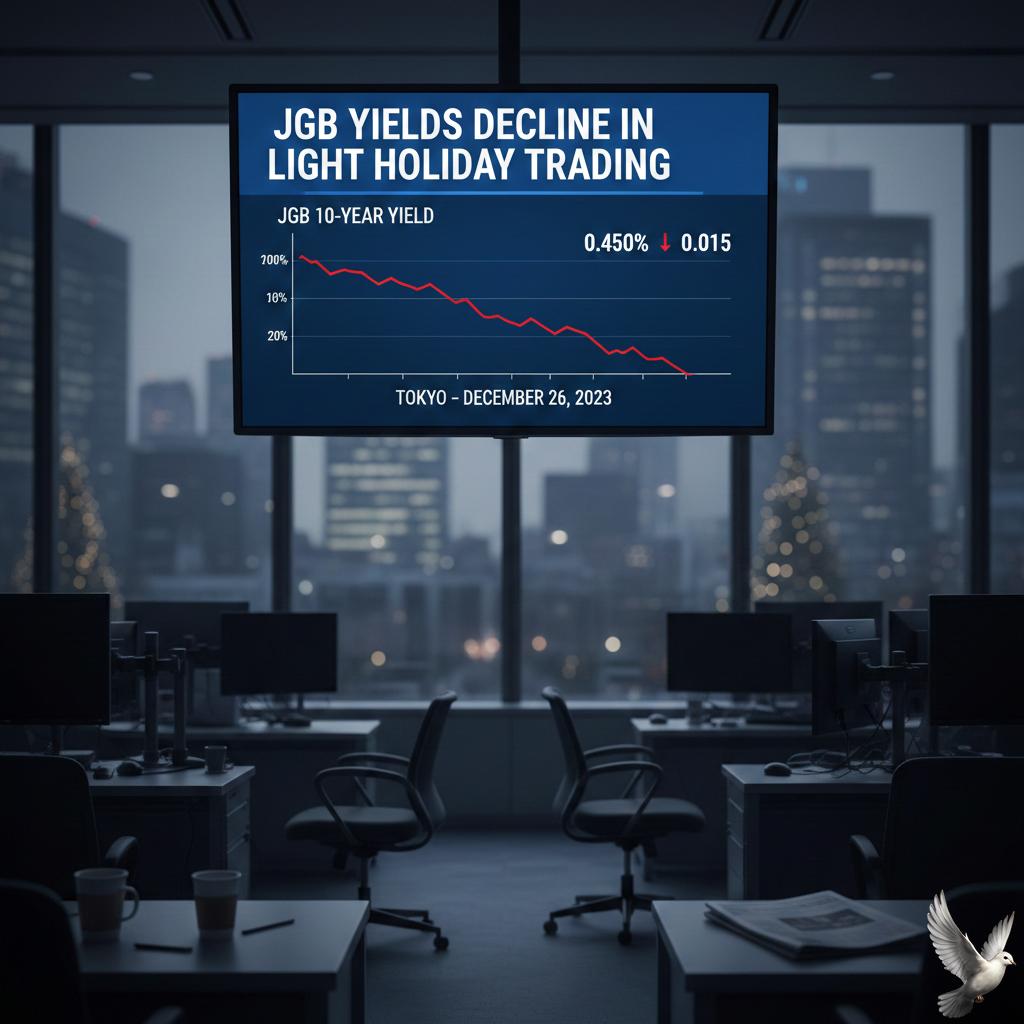
JGB Yields Decline in Light Holiday Trading
**MARKET BRIEF: JGB YIELDS SLIDE AMID HOLIDAY LULL** **Bond Yields Drop** Japanese government bond (JGB) yields fell sharply on Tuesday, driven by holiday-thinned trading and softer-than-expected economic data. The benchmark **10-year JGB yield** slipped to approximately **2.18%**, reaching levels not seen since mid-January. **Super-Long Sector Rally** The super-long end of the curve outperformed, erasing recent volatility. * **20-year yield:** Dropped **5.5 basis points** to **3.025%**. * **30-year yield:** Declined **6 basis points** to **3.025%**. Investors appear to be pricing in expectations for continued fiscal support following disappointing GDP figures, which showed annualized growth of just **0.2%** in Q4, missing the **1.6%** forecast. **Auction Headwinds** Despite the broader rally, the **five-year bond auction** faced tepid demand. The bid-to-cover ratio signaled a "weak outcome," reflecting lingering investor caution in the medium-term zone. The **5-year yield** traded around **1.69%** following the results. **Currency & Market Context** Trading volume remained suppressed with major Asian hubs—including **China, Hong Kong, Singapore, and South Korea**—closed for the Lunar New Year. The Japanese yen strengthened against the dollar, with **USD/JPY** trading near **152.85**, supported by the drop in U.S. Treasury yields while U.S. markets were closed for Presidents' Day. Market participants are now closely monitoring Prime Minister Takaichi's potential fiscal stimulus measures in response to the sluggish growth data.
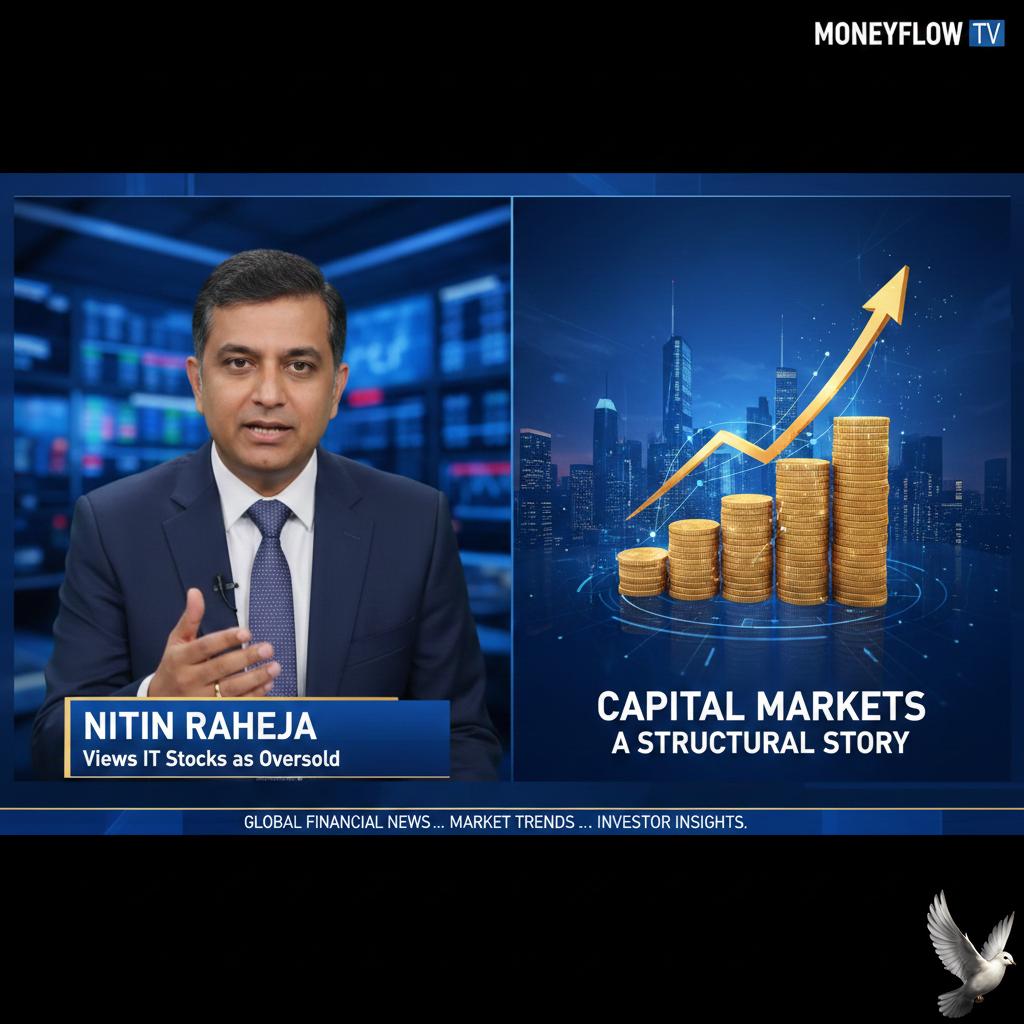
Nitin Raheja Views IT Stocks as Oversold and Capital Markets as a Structural Story
Market dynamics in early 2026 suggest a significant shift in the Indian technology landscape. The Nifty IT index recently experienced a sharp correction, dropping between **11% and 15%** due to investor anxiety regarding artificial intelligence. Analysts at Julius Baer maintain that this selloff is an overreaction. They argue that while AI disruption is a fundamental reality, its impact will unfold gradually over several years rather than causing immediate displacement. Top-tier IT firms are currently utilizing their substantial cash reserves to pivot. Major players have already announced aggressive investments in data centers and AI-focused acquisitions. By leveraging these "cash war chests," the sector is evolving from being a target of AI to an active participant in the global infrastructure boom. Current valuations for these companies remain resilient, supported by attractive dividend yields and strong free cash flow. The strategic shift toward engineering R&D and generative AI is expected to help the industry reach a **$350 billion** mark by the end of 2026, contributing nearly **10%** to India's GDP. The capital markets present a separate but equally compelling structural story. Despite short-term volatility and increased regulatory oversight in the futures and options segment, the long-term outlook remains positive. A primary growth driver is the remarkably low household equity allocation in India. Current estimates place this allocation at just **6% to 7%**, far below levels seen in developed economies or regional peers. This gap represents a massive potential for sustained domestic inflows as financial literacy deepens. Institutional observers favor asset managers and wealth management firms in this environment. As retail investors move away from speculative trading toward long-term wealth creation, asset management companies are positioned to capture the resulting surge in assets under management. The broader economy continues to provide a stable backdrop for these sectors. Real GDP growth for the current fiscal year is projected between **6.8% and 7.2%**, supported by historically low inflation and robust service-sector expansion. While global conditions remain complex, the deepening of India's domestic markets serves as a stabilizing force. The transition from a savings-heavy mindset to a capital-market-led approach is still in its early stages, providing a long runway for the financial services and technology sectors.

**RBI’s New Guidelines Balance Customer Protection and Growth, Says Former SBI Chairman**
**Market Brief: Banking Sector Overhaul & Regulatory Shift** **Date:** February 17, 2026 **Focus:** RBI Regulations, Acquisition Finance, & Market Intermediaries A significant regulatory pivot by the Reserve Bank of India (RBI) is set to reshape the domestic banking landscape effective **April 1, 2026**. The central bank has introduced stringent frameworks targeting mis-selling, acquisition financing, and lending to capital market intermediaries. **1. Crackdown on Mis-selling & Customer Protection** The RBI has issued draft directions on the *Advertising, Marketing, and Sales of Financial Products*. The core objective is to eliminate "dark patterns" and forced bundling—such as making loan approvals contingent on buying insurance. * **100% Refund:** Banks must now refund the entire amount plus compensation if mis-selling is proven. * **Suitability Checks:** Strict profiling is mandatory to ensure products match the customer’s risk appetite and financial literacy. * **Feedback Loop:** A mandatory **30-day** feedback mechanism post-sale has been introduced to verify customer consent and understanding. **Context:** The regulator imposed approximately **₹27 crore** in penalties on banks in CY2025 alone, signaling zero tolerance for compliance lapses. **2. Boost for M&A Financing** In a major structural shift, the RBI’s *Capital Market Exposure Directions* now permit domestic banks to aggressively fund corporate takeovers, a space previously dominated by foreign lenders. * **75% Funding:** Banks can now finance up to **75%** of the acquisition value for eligible borrowers. * **Eligibility Floor:** Borrowers must have a minimum net worth of **₹500 crore** and a **3-year** profit track record. * **Unlisted Access:** Even unlisted companies can access this funding if they hold an investment-grade rating. Former SBI Chairman **Dinesh Kumar Khara** describes this as a "pragmatic" move that retains deal financing within the Indian banking system while ensuring adequate leverage safeguards. **3. Tightening Broker & Intermediary Lending** To curb speculative volatility, the RBI has tightened norms for lending to stockbrokers and market intermediaries. * **100% Collateral:** All credit facilities to intermediaries must now be fully secured; unsecured lines are effectively banned. * **Cash Trap:** For bank guarantees, brokers must provide **50%** collateral, of which **25%** must be strictly in cash. * **Prop Trading Ban:** Banks are explicitly prohibited from financing a broker's proprietary trading positions. **Market Impact:** While this raises the cost of funds for brokers and may squeeze short-term liquidity, experts view it as a necessary step to reduce systemic risk and promote long-term market stability. **Why this matters:** This video features Dinesh Kumar Khara explaining the rationale behind these specific regulatory changes, offering a deeper understanding of how they balance customer protection with banking sector growth. [Dinesh Kumar Khara on RBI's new guidelines](https://www.youtube.com/watch?v=FvVXVYNxNeo) http://googleusercontent.com/youtube_content/0

US Equities: Assessing the Impact of AI Innovation and Performance Trends on Market Volatility
Market Brief: The AI Capital Reckoning Global equity markets are navigating a period of heightened volatility as the initial euphoria surrounding artificial intelligence transitions into a rigorous assessment of financial sustainability. While the disruptive potential of AI remains a central market driver, investors are now demanding clear evidence of return on investment (ROI) to justify the staggering capital requirements of the sector. The scale of investment has reached historic levels. Major technology hyperscalers—including Amazon, Alphabet, Microsoft, and Meta—have signaled a collective capital expenditure package of approximately $700 billion for 2026. This represents a surge of more than 60% compared to 2025. Amazon alone has detailed a $200 billion spending plan, while Alphabet’s projected expenses have nearly doubled year-over-year to meet a backlog of compute demand. This "arms race" for infrastructure is reshaping market valuations. The tech-heavy Nasdaq-100 has experienced a multi-week slide in early February 2026, falling roughly 2% year-to-date as investors rotate out of high-growth software and service sectors. The CBOE Volatility Index (VIX) recently spiked nearly 18%, reaching 20.82, signaling growing anxiety over whether AI-driven revenue can scale fast enough to offset these massive costs. Market data as of mid-February 2026: - Total global AI spending is forecast to reach $2.52 trillion this year. - Hyperscaler capital expenditure is up 60% year-over-year. - The hardware segment currently accounts for 54% of the AI infrastructure market. - S&P 500 tech-sector futures remain under pressure, slipping 0.5% in recent sessions. The narrative is shifting from "AI as a feature" to "AI as infrastructure." High-maturity organizations are moving beyond experimental pilots toward the deployment of autonomous agents capable of executing complex workflows. While this "agentic phase" promises faster ROI in sectors like finance and logistics, the immediate impact has been a "scare trade" in traditional software and business services, where investors fear displacement by AI-native models. Infrastructure providers continue to be the primary beneficiaries of this spending wave. Leading semiconductor foundries and chip designers report revenue visibility extending through the end of the year, supported by a $450 billion market for GPUs and AI accelerators. However, for the broader market, the focus remains on the "Year of Truth"—a phase where the ability to manage data sensitivity and operational costs will determine which firms survive the current volatility. Current trends suggest a bifurcated market. Defensive sectors like utilities and consumer staples have seen modest gains as safe havens, while the technology sector faces a "trough of disillusionment." Investors are now prioritizing firms with disciplined capital allocation and transparent monetization timelines over those pursuing speculative moonshot projects.

Brokerage Outlook on IT Sector: Analyst Perspectives from Nomura, UBS, and Citi
Market Brief: Indian IT Resilience Amid AI Disruption The Indian Information Technology sector is navigating a period of intense volatility as of **February 17, 2026**. After a sharp multi-day selloff that wiped out approximately **$56 billion** in combined market value, key players are staging a recovery. **Infosys**, **TCS**, and **Wipro** saw gains of up to **3%** in recent sessions, providing a much-needed cushion to the broader benchmark indices. Sector Performance and Market Data The **Nifty IT Index** has faced significant headwinds this year, declining nearly **15%** in **2026** so far. This follows a challenging **2025** where the index slipped **12.6%**. Current market weights reflect a shift in investor sentiment: * **IT Sector Weight:** Fallen to **8.7%** from nearly **10%** at the start of the year. * **Banking Sector Weight:** Surged to a record **27.6%**. * **TCS Market Cap:** Recently dipped below the **₹10 lakh crore** mark for the first time since late **2020**, allowing **ICICI Bank** and **SBI** to overtake it in valuation rankings. The Agentic AI Challenge The primary driver of recent instability is the rapid advancement of **Agentic AI**. Unlike previous iterations, these autonomous systems can execute complex workflows without constant human oversight. Brokerages and analysts have highlighted several structural risks: * **TCV Contraction:** Total Contract Values for traditional five-year deals are expected to shrink by **32% to 44%** this year. * **Billing Pressure:** Blended hourly rates for intermediate engineers have softened. For example, India-based developer rates have shifted to a range of **$21–$29** per hour. * **Model Shift:** Clients are moving away from labor-heavy "seat-based" billing toward outcome-linked or subscription-based models. Strategic Evolution and Recovery Despite the "AI scare," industry leaders are pivoting to integrate these technologies. **Infosys**, **TCS**, and **Wipro** have collectively deployed over **200,000** Microsoft Copilot licenses to automate internal coding and operations. Selective opportunities are emerging as firms transition into "Frontier Firms." **Infosys** has partnered with AI specialists like **Cognition** and **Cursor** to deploy AI software engineers, aiming to turn disruption into a growth lever for legacy modernization. While the **Nifty IT Index** remains down roughly **21%** over the last year, selective buying in blue-chip tech stocks suggests that investors are beginning to differentiate between companies at risk and those successfully redesigning their delivery models.

US Market Update: Tech Valuations Adjust Amid Increasing AI Expenditure Scrutiny
US tech giants are navigating a turbulent valuation reset as February 2026 begins. A wave of skepticism regarding the immediate profitability of artificial intelligence has triggered a sharp sell-off across the sector. Investors are no longer rewarding ambitious AI roadmaps; instead, they are demanding clear evidence of returns on the massive capital expenditures currently being deployed. Market data reveals a stark shift in sentiment. Microsoft has seen its valuation drop by approximately 17% year-to-date, wiping out roughly $613 billion in market value. This decline brings its total valuation to $2.98 trillion as of mid-February. Similarly, Amazon shares have fallen 13.8% this year after the company forecasted capital spending would surge by more than 50% in 2026 to support its infrastructure. The reassessment has also hit other leaders in the "Magnificent Seven." Nvidia, despite its dominance in the chip market, has seen its value slip by nearly $90 billion since the start of the year, settling around $4.44 trillion. Alphabet and Apple have followed suit, with Alphabet’s market value decreasing by $88 billion to $3.7 trillion, and Apple losing over $256 billion to reach $3.76 trillion. Total AI infrastructure spending by the five largest hyperscalers is projected to exceed $700 billion in 2026. This aggressive spending is the primary catalyst for the current "valuation compression." Markets are specifically punishing firms where AI investments appear to cannibalize existing software margins or where the "payoff period" remains undefined. In contrast, the "foundational" players of the semiconductor industry are emerging as winners. TSMC has reached record highs, adding $293 billion in market value this year to hit a $1.58 trillion valuation. The firm reported a revenue increase of 36.8% in January 2026 compared to the previous year, driven by its 2nm and 3nm production lines being fully booked by clients desperate for hardware. Samsung Electronics has also gained significant ground, adding $272 billion to its valuation, which now stands at $817 billion. This indicates a strategic rotation toward companies with "earnings visibility"—those selling the tools for the AI boom rather than those still trying to monetize the software. Broader economic factors are compounding the tech sector's volatility. Uncertainty regarding Federal Reserve rate cuts has made high-growth, low-dividend assets less attractive. Investors are increasingly rotating capital into value-oriented sectors like financials and industrials, which offer immediate cash flow and dividend yields as a "shock absorber" against the current tech instability. The narrative for the remainder of 2026 is shifting from speculative growth to defensive quality. While the AI-driven structural change remains intact, the market is currently in a "show me the money" phase, where only companies demonstrating measurable productivity gains or resilient margins are finding support.

Infosys Shares Gain 3% Following Strategic Collaboration With Anthropic
Infosys shares gained over 3% in Tuesday's trading session, emerging as the top performer in the Indian IT sector. This recovery follows a strategic collaboration with Anthropic, a leader in AI safety and research, aimed at deploying advanced agentic AI solutions for global enterprises. The partnership centers on integrating Anthropic’s Claude models, including Claude Code, with the Infosys Topaz platform. This synergy focuses on "agentic AI"—intelligent systems designed to handle multi-step, complex workflows independently rather than providing simple automated responses. Key developments include the launch of a dedicated Anthropic Center of Excellence. This facility will first address industry-specific needs in the telecommunications sector before expanding into financial services, manufacturing, and software development. The market response comes after a period of significant volatility for the sector. The Nifty IT index rose 2.3% today, recovering ground after a sharp 15% decline over the past month. Investors have recently been concerned about structural disruptions in the traditional IT services model, particularly as AI-native tools potentially lower entry barriers for software development. UBS and other major brokerages noted that while valuations in the IT space have corrected meaningfully—now trading at roughly 12–39% discounts to five-year averages—the shift toward becoming "AI orchestrators" remains critical. The Anthropic deal is seen as a pivotal move to modernize legacy systems and accelerate software delivery. Infosys is already utilizing Claude Code within its own engineering units to refine best practices for client adoption. Market data as of February 17, 2026, highlights a broader recovery in tech sentiment. Following a sell-off that erased over $47 billion in market capitalization from Indian software exporters earlier this month, the sector is showing resilience. Current indicators reflect a Nifty IT P/E ratio of approximately 23.2, with analysts suggesting that the most pessimistic disruption scenarios may already be reflected in current pricing. The collaboration aims to transform how businesses handle regulated operations like compliance reviews and risk assessment. By combining engineering scale with frontier AI, the partnership intends to bridge the gap between experimental AI demos and stable, enterprise-grade production environments.
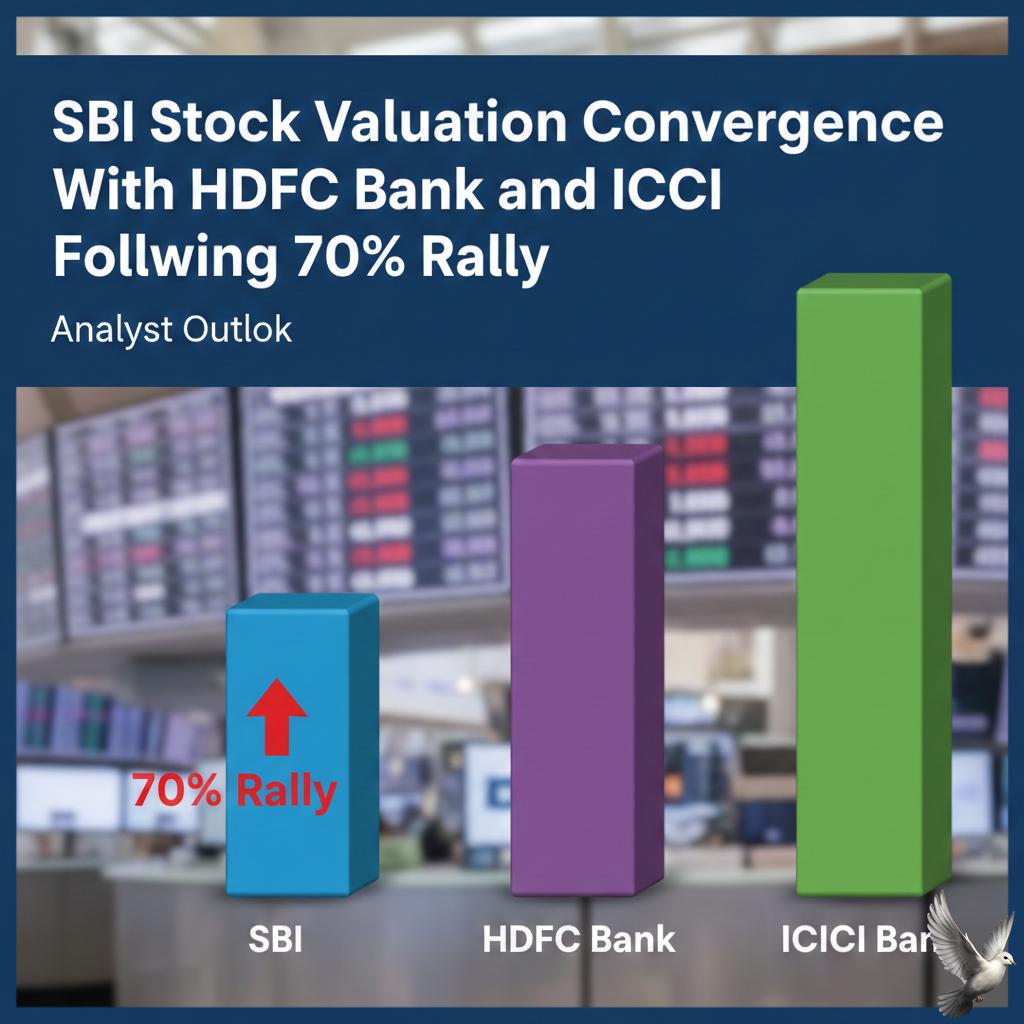
SBI Stock Valuation Convergence With HDFC Bank and ICICI Following 70% Rally: Analyst Outlook
State Bank of India (SBI) has reached a historic milestone, with its stock price hitting an all-time high of **1,225 INR** as of February 17, 2026. The bank’s market capitalization has surged to approximately **11.06 lakh crore INR**, allowing it to overtake tech giant TCS and private lender ICICI Bank to become India’s fourth-largest company by valuation. The rally is supported by a remarkable **68% gain** over the past year, significantly narrowing the valuation gap with private sector peers like HDFC Bank. Investors have reacted positively to record-breaking financial results for the December quarter of 2025. Standalone net profit for Q3 FY26 jumped **24.5%** year-on-year to reach **21,028 crore INR**, the highest quarterly profit in the bank's history. Key performance metrics remain robust despite a competitive interest rate environment. Net Interest Income grew **9%** to **45,190 crore INR**, while the domestic Net Interest Margin (NIM) stayed healthy at **3.12%**. The bank has upgraded its full-year loan growth guidance to a range of **13% to 15%**, fueled by strong demand across retail, SME, and corporate sectors. Asset quality has reached a two-decade peak. The Gross Non-Performing Asset (GNPA) ratio improved to **1.57%**, while the Net NPA ratio dropped to a multi-year low of **0.39%**. Credit costs were contained at a minimal **0.29%**, reflecting disciplined risk management and strong recovery mechanisms. Digital adoption continues to drive operational efficiency. Currently, **98.6%** of all transactions are conducted through alternate channels, and **68%** of new savings accounts are opened via the YONO platform. This digital leadership, combined with a total business volume exceeding **103 trillion INR**, reinforces SBI's dominance in the landscape. While the stock has seen a sharp re-rating, analysts suggest it is moving toward fair value. Brokerage targets now range between **1,210 INR** and **1,300 INR**. With a Return on Equity (ROE) of **20.68%** and a strong capital adequacy ratio of **14.04%**, the bank maintains significant headroom for future expansion, though the pace of recent gains may lead to stabilization at these elevated levels.

Rupee flat at 90.73 against US dollar in early trade
The Indian rupee maintained a steady stance on Tuesday, February 17, 2026, trading near **90.73** against the US dollar. While the local unit saw a marginal opening gain of **1 paisa**, the broader market sentiment remains balanced between supportive global energy prices and persistent pressure from a dominant greenback. The currency market is navigating a tight range as the Reserve Bank of India (RBI) continues its active oversight. Recent sessions have seen the rupee oscillate between **90.60** and **90.78**. Analysts note that suspected central bank interventions have been instrumental in preventing the currency from breaching the psychological resistance level of **91.00**. Energy costs are providing a much-needed cushion for the rupee. Brent crude futures are currently hovering around **$68.47** per barrel, while the Indian crude basket was last priced near **$69.16**. Although geopolitical tensions in the Middle East and naval drills near the Strait of Hormuz keep supply risks on the radar, the overall downward trend in oil prices from earlier peaks has reduced the import bill pressure. Domestic economic indicators remain robust, adding to the rupee’s resilience. India’s retail inflation for January 2026 was recorded at **2.75%** under the newly implemented CPI base year of **2024**. This figure sits comfortably below the central bank’s medium-term target of **4%**, marking the 12th consecutive month that inflation has remained within the tolerance band. Foreign institutional investor (FII) activity continues to be a primary source of volatility. While domestic institutional investors (DIIs) have acted as a stabilizing force with net purchases exceeding **9,775 crore** in February, foreign funds have remained cautious. FIIs have emerged as net sellers so far this month, with outflows totaling approximately **1,374 crore** in the cash market. Market participants are now focusing on upcoming global triggers, including US Federal Reserve meeting minutes and domestic manufacturing data. The dollar index remains firm at **96.78**, supported by cooling but steady US employment figures. In the immediate term, the rupee is expected to remain range-bound. Traders anticipate the currency will find support at **90.65**, with the RBI likely to maintain its strategy of managing liquidity and smoothing out sharp fluctuations to keep the unit below the **91.00** threshold.

Asian Bond Markets Rise Amid Increased Global Demand for Stability
Asian bond markets entered 2026 with significant momentum, recording a fourth consecutive month of foreign net purchases in January. Global investors injected a net $3.78 billion into local currency debt across the region’s key emerging economies, driven by an improving growth outlook and a rebound in manufacturing activity. South Korea emerged as the primary destination for regional capital, attracting $2.45 billion in foreign inflows during January. While this figure softened from the $5.48 billion seen in December, the sustained appetite reflects optimism in the nation’s export sector. The South Korean manufacturing PMI remained in expansion territory at 51.2, supported by global demand for technology and automotive exports. Thailand and Malaysia also maintained positive trajectories. Thai bonds secured $1.5 billion in new investment, while Malaysian debt saw $235 million in inflows. Malaysia’s performance is anchored by stable inflation at 1.6% and a strengthening Ringgit, which has increasingly become a preferred high-quality carry currency for international funds. In contrast, Indonesia saw a sharp deceleration in foreign interest, with inflows dropping to $400 million from the previous month’s $2.1 billion. Investor caution stems from a recent outlook downgrade by Moody’s to negative, citing reduced predictability in fiscal policymaking. Indonesia’s 10-year government bond yield recently climbed to 6.44%, reflecting the heightened risk premium demanded by the market. India experienced the most significant reversal, recording net foreign outflows of $805 million in January—the largest monthly sell-off since April of the previous year. This shift was triggered by Bloomberg Index Services' decision to delay the inclusion of Indian debt in its global bond index. The delay caught many participants off guard, as the market had already priced in the expected liquidity boost from the inclusion. Looking ahead, the regional outlook remains constructive. Most Asian central banks are maintaining steady policy rates, with the Federal Reserve’s pivot toward 3.50% to 3.75% providing more flexibility for local authorities. With manufacturing growth and cooling inflation—notably 2.0% in South Korea—the region is well-positioned to offer attractive real yields throughout the first quarter of 2026.

Naturals Salon Chain Plans 2028 IPO as Contingency to Reliance Deal Negotiations
Market Brief: Naturals and the Indian Salon Sector The Indian beauty and wellness landscape is witnessing a strategic standoff as **Naturals**, one of the country's largest organized salon chains, continues high-stakes negotiations with **Reliance Retail**. As of **February 2026**, Naturals operates approximately **900 outlets**, maintaining its lead over competitors like Lakme and Geetanjali. The company reported a gross merchandise value of **₹450 crore** ($49.6 million) for fiscal year 2025 and aims to hit **₹600 crore** by the end of the current financial year. Deal Structure Friction The primary roadblock in the Reliance deal remains the equity split. Reliance is reportedly seeking a **51% controlling stake** to integrate the chain into its growing beauty ecosystem, which includes the **Tira** retail platform and **Sephora** India. In contrast, Naturals' leadership is holding firm on a **49% sale**. This structure is designed to allow the founders to retain operational control for several more years before a full exit. 2028 IPO Contingency Naturals has confirmed it is not pursuing other investors at this time. If the deadlock with Reliance persists, the chain will pivot toward an **Initial Public Offering (IPO) by 2028**. This timeline aligns with aggressive expansion plans, including the addition of **100 new salons** this year alone. The strategy focuses on high-density clusters in Tier 1 and Tier 2 cities like Pune, where consumer splurge on skincare and makeup is hitting record highs. Industry Dynamics and Growth The broader Indian beauty salon market is currently valued at roughly **$10.8 billion**. It is projected to grow at a **CAGR of 8.5%**, potentially reaching **$22 billion by 2032**. * **Organized Growth**: While the market remains fragmented, organized chains are gaining ground as consumer trust shifts toward branded hygiene and standardized services. * **Revenue Drivers**: Bridal packages and repeat customers currently account for nearly **70%** of annual revenue for leading chains. * **Profitability**: Average operating margins in the sector hover between **25% and 30%**, making it an attractive target for retail giants. Strategic Impact For Reliance, acquiring Naturals would provide an immediate physical service footprint to complement its product-heavy retail play. For Naturals, the partnership offers a valuation boost and a "significant value-add" through Reliance's massive logistics and digital infrastructure. The outcome of these talks will likely set the tone for consolidation across the Indian wellness sector throughout 2026.
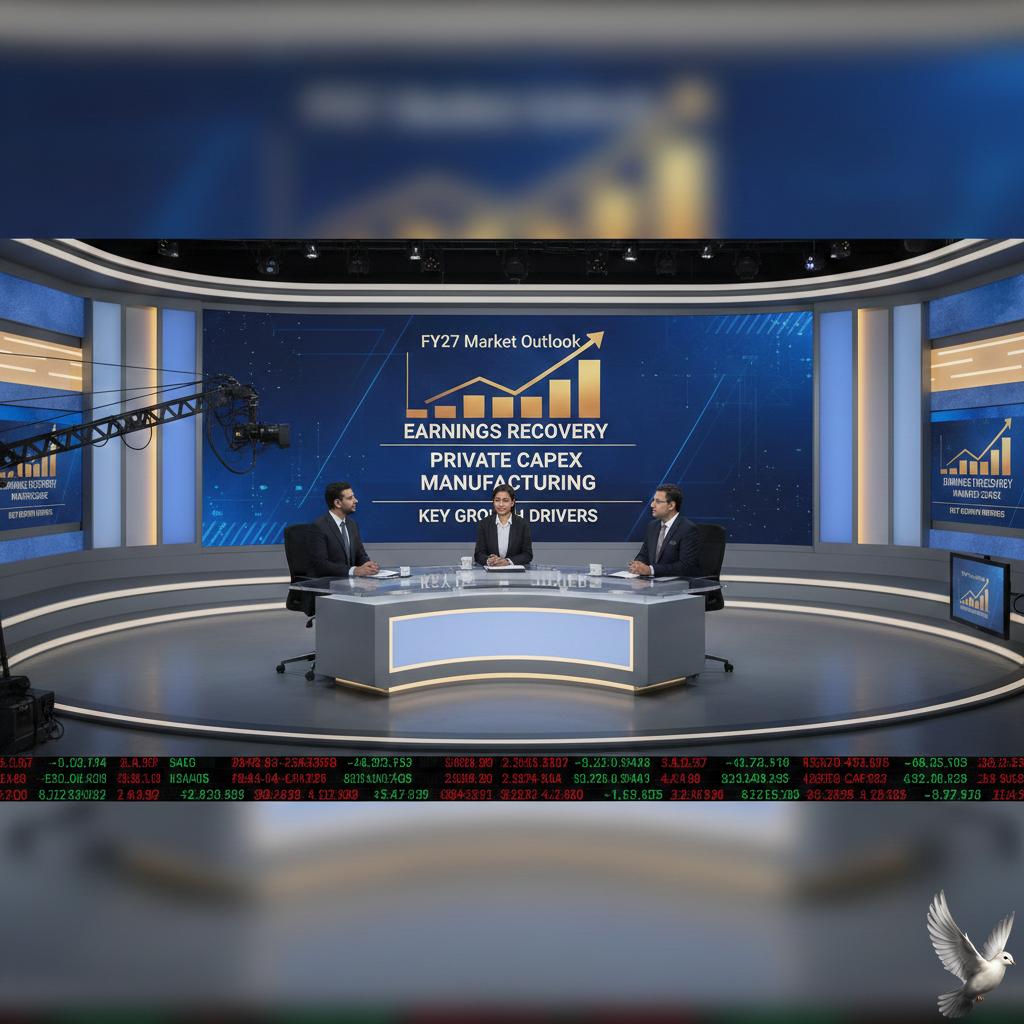
FY27 Market Outlook: Earnings Recovery, Private Capex, and Manufacturing Identified as Key Growth Drivers
Market Outlook: Indian Equities 2026 The Indian equity landscape is entering the new financial year with a high degree of structural resilience. Benchmark indices are maintaining an upward trajectory, with the **Nifty 50** projected to target a range between **29,000 and 32,000** by December 2026. This bullish sentiment is underpinned by consistent corporate earnings and a favorable macroeconomic environment. India continues to lead as the world’s fastest-growing major economy. The Reserve Bank of India (RBI) recently upgraded its **GDP growth forecast for FY26 to 7.4%**, while the IMF has adjusted its outlook upward to **7.3%**. This growth is being fueled by a significant recovery in private consumption and sustained public infrastructure spending. Key Economic Indicators Inflation management remains a cornerstone of current stability. **CPI inflation** is projected to stay benign at approximately **2.1% for FY26**, despite minor pressures from commodity price shifts. In the February 2026 policy review, the RBI maintained the **repo rate at 5.25%**, signaling a neutral but cautious stance. While domestic liquidity remains a priority, the central bank is closely monitoring the rupee, which has recently hovered near the **90 level against the US dollar**. Sector Performance and Capex Trends The manufacturing sector is witnessing a revival, supported by government incentives and supply chain realignments. Investment activity is robust, with **Gross Fixed Capital Formation** growing at **7.8%**. Private sector participation in new investment proposals reached a record share of over **92%** in recent quarterly data. * **Banking & Finance:** Private banks are showing strong credit growth, with outstanding credit increasing by **14.5% year-on-year**. Asset quality is at a multi-decadal high, with Net NPA ratios falling to **0.5%**. * **Consumption:** Urban and rural demand are both accelerating. Consumer staples and discretionary sectors are benefiting from a decade-low inflation average of **1.7%** during the previous nine-month period. * **Technology:** The IT sector is being monitored closely for clearer earnings visibility. Investors are looking for a shift from cautious observation to selective accumulation as global deal commentary matures. Institutional Flows and Market Dynamics Domestic Institutional Investors (DIIs) have become the primary shock absorbers for the market. Recent daily data shows DIIs providing support with net purchases exceeding **1,600 crore**, effectively offsetting periodic Foreign Institutional Investor (FII) outflows. Foreign investors are gradually returning to rate-sensitive sectors. While global headwinds and valuation premiums remain points of discussion, the consensus remains constructive. The stability of India’s fiscal framework, evidenced by recent sovereign credit rating upgrades, continues to attract long-term capital despite global trade uncertainties.