Bullish News
Collection
TCS Share Price Performance: Current Market Trends
Market Overview: February 17, 2026 Global markets are navigating a cautious Tuesday as investors return from the U.S. Presidents' Day holiday. Trading sentiment is currently shaped by geopolitical friction in the Middle East and a shift in the artificial intelligence narrative from pure hype to a "scare trade" focused on sector cannibalization. Equities and Indices U.S. equity-index futures are signaling a soft opening. **S&P 500** futures dropped **0.4%** this morning, while the **Nasdaq 100** fell **0.8%**. This follows a historic milestone in early February where the **S&P 500** crossed the **7,000** level for the first time. International performance remains mixed. The **MSCI EAFE** index rose **0.49%** recently, while Japan’s **Topix** slipped **0.9%** today. European markets are also trending lower, influenced by a lack of fresh catalysts and holiday closures in several Asian hubs, including China and Hong Kong. Commodities and Energy Energy markets are holding gains as geopolitical risk premiums rise. **WTI Crude** is trading at **$63.66** per barrel, up **1.22%**, while **Brent Crude** stands near **$68.47**. Markets are reacting to Iranian naval exercises near the Strait of Hormuz, a critical corridor for global oil transit. Precious metals are facing downward pressure. Spot gold has slipped **0.6%** to **$4,960** per ounce. Despite the dip, gold prices remain historically high, having influenced recent central bank inflation forecasts. Central Bank Policy Monetary policy has entered a "simultaneous hold" phase. The Reserve Bank of India recently maintained its repo rate at **5.25%**, signaling a neutral stance that is expected to persist for the next **9 to 12 months**. In the U.S., the Federal Reserve has kept rates steady as the market awaits January inflation data. Traders are currently pricing in a **35%** probability of a global recession in 2026, though corporate earnings for the **S&P 500** are still projected to grow between **13%** and **15%**. Sector Trends: Tech and AI The technology sector is undergoing a "Year of Truth." Investors are now shunning speculative AI pilots in favor of "Physical AI" and enterprise-grade infrastructure. High-profile partnerships, such as **AMD** and **Tata Consultancy Services** deploying AI data centers in India, are challenging established leaders like **Nvidia**. A new "AI cannibalization" fear is impacting software and business services. Analysts are increasingly shorting companies whose workflows may be replaced by autonomous agents, while going long on firms providing the hardware and open-standard frameworks for the next generation of data centers. Key Economic Indicators * **US 10-Year Treasury Yield**: **4.03%** * **Bitcoin**: **$68,472** * **USD/INR**: **90.56** * **India GDP Projection (FY27)**: **6.9%** Global trade remains in flux as new tariff regimes take hold. U.S. imports of certain goods have seen relative price shifts of up to **17%** compared to 2024, forcing a rapid reallocation of market shares across global supply chains.
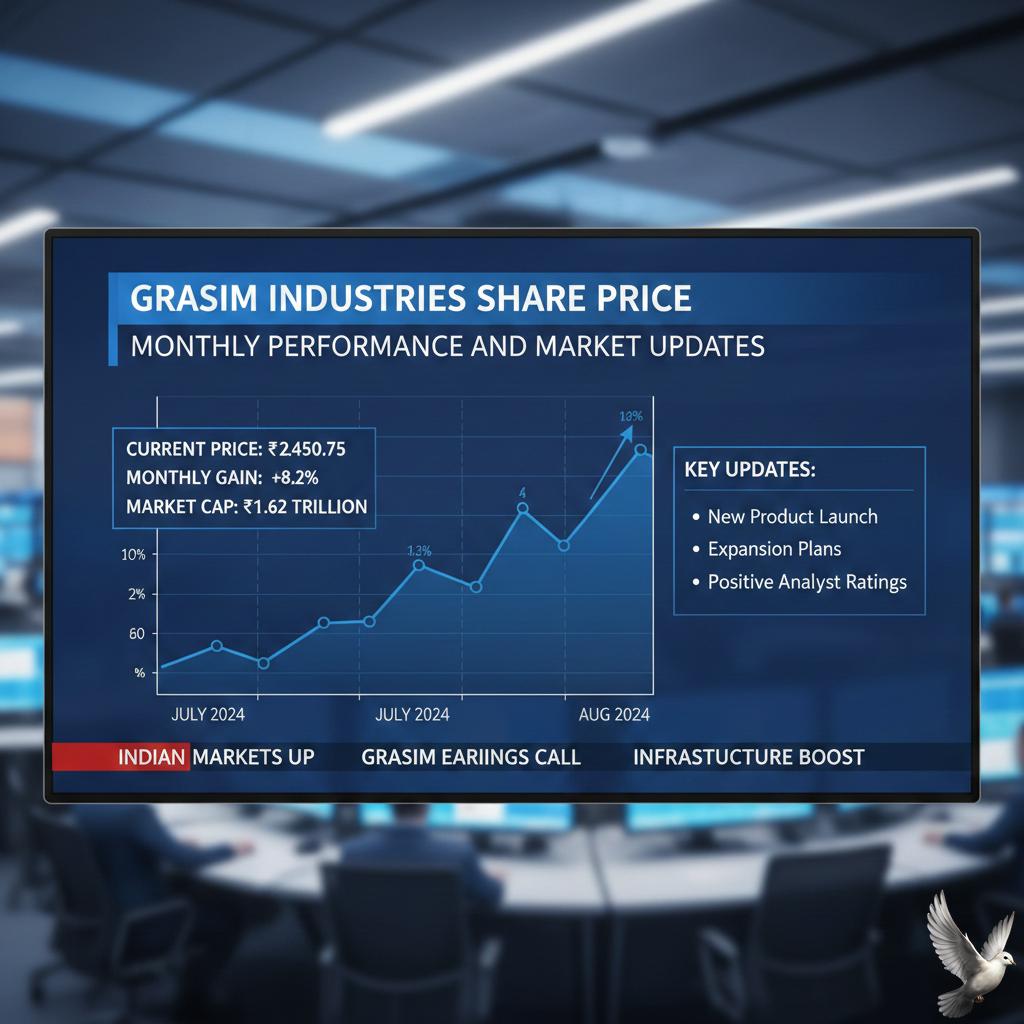
Grasim Industries Share Price: Monthly Performance and Market Updates
Global Market Brief: February 17, 2026 Global financial markets are navigating a landscape of technical resistance and geopolitical anticipation. With U.S. markets returning from the Presidents Day holiday, investors are focusing on high-stakes negotiations in Geneva and a fresh batch of corporate earnings. Equities and Indices Major U.S. benchmarks remain near record territories despite a quiet holiday session. The **S&P 500** is holding steady at **6,836**, while the **Dow Jones** sits at **49,501**. In contrast, the **NASDAQ** has seen a slight pullback of **0.22%** to **22,547**, largely driven by profit-taking in the software sector following concerns over AI-driven licensing shifts. In Asia, trading remains thinned by Lunar New Year holidays across China, Hong Kong, and South Korea. Japan’s **Nikkei** dipped **0.5%** to **56,806** following softer-than-expected GDP data, which showed an annualized growth of only **0.2%** for the fourth quarter. Meanwhile, India’s **Nifty** showed resilience, closing above the **25,650** mark as local buying offset global volatility. Energy and Commodities Energy markets are seeing renewed upward pressure. **Brent Crude** has climbed to **$68.62** per barrel, an increase of **1.3%**, as traders monitor U.S.-Iran nuclear talks. **WTI Crude** followed suit, rising **1.4%** to **$63.73**. The energy sector is also adjusting to a forecast demand increase of **850,000** barrels per day for 2026, primarily driven by non-OECD economies. Precious metals have entered a corrective phase. **Gold** prices have retreated below the psychological **$5,000** threshold, currently trading at **$4,990.63**, a decline of **1.06%**. Technical indicators suggest the metal reached overbought levels, leading to a break below short-term support lines. **Silver** is also under pressure, facing dynamic resistance near the **$77.00** mark. Economic Indicators and Policy Monetary policy remains at a critical juncture. The **Bank of England** recently held its rate at **3.75%**, with a significant minority pushing for a cut. Global inflation is projected to fall more sharply in the second quarter of 2026, with the UK targeting **2.1%** by June. In the U.S., the Federal Reserve is maintaining a target range of **3.50% to 3.75%**. Markets are pricing in a gradual easing cycle, though a stronger-than-expected labor market—with unemployment at **4.3%**—has tempered expectations for aggressive cuts. Digital Assets and Trade The cryptocurrency market is largely range-bound. **Bitcoin** is trading at **$68,420**, down slightly by **0.18%**. **Ethereum** has shown more strength, gaining **1.91%** to reach approximately **$2,813**. Global trade continues to be reshaped by shifting tariff policies. Recent data highlights a more restrictive landscape, with South African wine exports facing a **17%** relative price increase, while Italian rice imports have become **12%** cheaper due to new preferential margins.
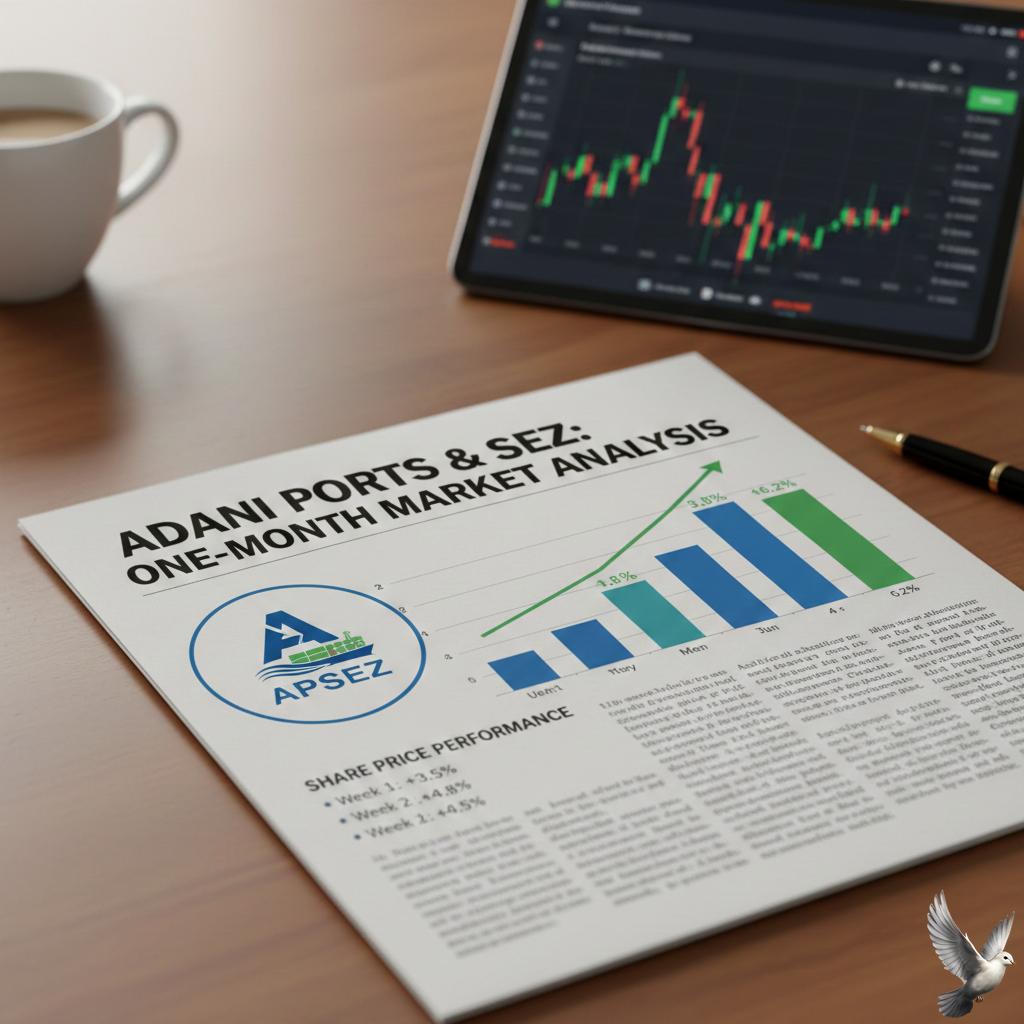
Adani Ports and SEZ Share Price Performance: One-Month Market Analysis
Market Brief: Global Economic Outlook – February 17, 2026 Global markets enter mid-February 2026 facing a period of heavy pressure as the initial optimism of the new year collides with rising refinancing risks and persistent geopolitical tensions. The global growth projection for **2026** is currently estimated at **2.6%**, a slight downtick from the **2.8%** recorded in **2025**. Despite this softening, consumption remains a primary support pillar for the international economy. The U.S. Federal Reserve maintained its benchmark interest rate in the **3.5% to 3.75%** range during its most recent meeting. While the market had anticipated further easing, the Fed has signaled a pause to evaluate "sticky" inflation, which currently hovers near **2.7%**. This caution is amplified by the upcoming expiration of the Fed Chair's term in May **2026**, introducing a layer of leadership uncertainty into monetary policy. Equities and Sector Performance Equity markets are showing significant polarization. The S&P 500 is trading near **6,836**, while the Nasdaq Composite sits at **22,547**. After a holiday-shortened week, U.S. index futures indicate a cautious reopening with slight declines. The technology sector, which dominated the previous two years, is now facing intense scrutiny over capital expenditure. Major tech firms have reported quarterly infrastructure spending exceeding **$37 billion**, leading investors to demand more immediate returns on large-scale investments. Despite these pressures, cloud growth remains robust, with sector leaders reporting revenue increases of **39%** in their specialized service segments. Commodities and Currencies Precious metals have experienced a sharp correction in February **2026**. Gold prices, which peaked earlier in the year, have retraced from over **$5,700** to approximately **$4,990** per ounce. Silver has also seen a significant pullback, dropping **8.8%** in recent sessions as higher-for-longer interest rate expectations reduce the appeal of non-yielding assets. Energy markets are currently defined by a supply surplus. Brent crude is projected to average near **$60** per barrel for the remainder of the year, down from **$68** in **2025**. This decline is attributed to increased global production and a moderate slowdown in industrial demand. Regional Growth Engines India continues to emerge as a primary driver of global expansion, with a growth forecast of **6.1%** for **2026**. This performance is bolstered by strong domestic demand and a landmark trade agreement recently reached with the European Union. Conversely, China's growth is expected to moderate to **4.4%** as the region grapples with long-term debt and industrial overcapacity. In Europe, Germany is initiating a major investment plan to fuel a **1%** GDP rebound, while France faces ongoing challenges with a public deficit remaining above **5%**. Emerging market ETFs have nonetheless seen record inflows of **$20.6 billion** this month, as investors rotate capital toward regions with higher growth potential and improving fiscal balance sheets.
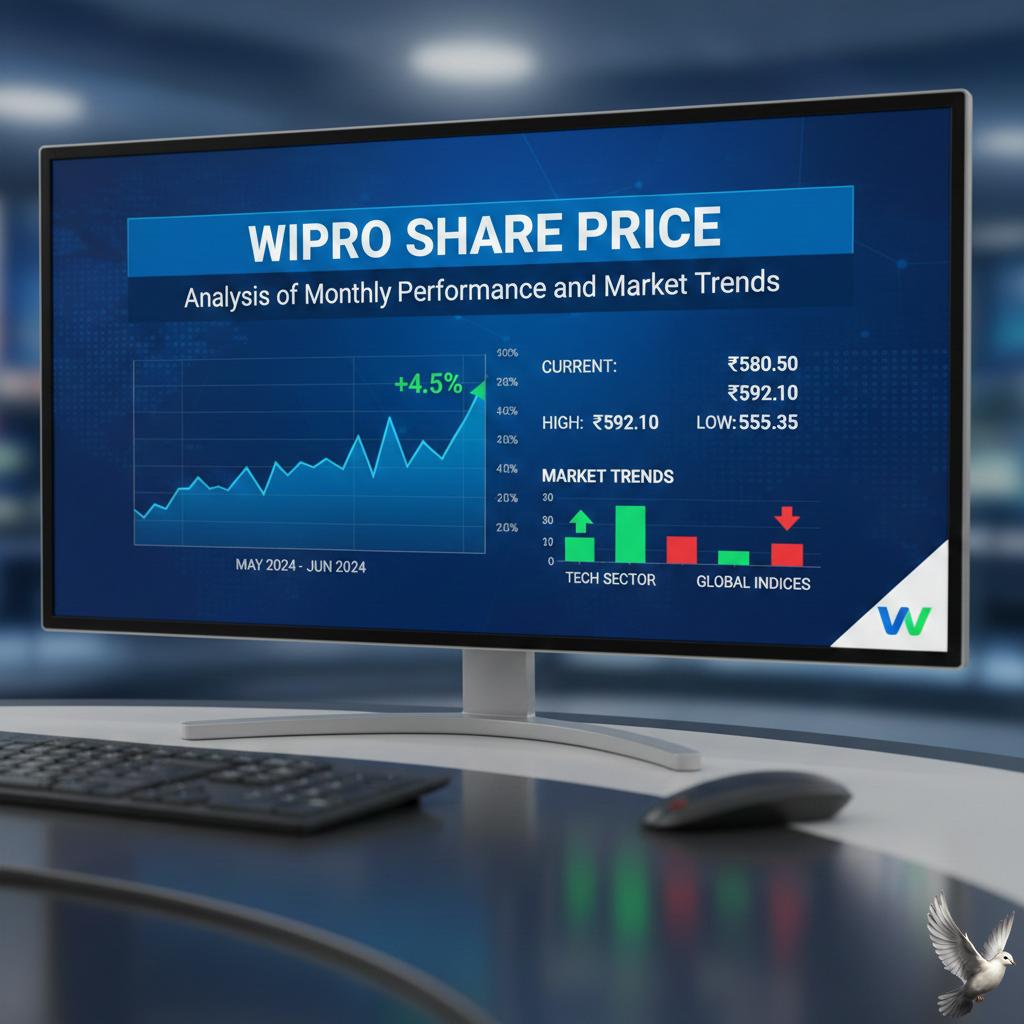
Wipro share price: Analysis of monthly performance and market trends
Market Brief: Global Economic Outlook February 2026 Geopolitical friction and shifting trade policies have emerged as the primary drivers of market volatility this week. Risk-off sentiment is intensifying as investors track indirect nuclear negotiations in Geneva and naval exercises near critical shipping corridors. These developments are directly impacting energy transit routes and weighing on broader market confidence. Equity Market Performance Major indices started the week under pressure. In the Indian market, the **SENSEX** opened lower at **83,197** following a previous close of **83,277**, while the **Nifty 50** hovered around the **25,637** level. This cautious positioning follows a period where foreign institutional investors remained net sellers, offloading approximately **₹972 crore** in a single session, while domestic institutions provided a buffer by purchasing **₹1,666 crore**. Global performance remains uneven. While the **Dow Jones** showed a marginal gain of **0.10%**, the **Nikkei** dropped **1.14%** and the **Shanghai Composite** fell **1.26%**. Analysts note that market participants are transitioning from an easing cycle to a period of sustained high interest rates, with many central banks expected to hold rates steady through the first half of 2026. Commodities and Currencies The energy sector is reflecting heightened risk premiums. **Brent crude** prices have climbed to **$68.65** per barrel, a rise of over **1.3%** as supply disruption fears grow. In contrast, precious metals are seeing a correction. **Spot gold** has dropped below the psychological **$5,000** mark, trading near **$4,989** per ounce, while **silver** fell significantly to **$74** per ounce. The **US Dollar Index (DXY)** remains firm at **97.10**, exerting pressure on emerging market currencies. The **Indian Rupee (INR)** is currently trading at **90.65** against the dollar. This currency weakness, combined with a **45%** contraction in specific export sectors like gems and jewelry, suggests a challenging environment for trade balances. Macroeconomic Indicators Global growth for 2026 is currently projected at **3.3%**, showing resilience despite trade frictions. India continues to lead major economies with a projected **7.4%** GDP growth for the fiscal year. This is supported by strong industrial output, which reached a two-year high of **7.8%** recently, and a robust services sector growing at **9.1%**. Inflation remains a mixed story. While India’s headline **CPI** stood at a modest **1.3%** in recent readings, global "sticky" inflation persists around **3%**. Markets are now awaiting the Federal Reserve's latest meeting minutes and upcoming **GDP** data to determine if the current restrictive monetary conditions will endure through the summer. Trade and Sector Trends New trade frameworks are redrawing the competitive map. US tariff shifts have made certain imports, such as South African wine, **17%** more expensive, while others have become cheaper. In the industrial space, sectors like electronics and telecom are showing high growth, with electronics exports expanding at an annual rate of **38.8%**. Large-scale infrastructure projects also remain active, evidenced by recent defense and railway contracts totaling over **₹5,200 crore**.

HUL Share Price: Stock Performance and Market Trends
Global Market Brief: February 17, 2026 Global equity markets are navigating a period of cautious consolidation as geopolitical tensions in the Middle East and shifting interest rate expectations influence investor sentiment. While indices show localized volatility, the underlying economic momentum remains resilient, supported by robust manufacturing data and the maturing integration of advanced technologies. Equity and Index Performance Major benchmarks are trading with modest fluctuations as investors digest recent corporate earnings and macroeconomic signals. In the Asia-Pacific region, the **Sensex** is positioned around **83,056**, reflecting a slight decline of **0.26%**, while the **Nifty 50** hovers near the **25,590** mark. Sector-specific movements highlight a divergence in preference: * **Advancing:** Information Technology and Public Sector Banks. * **Declining:** Metal, Realty, and Private Banking. In the United States, the **Dow Jones** remains relatively steady with a marginal gain of **0.10%**, while the **Nasdaq** saw a slight pullback of **0.22%** following a localized selloff in large-cap technology shares. Commodities and Currency Energy markets are reacting to supply-side uncertainties and diplomatic developments. **Brent Crude** has climbed to **$68.65** per barrel, a rise of **1.33%**, as markets price in risks associated with ongoing US-Iran nuclear negotiations. The metals market shows mixed results. **Gold** has experienced a short-term cooling, trading near **$4,989** per ounce (down **0.61%**) as the **US Dollar Index (DXY)** remains firm at **97.10**. In currency markets: * **USD/INR:** 90.74 * **EUR/USD:** 1.1851 * **GBP/USD:** 1.3628 * **USD/JPY:** 153.56 Economic Indicators and Growth Global growth for **2026** is currently projected at **3.3%**. India continues to lead among major economies with a projected growth rate of **7.4%** for the fiscal year. Manufacturing remains a core driver, with Gross Value Added (GVA) growth reaching **9.13%** in recent quarters. Industrial activity is supported by significant core sector expansions. Crude steel production has risen by **11.7%** year-on-year, while coal output has exceeded **1,000 million tonnes**, signaling strong internal demand for energy and infrastructure materials. Key Trends and Geopolitics Geopolitical risk is the primary variable for the remainder of the quarter. The **Munich Security Conference** has highlighted strategic realignments within NATO, while tensions in the Middle East continue to provide a floor for energy prices. In technology, the "Year of Truth" has arrived for enterprise systems. Companies are moving away from experimentation toward structural integration of autonomous operations. This shift is particularly visible in the energy sector, where the transition to **Relay Protection 2.0** and digitalized power grids is becoming a national security priority to protect against supply shocks and cyber threats.

SBI Share Price: Market Performance Overview
Market Overview: February 17, 2026 Global financial markets are navigating a complex landscape defined by shifting central bank leadership, geopolitical negotiations, and a structural transition in the technology sector. While volatility has increased compared to 2025, underlying corporate earnings and a move toward monetary easing continue to provide a constructive backdrop for risk assets. Equity Indices and Sector Performance The **S&P 500** continues to target new highs, currently projected to reach **7,800** within the next 12 months, representing a potential **14%** annual gain. This optimism is fueled by expectations of a market-friendly policy mix and anticipated interest rate cuts in the first half of 2026. In India, the **Nifty 50** is holding above the **25,650** level, showing resilience despite recent regulatory changes regarding proprietary trading. The **Sensex** remains active near **81,000**, supported by a significant rally in IT stocks. Technology remains the primary driver of market movement, though the narrative is shifting. Investors are moving away from infrastructure hardware toward software and services that demonstrate clear AI monetization. However, "AI-led shocks" have caused localized volatility in the software-as-a-service (SaaS) sector due to fears of license contraction. Commodities and Currencies Precious metals are experiencing a sharp correction in mid-February. **Spot Gold** has slipped below the **$5,000** per ounce threshold, down over **2%** in recent sessions. Despite this immediate dip, institutional forecasts remains bullish with long-term targets reaching **$5,500** per ounce as central banks continue to diversify reserves. **Silver** is facing even greater pressure, trading below the psychologically important **$80** mark. In energy markets, **Brent Crude** has seen significant downward movement, recently trading near **$66.45** per barrel. The **US Dollar Index (DXY)** has shown recent strength, rising **0.2%** as traders digest US inflation data. However, the broader trend for 2026 suggests a weakening greenback, following a **9.4%** decline in 2025. Economic Indicators and Policy Inflation in developed markets is hovering near the **3%** mark, proving stickier than anticipated. This has caused a shift in market pricing for Federal Reserve actions; traders are now pricing in at least two rate cuts for 2026, with July seen as a likely starting point. **Key Data Points:** * **US Unemployment:** Currently at **4.3%**, with January hiring exceeding expectations at **130,000** new jobs. * **India GDP Growth:** Projected to remain strong at **7%** for the fiscal year, supported by a **9.1%** expansion in the services sector. * **Interest Rates:** India's Repo Rate stands at **5.25%**, with the 10-year G-Sec yield at **6.70%**. Key Events and Geopolitics Market attention is fixed on the resumption of **US-Iran nuclear talks** and the transition of the Federal Reserve leadership. The nomination of **Kevin Warsh** to succeed Jerome Powell in May 2026 has introduced a new layer of pragmatism to monetary outlooks. Additionally, the landmark **India-EU Free Trade Agreement** is being viewed as a critical hedge against global trade volatility. In the US, the "One Big Beautiful Act" is expected to reduce corporate tax bills by **$129 billion** through 2027, providing a substantial tailwind for domestic earnings.
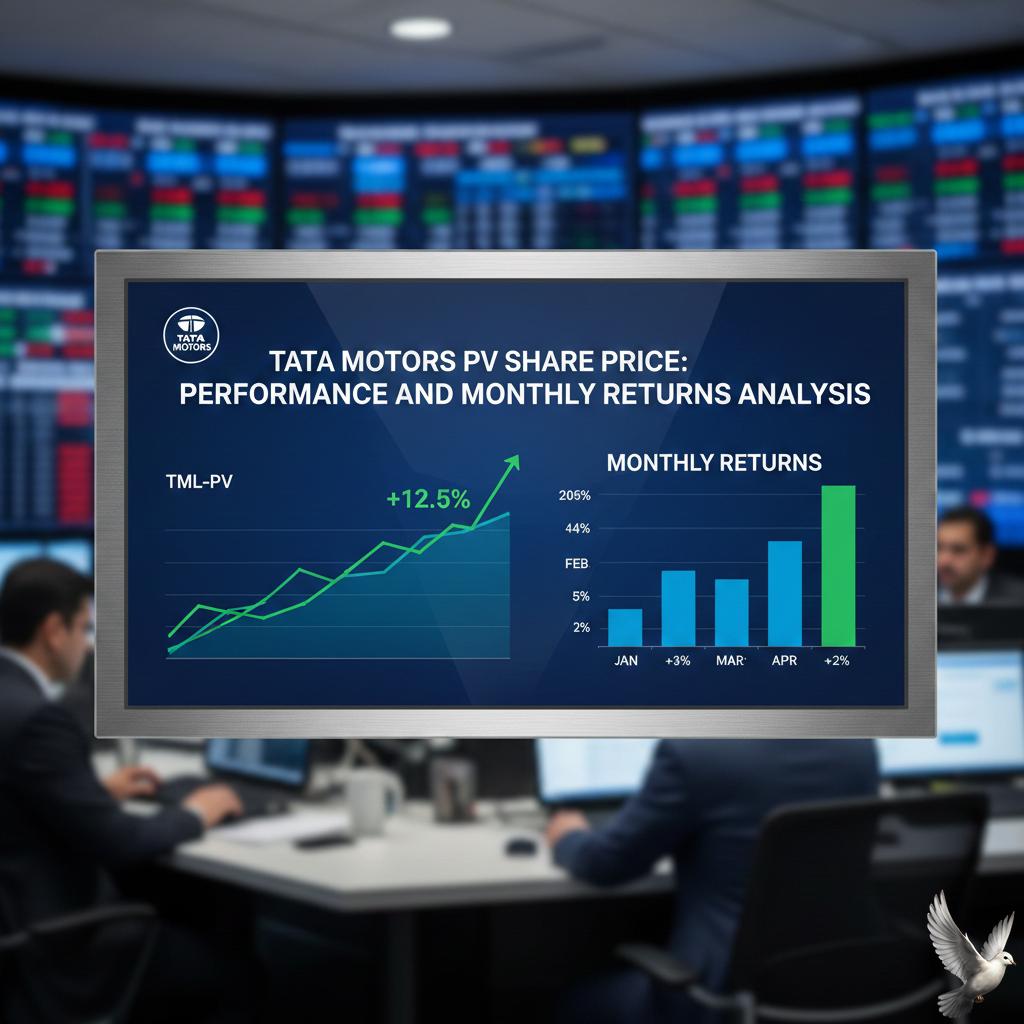
Tata Motors PV Share Price: Performance and Monthly Returns Analysis
Market Brief: February 17, 2026 Global equity markets are navigating a period of broadening leadership as the dominance of megacap technology begins to share the stage with cyclical sectors. Recent data shows the **S&P 500** successfully crossing the **7,000** milestone, supported by a revised U.S. GDP growth rate of **4.4%**. While technology remains a core driver, the **Energy** sector emerged as a significant leader with gains of **14.18%**, followed by **Materials** at **8.64%**. The transition in U.S. monetary policy remains a focal point for investors. With inflation normalizing toward **2.4%**, market expectations are coalescing around a terminal interest rate of **3.0%** to **3.25%**. The recent nomination of Kevin Warsh as the next Federal Reserve Chair is being closely monitored for potential shifts in the central bank’s hawkish stance. Commodities and Currencies Commodity markets are experiencing heightened volatility, particularly in industrial metals. **LME Aluminium** prices saw a sharp technical correction on **February 13**, pulling back into the middle of its three-year trading range. Conversely, **Gold** remains a standout performer, with analysts upgrading year-end targets toward **$5,600** per ounce as institutional demand intensifies. **Brent Crude** is currently trading near **$68.34** per barrel. While energy markets remain firm in the short term, high supply levels are expected to cap further significant upside. In the currency space, the **U.S. Dollar Index (DXY)** holds steady around **97.13**, though the greenback is estimated to be roughly **15%** overvalued, suggesting potential downside as global rate environments converge. Regional Highlights and Trade India continues to demonstrate significant domestic resilience. The country's real GDP is projected to grow by **7.4%** for the **2025–26** fiscal year. The **Nifty 100** and **Midcap** indices showed slight pullbacks of **0.26%** and **0.18%** respectively in early Tuesday trade, reflecting cautious sentiment amid geopolitical uncertainty. Strategic corporate developments in the region include a major **₹5,000 crore** defense order for **Cochin Shipyard**, providing strong revenue visibility for the shipbuilding sector. Global trade dynamics are being reshaped by shifting tariff policies. New measures have notably impacted sector competitiveness; for instance, **South African wine** exports to the U.S. have become **17 percentage points** more expensive compared to **2024**, while **Italian rice** imports have gained a **12 percentage point** price advantage. These adjustments are forcing a gradual reallocation of global sourcing and supply chains. Emerging Risks While the macro backdrop remains generally supportive, several risks are being monitored: * **Refinancing Pressure**: Approximately **25%** of U.S. debt is due for refinancing within the next year. * **Supply Chain Constraints**: A tightening supply in the memory-chip industry, driven by high demand for hardware, is creating pricing pressure across electronic products. * **Geopolitical Friction**: Trade policy is increasingly influenced by security considerations rather than traditional efficiency, contributing to a more fragmented global market environment. Investors are now turning their attention to upcoming quarterly earnings reports and fiscal policy updates in Europe to gauge the sustainability of the current market momentum.
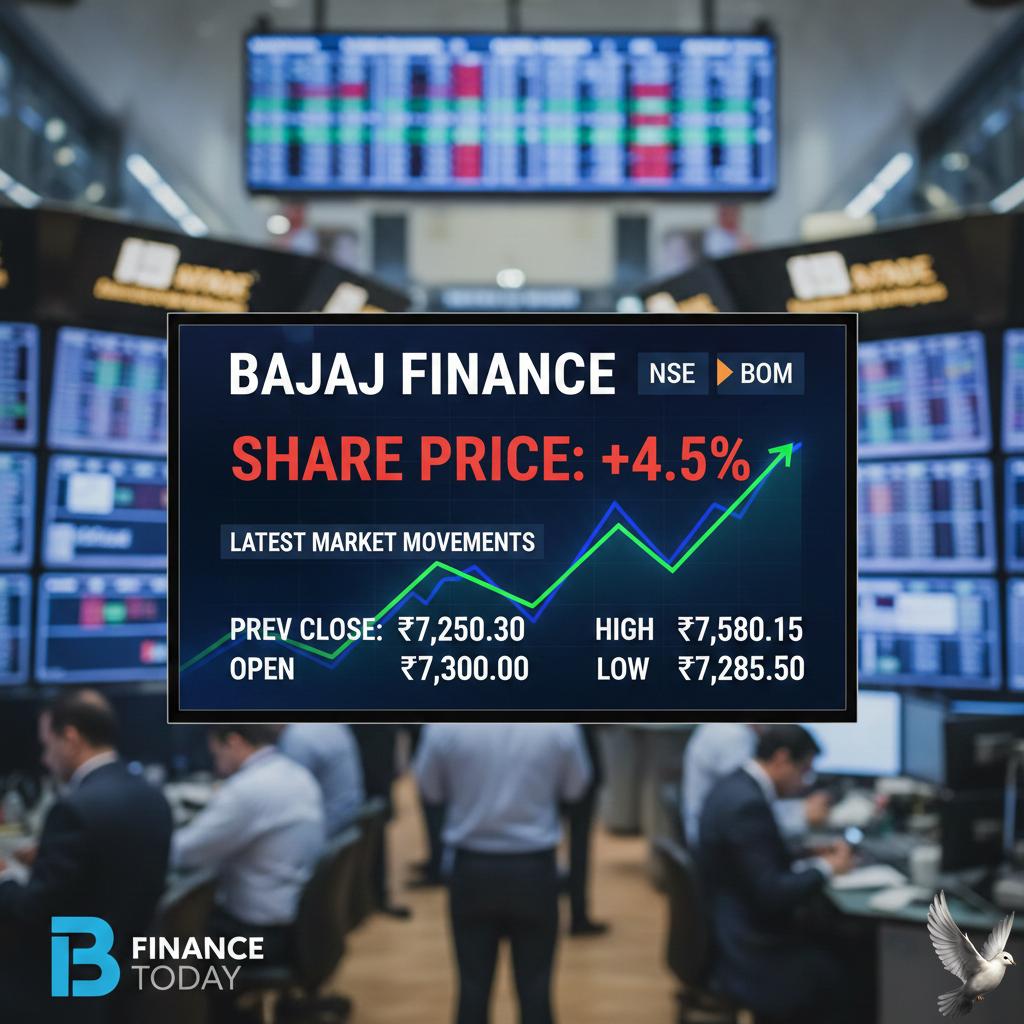
Bajaj Finance Share Price: Latest Market Movements
The global economic landscape in February 2026 is characterized by a "steady but divergent" growth trajectory. Global GDP is currently projected to expand by 3.3% for the year. While recession risks have moderated, a 35% probability of a downturn remains a focus for major financial institutions. The "Goldilocks" era of low inflation and easy money has largely transitioned into a period of "sticky" inflation. Most developed market central banks have paused their easing cycles, holding interest rates at levels significantly higher than pre-2020 norms. In the United States, the Federal Reserve is expected to maintain rates until a leadership transition in May, with potential cuts later in the year aimed at reaching a 3.0% target. Equity and Digital Asset Performance Financial markets are showing a cautious mood as of mid-February. U.S. equity-index futures recently trended downward, with S&P 500 contracts dropping 0.4% and Nasdaq 100 futures slipping 0.8%. This follows a period of high concentration in the technology sector, leading some investors to rotate into Asian and emerging markets. The digital asset market has faced a sharp correction. Bitcoin is currently trading near $68,489, a significant decline of 21.7% since the start of the year. This represents a 45.7% retreat from its all-time high of approximately $126,272 reached in October 2025. Technology and Infrastructure Shifts The "Big Tech" sector has experienced a valuation contraction, losing an estimated $1.3 trillion in 2026. This decline is largely driven by investor fatigue over massive AI capital expenditures and fears that immediate returns may not justify the spending. Despite the stock market volatility, physical AI infrastructure continues to expand. Data center capacity is seeing unprecedented investment, particularly in emerging hubs like India, where capacity is expected to reach 10 gigawatts by 2030. Enterprises are shifting focus from experimental AI models to "agentic" and "physical" AI—systems that can autonomously execute real-world tasks. Energy and Commodity Trends Energy markets are grappling with a supply-demand imbalance. Brent crude oil prices averaged $67 per barrel in January but are forecasted to decline toward $58 per barrel by the end of 2026. This downward pressure stems from global production exceeding demand, despite short-term spikes caused by geopolitical tensions in the Persian Gulf. Natural gas prices have seen a different trend, with Henry Hub spot prices surging nearly 40% in early 2026 due to weather disruptions. Meanwhile, renewable energy is gaining a larger share of the power mix, with solar generation expected to increase by 17% this year. Trade Policy and Global Competition Global trade is being redrawn by aggressive tariff shifts. New restrictive measures have created a highly uneven landscape for exporters. For instance, relative tariff positions for certain agricultural goods have shifted by as much as 17 percentage points in just two years. These policy changes are forcing corporations to adopt "scenario-driven" supply chain strategies. While some exporters in South America and Southeast Asia are finding new opportunities, others are facing significant market access barriers that are reshaping global sourcing and investment flows.

**Bajaj Finserv Share Price: Analysis of Monthly Performance**
Market Brief: Global Economic Outlook and Performance **February 17, 2026** Global financial markets are navigating a complex landscape defined by resilient growth in specific regions, a transition in central bank policies, and heightened geopolitical sensitivity. While global growth for **2026** is projected at a steady **3.3%**, the momentum remains uneven across major economies. Equity Market Performance Major indices showed a mixed start to the week. In India, the **SENSEX** climbed **650 points** to settle at **83,277**, while the **NIFTY 50** rose **0.83%** to reach **25,682**. Despite this strength, early trade on February 17 indicates a cautious shift, with **GIFT Nifty** futures dropping nearly **100 points** due to soft cues from Asian counterparts. In the United States, markets remain largely flat. The **S&P 500** recently crossed the **7,000** milestone for the first time, though tech-heavy indices like the **Nasdaq** have faced slight pressure, declining **0.22%** in recent sessions. European markets are also seeing modest moves, with the **FTSE** up **0.26%** and the **DAX** down **0.46%**. Commodities and Currencies Geopolitical tensions in the Middle East are providing support to energy prices. **Brent Crude** is currently trading at **$68.65** per barrel, up **1.33%**. Conversely, a firmer dollar has pressured precious metals. **Gold** has slipped below the significant **$5,000** threshold, currently trading near **$4,989** per ounce, a decline of **0.61%**. The currency market remains volatile. The **USD/INR** pair is holding at **90.65**, while the **Dollar Index (DXY)** sits at **97.10**. In major pairs, the **EUR/USD** is trading at **1.1851** and the **USD/JPY** has reached **153.56**. Monetary Policy and Inflation Central banks are shifting from the aggressive easing seen in 2025 to a "simultaneous hold" strategy. The **Reserve Bank of India** maintained the repo rate at **5.25%** this month, keeping a neutral stance as inflation remains benign at approximately **2.1%**. In the U.S., headline **CPI** has eased to **2.4%**, slightly lower than the expected **2.5%**. This cooling has fueled speculation of further rate cuts later in **2026**, despite the Federal Reserve currently holding steady. The **Bank of England** also maintained its Bank Rate at **3.75%** in a narrow **5–4** vote, signaling that future easing will be data-dependent. Key Risks and Trends * **Trade Dynamics:** A new interim trade deal between the U.S. and India aims to reduce tariffs to **18%** on key goods, potentially boosting Indian exports. * **Fiscal Shifts:** India’s **Budget 2026** has increased public capital expenditure to **₹12.2 trillion**, focusing on infrastructure and manufacturing. * **Geopolitical Volatility:** Ongoing indirect nuclear talks in Geneva and naval exercises in critical shipping corridors continue to drive "risk-off" sentiment among global investors.

NTPC Share Price: Market Performance and Growth Trends
Global Market Brief: February 17, 2026 Global financial markets are navigating a period of heightened caution as geopolitical tensions in the Middle East and evolving monetary policy signals dictate investor sentiment. Equity benchmarks across major regions are showing signs of consolidation following recent volatility. In the United States, major indices have retreated from record levels reached earlier this month. The **S&P 500** recently closed lower by **1.39%**, while the technology-heavy **Nasdaq 100** shed **1.37%**. The **Dow Jones Industrial Average**, which briefly breached the historic **50,000** milestone, has since pulled back to settle near **49,600**. Investor focus remains fixed on the Federal Reserve's next moves. Current interest rates are held in the **3.5% to 3.75%** range. Market participants are pricing in at least two **25-basis-point** cuts for the remainder of 2026, though a pause is widely expected through the spring as the central bank monitors inflation, which recently printed at **2.4%** year-over-year. Commodities and Energy Geopolitical risks, specifically involving indirect nuclear talks in Geneva and military posturing in the Gulf, are injecting volatility into energy markets. **Brent Crude** has seen a **12%** rise since late 2025, currently trading near **$62** per barrel. Gold remains a primary safe-haven asset despite a slight retreat from its January peaks. Spot gold is currently hovering between **$4,950** and **$4,970** per ounce, maintaining its position near the critical **$5,000** psychological threshold. Analysts have revised year-end targets for the precious metal upward to **$5,600** per ounce. Asian Market Performance In India, the **Sensex** and **Nifty 50** opened the session with modest losses of approximately **0.30%**. The **Nifty 50** is trading just below the **25,600** level. Market breadth remains mixed, with IT and public sector banks providing some support against declines in the metal and realty sectors. Institutional activity shows a divergence in strategy. Foreign portfolio investors (FPIs) recorded net sales of over **₹972 crore**, while domestic institutional investors (DIIs) counterbalanced this with net purchases of **₹1,666 crore**. Technology and Innovation Trends The technology sector is transitioning from experimental artificial intelligence to structural integration. The "Year of Truth for AI" has seen enterprises move toward autonomous agents and "Cloud 3.0" architectures. Emerging **6G** research is also gaining momentum, promising data speeds up to **100 times** faster than current **5G** standards. Despite the long-term optimism, short-term selling in "Big Tech" has been driven by rotation into cyclical sectors. Investors are increasingly favoring value over growth, with the **Russell 1000 Value Index** outperforming its growth counterpart by over **1,100 basis points** year-to-date. Economic Indicators to Watch Labor market data continues to surprise, with the U.S. adding **130,000** jobs in January, bringing the unemployment rate down to **4.3%**. However, underlying trends suggest a cooling hiring environment, with average monthly gains for the year projected at **67,000**. Currency markets show a firming **US Dollar Index (DXY)**, which has exerted downward pressure on the Indian Rupee, now trading at approximately **90.74** per dollar. Global liquidity remains thin this week due to several Asian market closures for the Lunar New Year.

IndusInd Bank Stock Performance: Share Price Records Decline
Global Market Brief: February 17, 2026 Global financial markets are navigating a complex landscape defined by record-breaking technology demand and a shifting energy balance. While structural growth in the digital economy remains robust, traditional sectors are grappling with oversupply and evolving trade policies. Equities and Indices The **S&P BSE Sensex** is trading near **83,056**, while the **Nifty 50** hovers around **25,591**. Investor sentiment is currently bifurcated; technology and public sector banking stocks are showing resilience, while metal and private banking shares face modest pressure. In Asia, global hedge funds have recently deployed record capital into emerging markets, signaling a "risk-on" appetite for regional growth. However, domestic institutional activity remains the primary stabilizer, with net buying exceeding **1,666 crore** in recent sessions. The Semiconductor "Giga-Cycle" The semiconductor industry is projected to reach a historic **$1 trillion** in annual revenue in 2026. This surge is driven almost exclusively by the infrastructure requirements for artificial intelligence. Generative AI chips alone are expected to account for roughly **$500 billion**, or half of all global chip sales this year. Leading equipment providers have seen stock valuations surge over **11%** following earnings that validate this "AI Giga-Cycle." Despite this, analysts warn of a structural divergence as traditional PC and mobile chip demand remains comparatively soft. Energy and Commodities The oil market is currently a "tug-of-war" between geopolitical risk and a massive supply glut. **Brent Crude** is trading near **$67.72** per barrel, while **WTI** stands at **$62.86**. The International Energy Agency (IEA) has identified a projected surplus of nearly **4 million barrels per day** for 2026. This oversupply is fueled by record production from the "Americas Quintet"—the U.S., Canada, Brazil, Guyana, and Argentina. Guyana’s production specifically is nearing the **1 million barrel** milestone. In the metals space, **Gold** continues its historic ascent, with analysts forecasting a potential rise to **$5,600/oz** by year-end. Conversely, **Copper** is targeting **$13,500/t** as industrial demand for electrification remains high. Monetary Policy and Inflation Central banks are adopting a cautious "higher for longer" stance. The **Bank of England** recently maintained its rate at **3.75%**, while the **U.S. Federal Reserve** is expected to hold its target range between **3.5% and 3.75%** for the remainder of the year. Global inflation is cooling but remains sticky. In major economies, inflation is currently tracking near **3.4%**, still above the preferred **2%** target. This persistence is delaying the aggressive rate-cutting cycle many traders had anticipated for the first half of 2026. Global Trade Dynamics Trade maps are being redrawn by shifting tariff regimes. New U.S. trade measures have significantly altered price competitiveness: * **South African wine** is now **17%** more expensive relative to 2024 levels. * **Italian rice** imports have become **12%** cheaper. * **Global growth** for 2026 is officially projected at **3.3%**. These policy shifts are forcing a reallocation of market shares and influencing production and sourcing decisions across global value chains.

JSW Steel Share Price: Market Performance and Updates
Market Overview: February 2026 Global financial markets are entering the second half of February with a focus on shifting trade policies and a leadership transition at the U.S. Federal Reserve. While global growth remains steady, market performance is increasingly polarized between sectors benefiting from fiscal stimulus and those disrupted by rapid technological shifts. Equities and Indices U.S. equity futures show a cautious start following the Presidents' Day holiday. Contracts for the **S&P 500** slipped **0.3%**, while the **Nasdaq 100** fell **0.6%**. This slight retreat follows a period of "AI cannibalization" fears, where investors have begun selling off software and service companies vulnerable to automation. In contrast, the **BHP Group** saw shares surge as copper prices rose by more than **20%**, highlighting a rotation into materials and industrials. Global GDP growth is projected to reach **3.3%** for 2026, though regional performance remains uneven. The **Euro Stoxx 50** remains largely unchanged, reflecting stagnant growth expectations of **1.3%** for the Euro area. Monetary Policy and Rates The U.S. Federal Reserve maintained interest rates in the range of **3.5% to 3.75%** during its most recent meeting. With Chair Jerome Powell’s term ending in **May 2026**, markets are pricing in a period of policy uncertainty. While some analysts expect the Fed to remain on hold, others anticipate a **50 basis point** reduction later this year as inflation stabilizes near **2.7%**. In Asia, the **Bank of Japan** has raised its policy rate to **0.75%**, the highest level in three decades, yet the Yen remains under pressure at approximately **153.18** per dollar. Energy and Commodities Crude oil prices are holding steady despite geopolitical tensions in the Middle East. **Brent crude** is trading near **$67.70** per barrel, while **U.S. West Texas Intermediate (WTI)** hovers around **$62.80**. Market participants are monitoring OPEC+ for potential output increases scheduled for April, which may offset supply risks. Precious metals have faced recent selling pressure. **Gold** futures for February fell to **$4,969.90**, a **1.04%** decline, as traders weigh the impact of higher-for-longer interest rates. Despite this short-term dip, gold has maintained a significant **52-week gain** of over **60%**. Economic Indicators * **Global Inflation:** Projected to fall to **3.1%** in 2026. * **U.S. GDP:** Forecasted to grow at a resilient **2.6%**. * **Treasury Yields:** The **10-year yield** recently edged down to **4.03%**. * **Bitcoin:** Trading firmly near **$68,957**. The broader market sentiment remains focused on "fiscal impulses" rather than just interest rates. With major tax adjustments and infrastructure spending expected to boost disposable incomes, the narrative for 2026 continues to be one of sturdy growth masked by sector-specific volatility.

Hero MotoCorp Share Price Performance and Market Updates
Market Overview: February 17, 2026 Global financial markets are navigating a landscape defined by cooling inflation, shifting central bank timelines, and sector-specific rotations. Following a holiday-shortened week in the United States, equity futures show a cautious opening as investors digest the latest economic data and corporate earnings. Global Indices and Performance U.S. equity futures indicate a soft start for the session. **S&P 500** futures are down **0.3%**, while **Nasdaq 100** futures have slipped **0.6%**. The **Dow Jones** recently retreated from a record high of **50,512**, currently consolidating around the **49,600** level. In India, the **Nifty 50** remains resilient above **25,700**, while the **Sensex** has gained over **150 points** in morning trade. Technology stocks are leading the rally, with giants like **Infosys** rising **3%** following new strategic collaborations. Monetary Policy and Inflation The disinflation trend in the U.S. has intensified. Headline consumer inflation dropped to **2.4%**, the lowest level since early 2021. Despite this, a resilient labor market with unemployment at **4.3%** has pushed expectations for the next Federal Reserve rate cut from June to **July 2026**. The **Reserve Bank of India (RBI)** held its policy rate at **5.25%** in its February meeting. The central bank raised its **FY27 GDP** growth forecast to **6.9%**, citing a "Goldilocks period" of low inflation and strong domestic demand. In Europe, the **ECB** maintained rates at **2%** for the fifth consecutive meeting, remaining in a data-dependent wait-and-see mode. Commodities and Currencies Energy markets are facing downward pressure. **WTI Crude** futures are trading near **$62.50** per barrel amid concerns of a record supply glut forecasted for later this year. Conversely, natural gas saw a sharp **12%** surge in early February due to seasonal demand spikes. Precious metals continue to act as a volatility hedge. **Gold** is trading near **$5,030** per ounce, supported by a softer U.S. dollar. In retail markets, **24K Gold** is priced at approximately **₹15,408** per gram (excluding taxes), while **Silver** has seen a slight correction to **₹2,39,484** per kg. Sector Trends and Corporate Highlights * **Technology:** AI remains the primary driver of market divergence. While software and services face "cannibalization" risks, infrastructure providers continue to see strong inflows. * **Logistics:** The sector is seeing rapid consolidation. **Delhivery** reported expanded EBITDA margins of **7.4%** following recent acquisitions. * **Consumer Goods:** **Britannia** witnessed a **9.5%** revenue growth, benefiting from stable commodity prices and a recovery in rural demand. * **Banking:** Financials remain under pressure globally as yield curves shift, leading to selective positioning in mid-cap banks over large-cap lenders. The global growth outlook for **2026** stands at **3.3%**, with emerging markets expected to lead recovery efforts despite persistent trade policy uncertainties.

Sun Pharma Stock Price Performance Snapshot
Global Market Brief: February 17, 2026 Global equity markets continue to demonstrate resilience despite a shift in central bank behavior from active easing to a synchronized hold. Investors are currently navigating a landscape of high-level stability punctuated by rapid rotations across sectors. Equity Indices & Performance The **S&P 500** remains supported by the ongoing AI supercycle, with earnings growth in technology sectors projected between **13% and 15%** for the year. However, market concentration remains a primary risk as gains remain skewed toward a "winner-takes-all" dynamic. In India, the **Nifty 50** recently settled near the **25,682** mark, recovering from a volatile period that saw the index dip toward its **200-day moving average** of **25,293**. The **Sensex** is currently maintaining a base above **82,600**, though mid-cap and small-cap indices have faced steeper selling pressure of approximately **2%**. European markets, represented by the **STOXX 600**, are edging higher. Gains are largely driven by financial stocks as investors anticipate a cyclical upswing following the **100 basis point** rate cuts delivered by the ECB in late 2025. Monetary Policy & Inflation The **Reserve Bank of India (RBI)** maintained the repo rate at **5.25%** in its February session. This "wait-and-see" approach follows a cumulative **125 basis point** reduction in the previous cycle. Headline inflation for the fiscal year is projected at a benign **2.1%**, though Q1 2026-27 is expected to rise toward **4.0%**. The **US Federal Reserve** is similarly on hold, with the target range for the federal funds rate expected to settle between **3.0% and 3.5%** by year-end. Policymakers are monitoring a softening labor market and sticky core inflation, which has remained above the **2%** target for over four years. Commodities & Energy Gold has emerged as the standout performer of early 2026. Spot prices for **24K Fine Gold** are currently trading near **₹15,408 per gram** in retail markets, while COMEX futures are holding strength despite minor holiday liquidity dips. Some analysts have revised year-end targets to as high as **$5,600 per ounce** due to geopolitical risk. Oil markets are experiencing significant volatility. **Brent crude** is trading at **$67 per barrel** and **WTI** is near **$62 per barrel**. Prices are being bolstered by escalating tensions in the Middle East and new embargos, even as OPEC+ supply increases cap the immediate upside. Fixed Income & Bonds The US Treasury market is facing a steepening yield curve. The **10-year Treasury yield** remains hovered above **4.0%**, driven by concerns over future federal deficits and supply shocks. The latest **30-year Bond** auction on February 17 settled with a fixed rate of **4.750%**. In the corporate sector, new regulatory frameworks in India—such as the introduction of total return swaps—are expected to deepen the bond market. The RBI has also doubled the limit for collateral-free loans to MSEs to **₹20 lakh**, aiming to bolster credit flow amidst the neutral interest rate environment.

Asian Paints Share Price: Stock Crosses Key Moving Average
Gold Market Brief: February 17, 2026 The global gold market is entering a phase of high-stakes consolidation as of mid-February 2026. Spot prices are currently anchoring near the psychologically critical **$5,000 per ounce** threshold. While the metal recently touched highs of **$5,066**, it is facing immediate pressure today, slipping approximately **0.8%** to trade around **$4,948**. This minor retreat is largely attributed to a strengthening US Dollar Index, which has climbed to **97.15**. A robust dollar typically makes bullion more expensive for international buyers, prompting tactical profit-taking after the aggressive rallies seen in early 2026. Domestic Performance and Retail Rates In the Indian market, 24K gold is trading near **₹1,56,430 per 10 grams**, reflecting a slight decline of approximately **₹1,200** from the previous session. Despite this daily dip, the long-term trend remains firmly bullish. Current retail prices across major hubs: * **Chennai**: ₹1,57,520 (Premium due to local demand) * **Delhi/Mumbai**: ₹1,56,580 * **22K Jewelry Gold**: Approx. **₹14,339 per gram** Central Bank and Institutional Drivers A structural shift in global reserves continues to provide a massive "floor" for prices. Central banks are projected to purchase roughly **755 tonnes** of gold in 2026. While this is a normalization from the record-breaking **863 tonnes** seen in 2025, it remains nearly double the pre-2022 averages. Institutional interest is also accelerating, with gold-backed ETFs recording a staggering **$26 billion** in recent quarterly inflows. Analysts note that gold now accounts for a larger share of global central bank reserves than US Treasuries for the first time since 1996, signaling a deep-seated move toward diversification. Key Market Catalysts Several factors are contributing to the current volatility and the 2026 outlook: **Geopolitical Heat**: Ongoing US-Iran nuclear talks and the deployment of naval strike groups in the Middle East are maintaining a high safe-haven premium. **Macro Indicators**: Markets are awaiting the upcoming FOMC minutes and PCE inflation data. Current projections suggest the Federal Reserve may implement **75 bps** in rate cuts throughout 2026, which would traditionally lower the opportunity cost of holding non-yielding gold. **Supply Constraints**: Mining production is expected to decline by **2%** this year. With all-in sustaining costs (AISC) rising to **$1,600 per ounce**, the physical supply of gold is struggling to keep pace with institutional demand. Future Projections Major financial institutions have significantly upgraded their targets for the remainder of the year. Goldman Sachs and J.P. Morgan now forecast gold to push toward **$5,400–$5,800** by late 2026. The immediate technical outlook suggests that as long as gold holds above the **$4,950** support level, the bullish structure remains intact. A decisive break back above **$5,100** could trigger a new rally toward the **$6,000** long-term target anticipated by several bullion desks.

L&T share price: Larsen & Toubro records monthly gains
Global Market Brief: February 2026 Global equity markets are navigating a landscape defined by resilient growth and shifting monetary policies. As of mid-February 2026, the International Monetary Fund has revised global growth projections upward to **3.3%** for the year. This stability is largely supported by private sector adaptability and a significant front-loading of fiscal policies in major economies. In the United States, the investment climate is shaped by the "One Big Beautiful Bill Act," which provides tax reliefs and investment incentives. While the labor market has moderated, the S&P 500 continues to benefit from an AI-driven supercycle, with earnings growth estimated between **13% and 15%**. However, inflation remains a focus point, currently at **2.7%** and projected to reach **3.4%** in the first quarter before potentially easing toward the **2%** target by year-end. Central Bank Transitions A primary macro theme this month is the shift from the simultaneous easing of 2025 to a "simultaneous hold" at higher-than-pre-pandemic levels. Approximately **70%** of global central banks have paused their rate-cutting cycles. The Federal Reserve is expected to maintain a cautious path, with market analysts pricing in potential cuts in March and June to reach a terminal rate of **3% to 3.25%**. In Europe, headline inflation is expected to drop below the **2%** target early this year due to energy base effects, yet the European Central Bank is likely to keep policy restrictive to balance fiscal support measures. Commodity and Currency Trends Energy markets are currently on "tenterhooks" due to geopolitical friction. Brent crude is trading near **$68.65** per barrel, up over **1%** recently as naval exercises in the Persian Gulf and outages in North America tighten supply. Global oil demand is forecast to rise by **850,000** barrels per day in 2026, with non-OECD nations, particularly China, driving the entire increase. Precious metals show significant volatility. Gold recently fell below the **$5,000** per ounce mark to trade around **$4,989**, influenced by a firmer US dollar and shifting geopolitical risk assessments. Silver has entered an overbought phase, leading to increased investor caution. In the currency markets, the USD/INR pair is holding at **90.65**, while the Dollar Index (DXY) sits at **97.10**. Regional Performance and Emerging Markets India remains a standout growth engine with a projected GDP expansion of **7.3%**. The February 1 Union Budget has signaled aggressive reforms in semiconductors and a **100%** foreign direct investment allowance in the insurance sector. Domestic indices reflect this optimism, with the SENSEX recently closing higher at **83,277** and the NIFTY50 advancing to **25,683**. Emerging markets (EM) at large are seeing record ETF inflows of **$20.6 billion**. This surge is fueled by lower local interest rates and improved corporate governance. While China faces an overcapacity cycle in electric vehicles and power, its GDP forecast has been adjusted upward to **4.5%** for 2026, supported by strategic supply-side investments.

Tata Consumer Share Price: Current Market Performance and Trends
Global Market Brief: February 17, 2026 Global financial markets are navigating a landscape defined by cautious trading, geopolitical shifts, and thin volumes. With several major Asian centers closed for the Lunar New Year and U.S. markets returning from the Presidents’ Day break, investors are focusing on currency fluctuations and upcoming central bank cues. Equity Market Performance Major indices are showing a mixed to slightly negative bias as of early trade today. European benchmarks like the **DAX** and **CAC 40** are hovering near flat, recording marginal moves of **-0.02%** and **+0.06%** respectively. In India, the **SENSEX** declined by **220 points** (0.26%) to **83,056**, while the **Nifty 50** slipped below the **25,600** mark. This follows a strong previous session where the SENSEX had snapped a losing streak to gain **0.8%**. Japan’s **Nikkei 225** registered a more pronounced decline of **0.93%**, pressured by weaker domestic growth data. In contrast, Australia’s **S&P/ASX 200** managed a gain of **0.32%**, supported by stable regional sentiment. Commodities and Bullion Precious metals are facing significant downward pressure today. Spot gold has dropped roughly **1%**, slipping below the critical **$5,000** psychological barrier to trade near **$4,947** per ounce. Silver has seen a sharper retreat, falling nearly **2.7%** to approximately **$74.50** per ounce. This correction is largely attributed to a strengthening U.S. Dollar and profit-taking after the historic rallies seen throughout last year. Energy markets remain relatively stable but subdued. **Brent crude** is quoting near **$68.41** per barrel, down **0.25%**. Traders are monitoring the resumption of diplomatic talks in Geneva, which could influence supply expectations. Economic Indicators and Trends The **U.S. Dollar Index (DXY)** has edged up to **97.12**, acting as a headwind for dollar-denominated assets. Currency markets are also watching the Indian Rupee, which is hovering at **90.75** against the greenback. Global trade remains in a state of flux. Recent data highlights a widening trade deficit in several emerging economies, partly driven by the high cost of gold and silver imports. Growth projections for **2026** remain steady at approximately **3.3%** globally. However, risks persist regarding trade policy shifts and the potential for increased tariffs between major economic blocs. Key Events to Watch Market participants are shifting their focus to the release of the **U.S. Federal Reserve’s** January meeting minutes due tomorrow. This document is expected to provide clarity on the timing of anticipated interest rate cuts. Geopolitical developments in the Middle East and Eastern Europe continue to dictate risk appetite. Diplomatic negotiations scheduled for later today are being closely watched for any signs of de-escalation that could further ease safe-haven demand in the bullion sector.

Ashiana Housing Q3 Net Profit Rises to Rs 57 Crore
Ashiana Housing has delivered a standout financial performance for the third quarter of the 2025-26 fiscal year, characterized by an explosive surge in profitability and revenue. The company reported a consolidated net profit of 56.65 crore, a massive 420% increase compared to the 10.89 crore recorded in the same period last year. This rapid growth was fueled by a significant rise in total income, which climbed to 505.01 crore from 353.08 crore. On a standalone basis, revenue from operations jumped 198% to reach 342.58 crore. The primary driver behind these figures was an intensive execution cycle, with project handovers and deliveries more than doubling to 6.91 lakh square feet during the quarter. The company's stock responded aggressively to these results, surging over 16% in mid-February to hit an intraday high of 354.95. As of today, the stock continues to trade near the 334–348 range, maintaining a market capitalization of approximately 3,366 crore. Operationally, the firm has achieved a major milestone by crossing 2,000 crore in total booking value for the current financial year. A significant contributor to this was the successful conversion of units in the Ashiana Aaroham project in Gurugram, where 242 units were booked with a sale value of 767.23 crore in early February 2026. Strategic expansion remains focused on specialized niches. The company recently acquired 8.83 acres in Raigad for a new senior living project and launched new phases in Jamshedpur and Chennai. Its current portfolio is geographically diverse, with Gurugram accounting for 32% of saleable area, followed by Jaipur at 23%. The broader Indian real estate market is increasingly pivoting toward the senior living sector, which is projected to become a 36 billion dollar opportunity by 2050. Ashiana, ranked as India’s top senior living brand for nine consecutive years, is well-positioned to capitalize on this shift as demand for secure, service-led communities continues to rise. Efficiency metrics have also improved, with net profit margins expanding to 15.17% from 9.22% year-on-year. The balance sheet remains stable with a moderate debt-equity ratio of 0.38, supported by strong pre-tax operating cash flows of nearly 410 crore.

WeWork India Opens 1,200-Seat Co-working Space in Gurugram
WeWork India Management Ltd has officially expanded its presence in the National Capital Region with the opening of its 15th center in Gurugram. Located at Atrium Place in Udyog Vihar, the new facility spans 90,000 square feet and adds over 1,200 desks to the company’s portfolio. This launch brings WeWork India’s total operational footprint to 73 centers across 8 cities, covering 8.2 million square feet as of February 2026. The expansion comes as India solidifies its position as the largest flexible workspace market in the Asia-Pacific region. The sector’s stock is projected to surpass 100 million square feet by 2026, up from 79.7 million square feet in mid-2025. In the Delhi-NCR region alone, leasing activity reached historic highs in 2025, with Gurugram accounting for approximately 65% of the total absorption. Market data indicates a strong shift toward managed office models, which now account for 70% to 80% of post-pandemic demand. This trend is fueled by Global Capability Centers and international enterprises, which represented 72% of flex seat absorption over the past year. In Gurugram, Grade A office occupancy is expected to cross the 80% mark by March 2027, driven by a consistent 3% to 4% annual growth in rental rates. WeWork India’s latest facility is designed to meet this rising enterprise demand, featuring energy-efficient facades, CO2 sensor-based ventilation, and advanced air filtration. The center also includes dedicated collaboration zones and wellness rooms, catering to the hybrid work models now adopted by 36% of the Indian workforce. Financial performance in the sector remains robust. WeWork India has maintained its position as the largest operator by total revenue for three consecutive fiscal years, with shares recently trading at 567.70 INR. Across the top six Indian cities, the flexible workspace segment is growing at a compound annual rate of 21%, with total market value expected to exceed 600 billion INR by 2027. The broader commercial real estate landscape shows net absorption hitting a record 61 million square feet in 2025, a 25% year-on-year increase. With a significant portion of upcoming supply already pre-leased, the market remains tight, particularly in premium micro-markets like Udyog Vihar and Cyber City.

Indian Stock Market Update: Seven Major Stocks Move on Monday
Indian equity benchmarks successfully halted a multi-day losing streak on Monday, February 16, 2026. The recovery was driven by a powerful late-session rally, with the BSE Sensex surging **650.39 points** to close at **83,277.15**. Simultaneously, the NSE Nifty 50 climbed **211.65 points**, or **0.83%**, ending the day at **25,682.75**. Financial and energy stocks acted as the primary engines for this rebound. **HDFC Bank** and **Reliance Industries** provided significant heavy-lift support, while **Power Grid** led the Nifty gainers with a jump of over **4.5%**. The healthcare sector also remained a bright spot, with **Max Healthcare** and **Torrent Pharma** seeing active buying interest following a positive trend in recent earnings reports. In the broader market, performance was more fragmented. **Engineers India** saw a sharp rise of nearly **8.8%**, while **EaseMyTrip** (Easy Trip Planners) experienced a major breakout, surging more than **15%** to reach **7.61** per share. This surge came amid high trading volumes, signaling a reversal from its recent bearish phase. However, several high-profile companies faced intense selling pressure due to disappointing quarterly results. **FirstCry** (Brainbees Solutions) saw its stock price crash by **12%** to a record low after its net loss widened significantly to **38.4 crore** for the December quarter. **Ola Electric** also struggled, trading lower as investors reacted to a sharp decline in revenue despite some improvement in operational losses. **Inox Wind** witnessed volatility following its earnings release, joining the list of select stocks that underperformed the benchmarks. Additionally, the broader market indices—the Nifty Midcap and Smallcap—lagged behind the frontline gauges, ending with modest gains of **0.48%** and **0.11%** respectively. Sectoral trends remained mixed. While **PSU Banks** and **Realty** indices advanced by over **1.5%**, the **Auto** and **Media** sectors faced headwinds, closing the day in the red. The **India VIX**, a measure of market volatility, rose slightly by **0.1%**, reflecting a cautious yet optimistic undertone as the market prepares for upcoming economic data.