Bullish News
Collection
US Stocks Stable Following Softer-than-Expected Inflation Data
Market Brief: Friday, February 13, 2026 Wall Street’s primary benchmarks showed mixed to muted performance on Friday. Markets spent the session digesting critical inflation data and navigating a sharp rotation out of communication services and tech-heavy sectors. Inflation Cooling Below Estimates The January Consumer Price Index (CPI) report provided a boost to Federal Reserve rate-cut advocates. Headline inflation rose **0.2%** for the month, coming in slightly lower than the **0.3%** forecast. On an annual basis, the inflation rate slowed to **2.4%**, a notable deceleration from the **2.7%** seen in late 2025 and lower than the expected **2.5%**. Core CPI, which excludes volatile food and energy costs, remained stable at **2.5%** annually. This aligns with broad market expectations and reinforces the narrative that price pressures are gradually easing toward the central bank's long-term targets. Index Performance and Sector Weighs Despite the favorable inflation print, the major indexes struggled to maintain upward momentum. The **S&P 500** sat near **6,832.76**, while the **Dow Jones Industrial Average** hovered around the **49,451** mark. The **Nasdaq Composite** faced more significant pressure, recently sliding to **22,597.15**. The communication services sector was the primary laggard on Friday. Shares in this space, along with software and IT services, were hit by a wave of selling as investors reassessed growth forecasts. Industry heavyweights like **Cisco Systems** dropped as much as **10%** following disappointing forward guidance, while firms like **Shopify** also saw significant declines. Interest Rates and Fed Outlook The "softer-than-expected" data has kept the door open for Federal Reserve policy easing in 2026. The 10-year Treasury yield slipped to **4.075%** following the report, reflecting increased demand for bonds as traders bet on upcoming cuts. Market participants are currently pricing in a high probability of a rate reduction by June. There is significant focus on the impending leadership transition at the Fed, with current expectations leaning toward three potential quarter-point cuts over the next twelve months to bring the benchmark rate down from its current **3.5%–3.75%** range. Labor Market and Economic Context The focus on inflation follows a robust January jobs report that previously tempered expectations for aggressive easing. With unemployment holding steady at **4.3%** and nonfarm payrolls showing resilience, the Fed remains in a "data-dependent" mode, balancing a strong labor market against the steady cooling of consumer prices. Investors remain cautious regarding the software and services sectors, where concerns over structural shifts and earnings misses have overshadowed the broader positive macroeconomic data.

SEBI Approves BSE Focused Midcap Index Futures and Options Contracts
BSE has secured approval from the Securities and Exchange Board of India to introduce derivatives on its Focused Midcap Index. This new offering provides traders with concentrated exposure to 20 of the most liquid and prominent mid-sized companies in India. The launch features monthly futures and options contracts designed to comply with the latest single-expiry regulations. These rules streamline market operations by ensuring that index-specific derivatives expire on a unified schedule, enhancing liquidity and reducing complexity for retail and institutional participants. The BSE Focused Midcap Index currently tracks a basket of 20 high-performing stocks. As of February 12, 2026, the index stood at 24,223.32 points. Recent market data shows the index has maintained a cumulative market capitalization of approximately 17.12 trillion INR. Key sector weightages within the index highlight a diversified exposure. The Banking sector holds the largest share at 20.68%, followed by Capital Goods at 10.07% and Information Technology at 7.80%. Other significant contributors include Telecom at 7.30% and Industrial Products at 7.19%. Individual stock performance within the index has shown resilience despite broader market volatility. Recent top gainers among the constituents include Federal Bank, which rose by 0.70% to 289.10 INR, and Cummins India, gaining 0.51% to 4,452.10 INR. Other major players like AU Small Finance Bank and Dixon Technologies also remain core components of the index. On a broader scale, the Indian equity market has faced recent pressure. On February 13, 2026, the BSE Sensex dropped 1.25% to 82,626 points, while the Nifty 50 fell 1.30% to 25,471. The mid-cap segment, while under pressure with a 1.8% decline in the broader Nifty Midcap index, continues to be a focal point for investors seeking higher growth potential compared to large-cap stocks. The introduction of these derivatives is expected to provide a specialized hedging tool. By focusing on only 20 stocks rather than a broader mid-cap index, the product offers a sharper instrument for managing risk or gaining leveraged exposure to the mid-cap growth story. Liquidity in the mid-cap space remains a key theme as institutional flows shift. While the broader BSE MidCap Index closed near 49,789 points recently, the "Focused" version aims to capture the volatility and returns of the most active names in the segment. Traders can now utilize these monthly contracts to navigate a market environment marked by sector rotation and shifting economic indicators. The move reinforces BSE's strategy to expand its derivatives suite and cater to the evolving needs of the Indian trading community.

NCDEX Appoints TCS as Technology Partner for Equity and Derivatives Market Launch
The National Commodity & Derivatives Exchange (NCDEX) has officially partnered with Tata Consultancy Services (TCS) in a landmark 10-year technology agreement. This strategic move aims to transform the exchange from a commodity-heavy platform into a diversified financial hub, facilitating its long-awaited entry into the equity and equity derivatives sectors. As of February 13, 2026, the market environment for this transition is marked by intensified regulatory scrutiny and shifting economic indicators. While NCDEX is preparing its infrastructure, the Securities and Exchange Board of India (SEBI) has recently signaled a cautious approach. The regulator has directed new entrants to focus on establishing a liquid cash equity market for at least six months before launching high-risk derivatives products. To support this expansion, NCDEX successfully raised 770 crore INR from 61 domestic and international investors. These funds are powering the deployment of TCS BaNCS and Quartz solutions—a high-performance, low-latency technology stack designed to handle complex multi-asset trading. The infrastructure is built to cater to the "Bharat First" philosophy, targeting rural and Tier 2 investors with innovative products like 250 INR SIPs. In the broader market today, volatility remains high. The Nifty 50 has recently faced pressure, settling below the 25,500 mark. Meanwhile, the commodity segment continues to show resilience. Agricultural indices show steady performance in core contracts: Castor seed is trading near 6,435 INR per quintal, while Turmeric has stabilized around 14,916 INR. Economic fundamentals provide a supportive backdrop for the exchange’s growth. India’s GDP growth forecast for FY26 has been revised upward to 7.4%, and the RBI recently maintained the repo rate at 5.25% with a neutral stance. These factors, combined with a 9.4% rise in castor seed sowing and robust export demand for agri-commodities, reinforce NCDEX's position as it moves toward a multi-asset future. The 10-year pact with TCS ensures that NCDEX will operate on a scalable, enterprise-grade surveillance and trading platform. This technology overhaul is essential for meeting SEBI’s latest mandates, which require exchanges to demonstrate superior technical governance and price discovery mechanisms before broadening their retail derivative offerings. By leveraging a workforce expansion of 150 new professionals and high-frequency trading expertise from global partners, the exchange is positioning itself to bridge the gap between rural agricultural markets and mainstream capital market investments.

Morgan Stanley Considers $500 Million India Fund Amid Asset Realignment
Morgan Stanley Investment Management is actively sounding out investors to transition a portfolio of eight Indian healthcare assets into a specialized continuation vehicle. The firm is targeting a fundraise of **$500 million** for this new strategy, reflecting a broader shift toward secondary-market solutions to manage mature private equity holdings. Key assets identified for the transfer include Omega Hospitals and RG Scientific Enterprises. RG Scientific stands as India's largest urology-focused hospital chain, currently operating **14 hospitals** with more than **500 beds** across seven major cities. These assets are being positioned at a time when the Indian hospital sector is maintaining a robust growth trajectory, with revenues projected to climb **16% to 18%** in the 2026 financial year. The move comes as the Indian healthcare market experiences a surge in transaction intensity. Secondary market exits in India reached approximately **$12.9 billion** in the previous year, accounting for nearly **48%** of all private equity exit value. This trend is supported by high liquidity and a maturing investor base that increasingly prefers specialized healthcare platforms. Operational metrics within the sector remain strong. Listed hospital groups are reporting occupancy levels between **62% and 64%**, while Average Revenue Per Occupied Bed (ARPOB) is expected to expand by **6% to 8%** this year. These healthy margins, currently hovering around **23.7%**, provide a stable backdrop for Morgan Stanley's transition of these assets into a long-term vehicle. Investor interest is further fueled by structural tailwinds, including a **12.6% increase** in government healthcare budget allocations and a rapidly growing medical tourism market, which was valued at **$8.7 billion** in 2025. With private equity deals in the hospital space jumping **166%** in recent quarters, the continuation fund model allows managers to retain high-performing assets while providing liquidity to existing limited partners. This strategic pivot underscores a wider trend in India's **$193 billion** hospital market, where institutional players are moving away from simple growth capital toward controlling stakes and portfolio consolidation to capture long-term value in a consolidating landscape. [Overview of Morgan Stanley's healthcare investment strategy](https://www.youtube.com/watch?v=3Hs9D_A38ks) This video provides additional context on the budget initiatives and infrastructure trends that are currently shaping the investment climate for Indian healthcare assets. http://googleusercontent.com/youtube_content/0

SEBI Approves IPO Applications for Five Companies Including Duroflex and Premier Industrial Corporation
The Indian primary market is witnessing a significant surge in activity as the Securities and Exchange Board of India (SEBI) grants approval for a diverse range of Initial Public Offerings (IPOs). This momentum follows a robust performance in the current fiscal cycle, where listing gains have averaged approximately 34.28%, signaling sustained investor appetite despite global volatility. Recent approvals for Premier Industrial Corporation, Duroflex Limited, Virupaksha Organics, Hexagon Nutrition, and Om Power Transmission highlight a strategic focus on industrial expansion and the scaling of specialized sectors. These upcoming issues, featuring a mix of fresh equity and secondary sales, are poised to tap into a market where capital raised by Indian firms has seen a nearly 95% year-on-year increase. **Premier Industrial Corporation** This welding consumables specialist is entering the market with an offer of 2.79 crore equity shares. The issue includes a fresh issue of 2.25 crore shares designed to capitalize on an Indian welding consumables market projected to reach $2.1 billion by 2033. The company’s financial profile is strong, reporting a 59.31% CAGR in profit after tax between 2023 and 2025, with a Return on Equity (RoE) of 29.73%. **Duroflex Limited** A leader in the sleep solutions industry, Duroflex is set to raise ₹183.60 crore through fresh equity, alongside an offer for sale of 2.26 crore shares. Holding an 8% share of the branded mattress market, the company plans to utilize proceeds to expand its "COCO" retail stores and strengthen its manufacturing footprint across its seven existing facilities. **Virupaksha Organics** Positioned within the pharmaceutical sector, this API manufacturer has filed for a ₹740 crore issue. The capital is earmarked for a new manufacturing unit in Andhra Pradesh to meet global demand. The company reported revenues of ₹5,471.93 million in fiscal 2025, with exports contributing over 51% of its total operations, reflecting a significant international footprint. **Hexagon Nutrition** This research-oriented nutrition player is pursuing an entirely secondary offering (OFS) of 3.09 crore shares. Hexagon is looking to leverage its position in a clinical nutrition sector that is forecast to double to $4.3 billion by 2033. The company maintained a 12.33% EBITDA margin in fiscal 2025 and aims to enhance its corporate brand through this listing. **Om Power Transmission** Reflecting the growth in India’s energy infrastructure, this EPC player is launching a 1.00 crore share IPO. The company holds an unexecuted order book of ₹776.19 crore as of late 2025. Its revenue has grown at a CAGR of 52.45% over the last three years, supported by a massive 41.76% Return on Capital Employed (RoCE). The broader economic backdrop remains supportive, with India’s GDP growth projected at 6.5% for 2025. While market sentiment has shown occasional caution due to geopolitical shifts, the steady influx of retail capital via SIPs and the resilience of industrial sectors continue to provide a solid foundation for these upcoming debuts.
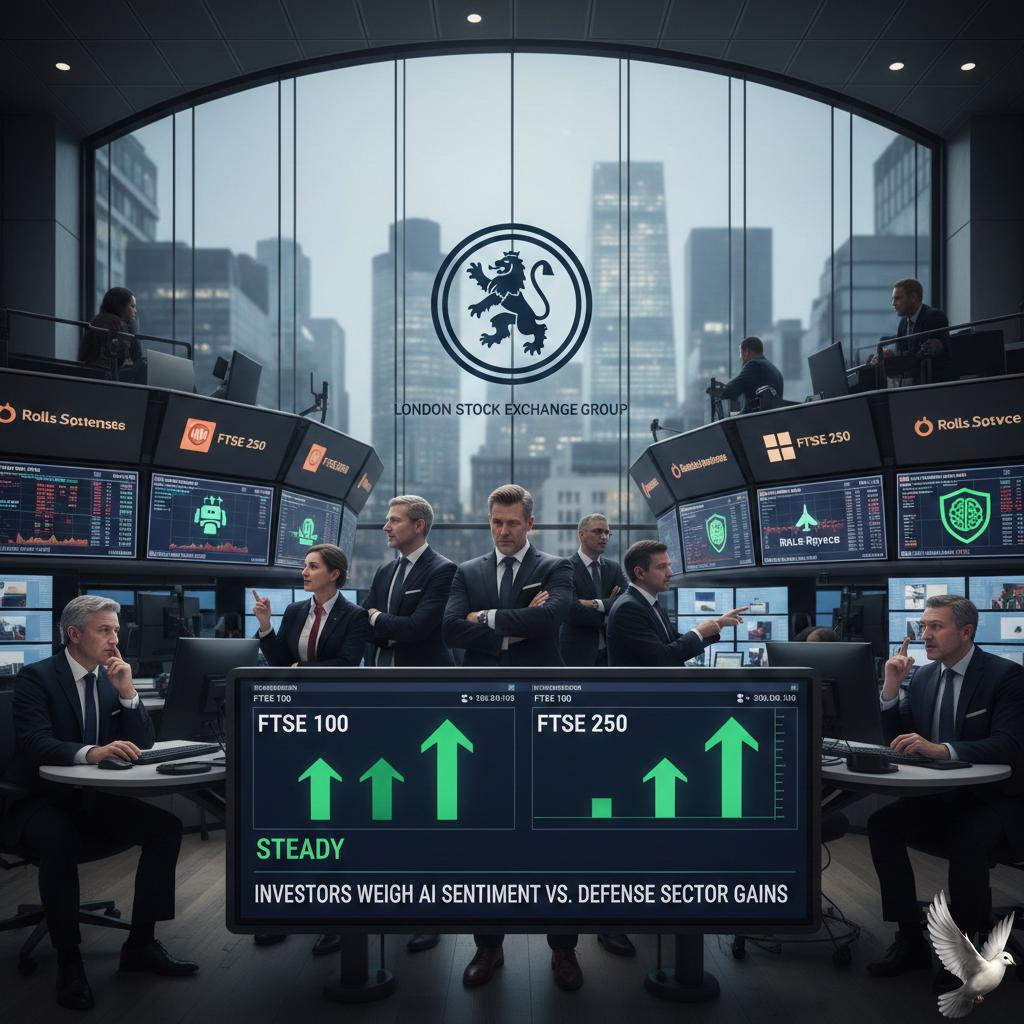
FTSE 100 and 250 Steady as Investors Weigh AI Sentiment Against Defense Sector Gains
Market Brief: London Indices Navigate AI Volatility and Defense Pledges The London stock market maintained a cautious stance on Friday, February 13, 2026. Global sentiment remained fragile following a week of disruption concerns linked to rapid advancements in artificial intelligence. The **FTSE 100** edged down **0.2%** to **10,385.73** by midday. Despite the daily dip, the blue-chip index is positioned for a marginal weekly gain after rebounding from a sharper **0.7%** decline in the previous session. The mid-cap **FTSE 250** followed a similar trajectory, sliding **0.1%** to **23,280.53**. Investors are currently balancing domestic earnings success against upcoming United States inflation data, which historically dictates broader market direction. Sector Performance and AI Jitters Concerns over AI-driven disruption to traditional business models have triggered a volatile week for the UK’s technology and financial sectors. Life insurers and banks saw weekly losses exceeding **4%** at various points. However, a selective rebound occurred on Friday. **RELX** led the recovery with a gain of **5.4%**, while credit specialist **Experian** rose **4.3%**. Banking performance was mixed. **NatWest** reported a significant **24%** jump in annual profit and announced a **£750 million** share buyback. Despite these strong figures, its shares fell **3.3%** as the market had largely priced in the optimistic outlook. Defense Sector Gains The aerospace and defense sector emerged as a primary outlier, gaining **2%** on Friday. This upward movement is driven by expectations of deeper European military cooperation. Defense Secretary John Healey confirmed that allies have pledged up to **$35 billion** in new military aid for Ukraine. This announcement, coupled with Prime Minister Keir Starmer’s expected push for a multinational defense initiative at the Munich Security Conference, provided a strong tailwind. Key players saw notable movement: * **Rolls-Royce** climbed **2.0%** * **BAE Systems** rose **1.3%** * **Babcock International** added **0.2%** Economic Indicators and Monetary Outlook The British economy remains in a low-growth phase, with fourth-quarter GDP expanding by just **0.1%**. This matches the pace of the previous quarter and reflects ongoing caution following recent budget adjustments. On the monetary front, the Bank of England recently held the base interest rate at **3.75%** in a narrow **5-4** vote. Chief Economist Huw Pill noted today that underlying inflation is settling at approximately **2.5%**, slightly above the **2.0%** target. Market participants are currently pricing in a **63.4%** probability of a rate cut later this year, though the timing remains sensitive to upcoming services and wage data. Commodity and Currency Pressure The mining sector weighed on the FTSE 100 as copper prices weakened. Major miners **Rio Tinto** and **Antofagasta** both saw declines of over **2%**. In currency markets, the British pound softened to **$1.3606** against the US dollar. While a weaker pound can boost the relative value of international earnings for the FTSE 100, it also signals a cautious outlook on UK growth compared to global peers.

Engineers India Q3 Net Profit Rises to Rs 302 Crore
State-owned Engineers India Ltd (EIL) has delivered a landmark financial performance for the third quarter ended December 31, 2025. The company reported a consolidated net profit of 347.17 crore, marking a 219.3% surge compared to the 108.73 crore earned in the same period last year. Standalone net profit saw an even sharper climb, jumping over 3-fold to 302 crore. This exceptional growth was primarily fueled by the mechanical completion of major turnkey projects and successful price adjustments. Revenue from operations grew 59% year-on-year to 1,194 crore. The turnkey segment was a standout performer, with its revenue doubling during the quarter. Meanwhile, the high-margin consultancy business remains a stable pillar, contributing 473.53 crore to the top line. The company’s order book has reached a record high of approximately 15,670 crore. This includes a massive $360 million contract from Nigeria’s Dangote Group for refinery expansion—the largest overseas order in EIL’s history. International business now accounts for 65% of all new order inflows. Following these results, EIL shares surged nearly 16% on the National Stock Exchange today, hitting an intraday high of 209.71. The stock has gained 21% over the past week, supported by strong investor confidence and a consensus "Buy" rating from market analysts. The operational efficiency of the firm improved significantly, with EBITDA margins expanding to 29.10% from 12.80% a year ago. Operating profit, or EBITDA, skyrocketed 259% to reach 352 crore for the quarter. EIL is increasingly pivoting toward high-growth sectors such as green hydrogen, biofuels, and refinery upgrades. Management has signaled a revenue growth guidance of 15% to 20% for the full 2026 fiscal year, supported by a diverse project pipeline. Strategic investments also underscore long-term growth, including a 26% stake in the 6,388 crore Ramagundam fertilizer project and a minority stake in the Numaligarh Refinery. These moves position the Navratna PSU as a central player in India’s expanding energy and infrastructure landscape.

NAREDCO Proposes Incentives for Affordable and Rental Housing
The Indian real estate sector is witnessing a strategic push for policy overhaul as it enters February 2026. Industry body **NAREDCO** has formally urged the government to implement structural changes to sustain the **Housing for All** mission, citing a sharp decline in affordable housing's market share from **38%** in 2019 to approximately **18%** today. Redefining Affordability A primary demand centers on the price cap for affordable housing. The industry is calling for the current limit of **₹45 lakh** to be raised to **₹75–80 lakh**. This shift reflects the reality of rising land and construction costs in Tier-1 cities, where the existing cap has rendered many projects unviable for developers. Tax Relief and Incentives To stimulate buyer demand, there is a strong recommendation to increase the home loan interest deduction limit under Section 24(b). The proposal seeks to raise this cap from **₹2 lakh** to **₹5 lakh**. Additionally, developers are pushing for **Industry Status**, which would allow access to cheaper institutional financing and lower overall project costs. The Rental Housing Pivot With rental yields in India currently stagnant between **1% and 3%**, private investment in rental stock remains low. NAREDCO and other bodies are advocating for a **National Rental Housing Mission**. This would include targeted tax incentives for developers and potential tax relief for tenants to formalize the segment and support urban workforce mobility. Market Performance and Projections The sector remains a massive economic pillar, projected to reach a market size of **$1 trillion by 2030**. * **Residential Growth:** Expected to expand by **8–9%** in 2026. * **Price Trends:** Capital values are expected to climb by **3–5%** this year. * **Government Outlay:** The Budget 2026-27 has significantly increased PMAY-Urban funding to **₹18,625 crore**, up from **₹7,500 crore** in the previous year. Emerging Trends While metro hubs like Bengaluru and Hyderabad continue to lead, **Tier-2 and Tier-3 cities** are gaining traction due to improved infrastructure. Furthermore, **NRI investment** is expected to contribute a record **18–20%** of the total market share by the end of 2026, driven by a preference for stable, long-term asset appreciation.

US existing home sales reached a 25-month low in January
U.S. existing home sales experienced a significant contraction in January 2026, falling 8.4% to a seasonally adjusted annual rate of 3.91 million units. This represents the lowest sales pace in over two years and the sharpest monthly decline since early 2022. The retreat was widespread, with all four major U.S. regions posting monthly and annual decreases. The West saw the most dramatic drop at 10.3%, while the South declined by 9%. Market analysts point to a combination of severe winter weather and a persistent shortage of available properties as the primary drivers behind the slowdown. Despite the cooling in transaction volume, home prices continued their upward trajectory. The national median existing-home price reached $396,800 in January, marking a 0.9% increase from the previous year. This establishes a new record high for the month of January and represents the 31st consecutive month of year-over-year price gains. Inventory levels remain a critical constraint on the market. Total housing inventory stood at 1.22 million units at the end of January, a slight 0.8% decrease from December. While inventory is up 3.4% compared to one year ago, the current 3.7-month supply remains well below the 5 to 6 months typically required for a balanced market. Mortgage rates have offered some relief, with the 30-year fixed-rate average slipping to 6.09% in mid-February. This is a notable improvement from the 6.87% seen at the same time last year. Although rates are at three-year lows, the "lock-in effect" persists as many homeowners remain reluctant to trade in older, lower-rate mortgages for current market terms. Affordability metrics are showing early signs of recovery. The Housing Affordability Index rose to 116.5 in January, its highest level since early 2022. This improvement is largely driven by steady wage growth and the recent moderation in borrowing costs, though the lack of entry-level supply continues to challenge first-time buyers. First-time buyers accounted for 31% of all sales in January, down from the historical average of 40%. Meanwhile, all-cash sales remained high at 27% of transactions, and individual investors or second-home buyers made up 16% of the market. Distressed sales remained minimal, accounting for only 2% of total volume. The market outlook for the remainder of 2026 suggests a slow normalization. While sales have started the year on a sluggish note, the combination of rising incomes and stable mortgage rates is expected to gradually draw more participants into the market as the spring buying season approaches.

US Market Awaits Inflation Data with Index Futures Steady
Market Outlook: Friday, February 13, 2026 U.S. stock index futures remained subdued on Friday morning as Wall Street braced for critical inflation data. After a turbulent Thursday that wiped out year-to-date gains for the **S&P 500**, investors are showing extreme caution. The focus is squarely on the January Consumer Price Index (CPI) report. Analysts expect the annual inflation rate to ease to **2.5%**, down from **2.7%** in December. A reading in line with or lower than this figure could stabilize the market, while a "hotter" print would likely crush remaining hopes for a spring interest rate cut. Tech and AI Under Pressure The "AI scare trade" continues to dominate headlines. Sentiment has shifted from pure optimism to deep concern over disruption. Investors are now punishing companies they fear will lose out to rapidly advancing automated tools. * **Nasdaq 100** futures slipped **0.04%** following a **2%** plunge on Thursday. * **S&P 500** futures edged down **0.09%** to start the day. * **Dow Jones** futures fell **103 points**, or **0.21%**, signaling a defensive opening. Despite the broader gloom, **Applied Materials** jumped **11.5%** in premarket trading. The chipmaker provided a strong forecast, proving that hardware providers still benefit from the massive **$650 billion** in cumulative AI spending projected for the "Magnificent Seven" this year. Federal Reserve and Interest Rates Market expectations for a Federal Reserve pivot have been pushed back significantly. Following a robust jobs report earlier this week, the likelihood of a rate cut before June has dwindled. The Fed currently maintains a target range of **3.50% to 3.75%**. Most traders are now pricing in a **70%** chance of a cut in June, with a total of only **60 basis points** of easing expected for the entirety of 2026. Sector Highlights The selloff is rippling beyond software into logistics and financial services. Trucking and brokerage stocks have seen sharp declines as markets reassess how automation will impact traditional labor-heavy business models. Meanwhile, safe-haven demand has provided slight support to the **U.S. Dollar Index**, which rose to **97.07**. In the bond market, the **10-year Treasury yield** climbed to **4.12%** as investors weighed persistent economic strength against the threat of sticky inflation. The day's price action will likely be determined by the **8:30 a.m. ET** inflation release. Until then, trading remains thin and defensive.

Market Movers: Friday's Top Stocks Including TCS, SpiceJet, and Bajaj Finance
Market performance on Friday, February 13, 2026, was defined by intense selling pressure as benchmark indices tumbled over **1%**. The BSE Sensex crashed **1,048.16 points** to close at **82,626.76**, while the NSE Nifty 50 shed **336.10 points** to settle at **25,471.10**. Investors lost approximately **₹7 lakh crore** in a single session as market capitalization for BSE-listed firms dropped to **₹465 lakh crore**. IT Sector Under Siege The IT sector faced a brutal rout, with the Nifty IT index plunging **8%** over the week—its steepest weekly decline since April 2025. **TCS** hit a fresh 52-week low, sliding **5.07%** to **₹2,610.60**. Its market valuation dropped below the **₹10 lakh crore** mark for the first time in years. **Wipro** followed suit, falling **4.70%** to a 52-week low of **₹219.00**, while **Coforge** plummeted **5.14%** to **₹1,348** amid high intraday volatility. Consumer and Metal Stress **Hindustan Unilever (HUL)** shares dropped **4.34%** to **₹2,351.40**. Despite a headline net profit surge to **₹6,603 crore** due to an ice cream business demerger, core profits from continuing operations actually fell **30%**, triggering a sharp selloff. **Hindalco** was among the top Nifty losers, tanking **6.08%** to **₹926.65**. The company reported a **45%** year-on-year drop in consolidated net profit, which stood at **₹2,049 crore**, largely due to fire-related disruptions at its Oswego plant. Aviation and Energy Volatility **SpiceJet** faced extreme distress, crashing over **15%** on the BSE to hit a new 52-week low of **₹18.93**. The airline has now accumulated losses of over **14%** in just three trading sessions. **Engineers India**, however, bucked the trend. The stock surged **11%** following a stellar Q3 report where net profit soared **219%** to **₹347.2 crore**, making it one of the most active counters by volume. Financial Resilience **Bajaj Finance** emerged as a rare bright spot, gaining **3.09%** to close at **₹1,010.30**. The stock has rallied **8%** in February, supported by strong Net Interest Income growth of **21%**, totaling **₹11,318 crore** for the quarter, which helped offset higher provisions. The India VIX, a measure of market fear, jumped over **13%**, signaling heightened anxiety as the Nifty breached key support levels at **25,500**.

Senco Gold Projects ₹8,000 Crore FY Revenue Following Q3 Growth Driven by Gold Prices
Senco Gold & Diamonds has delivered a historic performance for the third quarter of FY26, reporting a 50% year-on-year surge in consolidated revenue to reach ₹3,071 crore. This growth was primarily fueled by an exceptional 39% rise in same-store sales and a 689% jump in profit after tax, which climbed to ₹264 crore. A primary driver of these figures is the unprecedented appreciation of gold prices, which rose roughly 65% over the past year. By the end of Q3, domestic gold rates hit record highs of approximately ₹1,40,000 per 10 grams. While the price rally boosted the value of sales, it impacted consumption volumes, which saw a 3% decline during the quarter. To navigate this high-price environment, the company shifted its focus toward lightweight and budget-friendly jewelry designs. This strategic pivot, combined with a robust 36% growth in the diamond segment, helped sustain consumer interest during the peak wedding and festive seasons. Notably, the month of October alone saw record sales of ₹1,716 crore, driven by strong Dhanteras demand. The company's expansion beyond its traditional Eastern India stronghold is showing significant results. Non-East revenue has now crossed the ₹1,100 crore mark, underscoring a successful national footprint. The retail network has grown to 196 showrooms, with management on track to reach a 200-store milestone in the near future. Financially, the company remains in a strong position with a 13.2% EBITDA margin in Q3. For the first nine months of FY26, total revenue reached ₹6,433 crore, a 30% increase over the previous year. To reward shareholders, the board has declared an interim dividend of ₹0.75 per equity share. Looking ahead, management has maintained a confident outlook for the remainder of the fiscal year. The company is targeting an annual revenue of ₹8,000 crore, supported by an expected 25% topline growth in the final quarter. Strategic moves, including the acquisition of a 68% stake in August Jewellery (Melorra), are expected to further bolster its digital and omni-channel presence. While overall gold demand in India is projected to be moderate due to price volatility, Senco’s focus on its "Hyper-local" strategy and a rising share of franchise revenue—currently at 33%—provides a stable foundation for its 18-20% long-term annual growth target.

HUL Demerged Entity Receives Trading Approval; Kwality Wall's Listing Date Announced
Hindustan Unilever Limited (HUL) has received final listing and trading approvals from the BSE and National Stock Exchange for its demerged ice cream entity, Kwality Wall’s (India) Limited. The new stock is scheduled to debut on the exchanges on February 16, 2026. This listing completes a structural separation that began in late 2025. Shareholders who held HUL stock as of the December 5 record date were allotted shares in the new company at a 1:1 ratio. This move establishes India’s first pure-play listed ice cream firm. The demerger has already made a significant impact on HUL’s financial statements. In its latest Q3 FY26 results, HUL reported a 121% surge in consolidated net profit to **6,603 crore**. This jump was primarily driven by a one-time exceptional gain of **4,611 crore** recognized from the transfer of the ice cream business at fair value. Excluding this accounting gain, HUL's underlying profit grew by a modest 1% to **2,562 crore**. The company's revenue for the quarter stood at **16,441 crore**, representing a 6% year-on-year increase. Underlying volume growth was recorded at 4%. The standalone ice cream business, which includes brands like Magnum and Cornetto, currently operates with a massive cold-chain network of over 2 lakh cabinets. Following the listing, The Magnum Ice Cream Company will hold a 61.9% stake in the entity, providing it with global strategic support. Analysts have highlighted a mixed outlook for the new stock. While the sector benefits from a recent GST cut from 18% to 5%, the business remains highly seasonal. Kwality Wall’s reported an EBITDA margin of 7.1% in FY25, significantly lower than HUL’s core FMCG margins, which maintained a steady 23.3% in the recent quarter. Market valuations for the new shares are estimated by some brokerages in the range of **50 to 55 per share**. This reflects a valuation of roughly 5x enterprise value to sales, a discount compared to HUL’s broader 9x multiple, accounting for the capital-intensive nature of the frozen goods segment. For HUL, the separation allows for a sharper focus on its high-growth Beauty, Wellbeing, and Home Care segments. The company continues to pivot its portfolio, recently gaining full ownership of the nutrition brand OZiva while exiting underperforming joint ventures. HUL shares ended the most recent trading session at **2,305.00**, down 2.22%, as the market absorbed the latest earnings data and the final timeline for the spin-off. Investors are now focused on the February 16 debut to gauge the independent market value of the ice cream vertical.

Ola Electric Q3 Results: Net Loss Narrows to Rs 487 Crore Amid 55% Revenue Decline
Ola Electric has reported its third-quarter results for the 2024-25 fiscal year, revealing a complex financial picture characterized by widening losses despite maintaining a strong grip on the market. The company’s consolidated net loss grew to **564 crore**, a significant 50% increase compared to the **376 crore** loss reported in the same period last year. Revenue from operations for the quarter stood at **1,045 crore**, marking a 19.36% year-on-year decline from **1,296 crore**. This drop reflects the intensifying competition in the electric two-wheeler space and a shift in consumer demand dynamics. Despite these headwinds, the company maintained a leading **25.5% market share** in the segment, delivering **84,029 units** during the October-December period. Operating expenses remained a hurdle as the total burn reached **1,505 crore**. Key cost drivers included materials procurement, which accounted for over half of total costs, alongside significant investments in marketing and the expansion of the "HyperService" network. The company is pivoting toward a direct-to-customer model with over **4,000 stores** now operating across India to improve after-sales reliability. Market performance for early 2025 shows signs of a volume recovery. In February 2025, Ola Electric reported selling over **25,000 units**, capturing roughly **28% of the market**. However, this figure faced scrutiny due to a discrepancy with Vahan registration data, which the company attributed to a temporary backlog caused by transitioning to new registration vendors. The product pipeline is a primary focus for future growth. Ola has recently launched its Gen 3 scooter range and made a high-profile entry into the motorcycle market with the Roadster series. The company’s shift toward using its indigenously developed **4680 Bharat Cell** technology is expected to drive down battery costs and improve gross margins, which are targeted to reach **26%** in the coming months. On the stock market, Ola Electric shares have faced volatility, recently trading near **31.28** on the NSE as of mid-February 2026. This is significantly below the IPO price of **76** and the all-time high of **157**, reflecting investor caution regarding the path to profitability and ongoing regulatory observations from SEBI concerning disclosure norms. The broader EV landscape in India is maturing, with legacy players like TVS and Bajaj Auto aggressively closing the gap. While Ola remains the volume leader, the company is now focused on operational leverage and cost optimization to navigate a more crowded and price-sensitive market environment.

Indian Rupee Ends Flat Amid Slight Downward Pressure
The Indian rupee maintained a steady stance on Friday, February 13, 2026, as the **USD/INR** exchange rate hovered near **90.65**. The currency faced a tug-of-war between high interbank dollar demand and strategic defense from the Reserve Bank of India. Market participants noted that the central bank likely utilized state-run banks to sell dollars, preventing the rupee from slipping past the psychological **90.75** level. Equity Market Turbulence Domestic sentiment was dampened by a significant sell-off in the technology sector. The **BSE Sensex** crashed by **883 points**, or **1.05%**, to settle near **82,791**. The **NSE Nifty 50** followed suit, dropping **262 points** to **25,544**. Heavy selling was triggered by the "Anthropic shock," as new developments in artificial intelligence raised concerns over the long-term viability of traditional IT outsourcing models. Major laggards included industry heavyweights like Infosys and TCS, which bore the brunt of the **5.5%** slide in the IT index. Economic Indicators and Inflation Fresh data released this week showed India’s retail inflation rising to **2.75%** in January 2026. This figure, calculated under the new Consumer Price Index (CPI) series with a **2024 base year**, remains well within the central bank’s target range of **2% to 4%**. Despite this uptick, the Reserve Bank of India recently maintained the repo rate at **5.25%**, signaling a neutral stance for the foreseeable future. Commodities and Global Context Gold prices saw a modest recovery of **0.97%**, trading near **₹154,324** per 10 grams on the MCX. The metal's volatility is being driven by shifting expectations regarding US Federal Reserve interest rates and safe-haven demand stemming from US-Iran geopolitical tensions. Meanwhile, global oil prices remained relatively soft, with **Brent crude** trading at **$67.41** per barrel, providing a slight cushion against India's widening trade deficit. Outlook Traders expect the rupee to remain range-bound between **90.40** and **90.80** in the near term. Stabilizing factors include a revival in Foreign Institutional Investor (FII) inflows, which recently turned net positive after a period of sustained selling. However, continued volatility in global tech stocks and the evolving AI landscape are expected to keep pressure on local equity indices and the currency's immediate upside.
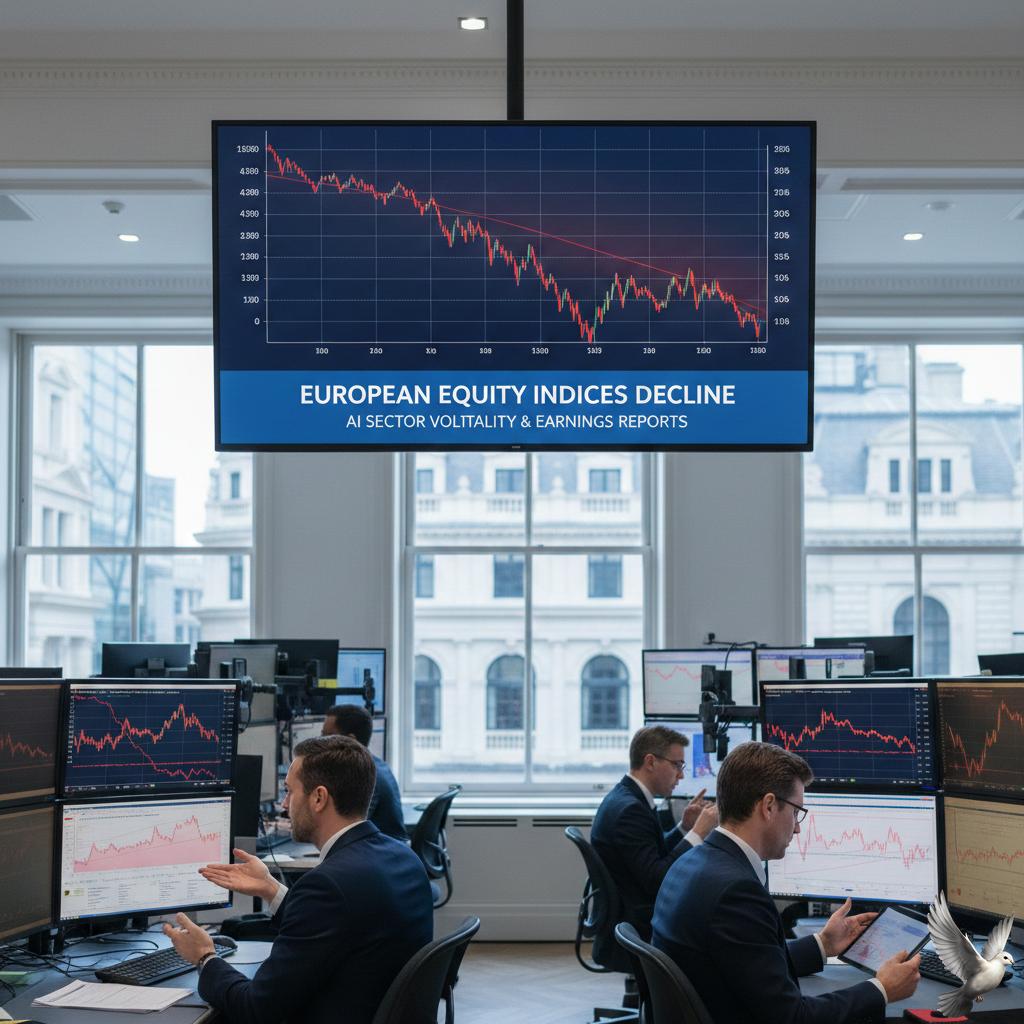
European Equity Indices Decline Amid AI Sector Volatility and Corporate Earnings Reports
European markets are navigating a period of heightened volatility today, February 13, 2026, as investors weigh the rapid pace of artificial intelligence integration against a complex backdrop of corporate earnings and shifting economic indicators. The pan-European STOXX 600 index currently sits at 618.75 points, marking a marginal recovery from earlier session lows of 616.58. Despite the slight uptick, the index remains on track to close the week virtually flat. Major regional benchmarks show a divided performance: Germany’s DAX remains steady with a positive bias, and the UK’s FTSE 100 has edged up 0.1% to 10,393 points. Conversely, France’s CAC 40 has retreated 0.3%. Investor sentiment is heavily influenced by "SaaSpocalypse" concerns—a term coined by analysts following the launch of advanced AI automation tools. These innovations are creating deep uncertainty for traditional business models in the logistics, insurance, and legal sectors. This anxiety was exacerbated by disappointing gross margins from US-based Cisco Systems, which served as a reminder of the rising costs associated with AI infrastructure. Corporate earnings have delivered a starkly mixed bag for the luxury and aerospace sectors. L'Oreal shares plummeted 6.6% after reporting fourth-quarter sales growth that failed to meet market expectations, dragging the personal and household goods sector down by 1.2%. Delivery Hero also faced significant pressure, sliding 8.7% due to mixed results from its Middle East division. In contrast, the aerospace sector provided a bright spot. Safran shares surged 7.3% following an optimistic revenue and earnings forecast for 2026. Capgemini also tracked higher, rising 2% after beating its full-year revenue targets, while NatWest reported a 24% jump in profits. On the macroeconomic front, the European Central Bank (ECB) has maintained interest rates at 2.00%, marking the fifth consecutive meeting without a change. Inflation in the Eurozone has eased to 1.7%, comfortably below the 2% target. A strengthening Euro, which recently touched a multi-year high near 1.19 against the US dollar, is currently acting as a deflationary force by lowering import costs. However, growth remains sluggish. The Eurozone economy expanded by only 0.3% in the final quarter of last year, and Germany’s growth forecast for 2026 is modest at approximately 0.9%. This environment of low growth and low inflation has led many analysts to predict at least one interest rate cut later this year, though the ECB has yet to offer formal forward guidance. Current market data indicates that while the STOXX 600 has maintained a 4.4% gain year-to-date, the path forward remains clouded by technological disruption and cautious consumer spending across the continent.
Indian Stock Market Slides as Sensex Drops 1,050 Points and Nifty Falls Below 25,500 Amid Rising Volatility
Market Overview: February 13, 2026 Global equity markets are facing a turbulent end to the week as a massive sell-off in the technology sector ripples across continents. Investor sentiment has been rattled by a combination of high-impact AI industry developments, shifting trade policies under the current U.S. administration, and fresh inflation data that complicates the outlook for interest rate cuts. Equity Indices and Tech Volatility The **Nasdaq Composite** suffered a sharp **2.03%** decline, closing at **22,597.15** points. This rout was mirrored in India, where the **BSE Sensex** plunged over **880 points** in early trade to reach **82,791.52**, while the **NSE Nifty 50** dropped below the critical **25,600** level. The primary catalyst is the "Anthropic shock"—a major disruption in the IT services landscape following new AI enterprise tools that automate complex legal and compliance tasks. Indian IT giants felt the brunt, with **Infosys** and **Wipro** seeing their American Depositary Receipts (ADRs) crash nearly **10%** overnight. Economic Indicators and Central Banks Refining the macro landscape, U.S. labor data remains resilient with **130,000** non-farm payrolls added in January and unemployment holding steady at **4.3%**. While this shows economic strength, it has dampened hopes for a near-term Fed rate cut. Markets currently price in a **92%** probability that the Fed will maintain rates at its next meeting. In India, January inflation figures landed at the upper end of the RBI’s **2%–4%** tolerance band. This data, combined with a **rupee** weakening against a strengthening **U.S. Dollar Index (96.93)**, has stalled expectations for domestic monetary easing. Commodities and Energy Precious metals are experiencing a "V-shaped" session. After a sharp crash where **Gold** fell below the **$5,000** mark to hit **$4,880**, bargain hunters have stepped in. Spot gold is currently rebounding toward **$4,960** per ounce. * **Gold (MCX):** Trading near **₹1,54,140** per 10 grams. * **Silver (MCX):** Trading near **₹2,43,260** per kg, recovering **2%** after recent volatility. * **Brent Crude:** Trading lower at **$67.41** per barrel, influenced by easing tensions and shifting U.S. energy policies. Sector Performance and Trade Despite the tech gloom, a rotation of capital is visible. **Banking** and **Consumer Finance** have shown resilience, with **Bajaj Finance** and **HDFC Bank** emerging as rare gainers in the current session. The global trade landscape is also adjusting to new U.S. tariff structures. Reports indicate that developed economies have gained a **2%** relative competitive advantage since 2024, while developing nations face a growing disadvantage of nearly **3 percentage points** due to shifting trade costs and the repeal of various climate-related emission standards.

Historical Performance of Indian Stock Markets on Friday the 13th
Market Brief: Friday the 13th Volatility The historical "Friday the 13th" superstition on Dalal Street continues to face a reality check. Data shows that the Indian market has actually closed higher in **9 of the last 16** such sessions, reflecting a positive hit rate of **56.25%**. Major historical gains on this date include a **4%** jump on March 13, 2020, and steady **1%** climbs observed in late 2019, 2021, and as recently as December 13, 2024. Today's Market Performance Despite the historical resilience, the current session on Friday, February 13, 2026, saw benchmark indices succumb to heavy selling pressure. The **BSE Sensex** plunged **813.20 points** (0.97%) to trade near **82,850**, while the **NSE Nifty 50** dropped **263.45 points** (1.02%) to slip below the **25,550** level. The downturn wiped out approximately **Rs 4.62 lakh crore** in investor wealth as market capitalization contracted sharply during afternoon trade. Sectoral Impact and Key Drags The technology sector bore the brunt of the sell-off, with the **Nifty IT index** crashing over **5.5%**. This decline was fueled by global concerns regarding tech business models and valuation repricing. * **Infosys** fell over **6%** * **Tata Consultancy Services (TCS)** declined by **4.8%** * **HCL Technologies** shed **4.4%** Other sectors also faced heat, with metals and realty leading the broader decline. **Hindalco** emerged as a top loser, dropping over **5%**, followed by **Hindustan Unilever** and **Adani Enterprises**, which saw cuts of over **2.5%**. Currency and Global Context The Indian Rupee remained under pressure, trading at a record low of **90.57** against the US Dollar. In the commodities space, **Gold** prices rose by **1%** to reach **Rs 1,54,300 per 10 grams**, as investors moved toward safe-haven assets. The domestic slump followed a weak lead from Wall Street, where the **Nasdaq** tumbled **2%** and the **S&P 500** fell **1.5%** in the previous session. Resilience in Select Heavyweights While the broader market struggled, a few stocks managed to trade against the tide. **Bajaj Finance** led the gainers with a **2.02%** rise, supported by **Eicher Motors** and **Apollo Hospitals**. Banking heavyweights like **HDFC Bank** and **Bharti Airtel** also showed marginal resilience, preventing a deeper slide in the benchmark indices.

Madhusudan Kela on Navigating Market Volatility Through Conviction-Based Investing
Market Outlook 2026: Wealth Creation Amid Structural Shifts Market veteran Madhusudan Kela, promoter of MK Ventures, continues to advocate for a disciplined, long-term approach to the Indian equity markets. He maintains that investors should ignore short-term volatility and focus on the power of compounding, projecting that the historical **14–15%** compounding returns in Indian equities are likely to persist. His strategy emphasizes identifying resilient entrepreneurs and maintaining high-conviction bets in sectors such as financial services, manufacturing, and digital consumption. The Indian capital markets have reached a historic milestone in February 2026, with the National Stock Exchange (NSE) surpassing **25 crore** total trading accounts. The number of unique registered investors has climbed to **12.7 crore**, highlighting a massive expansion in domestic participation. This "J-curve" growth in retail involvement has transformed individual investors from passive participants into a dominant force that now holds approximately **19%** of the total NSE market capitalization. Systematic Investment Plan (SIP) inflows have become the bedrock of market stability. Average monthly SIP contributions rose to **₹28,766 crore** as of early 2026, up from **₹23,743 crore** a year prior. This consistent flow of domestic capital has provided a crucial cushion against global headwinds and foreign institutional outflows. Total assets under management in the SIP ecosystem now exceed **₹16.50 lakh crore**, reflecting a structural shift from speculative trading to long-term wealth creation. Economic indicators remain supportive of this optimistic outlook. The Reserve Bank of India (RBI) has projected a GDP growth of **7.3%** for FY26, supported by a significant cooling of inflation, which has averaged around **2.1%**. Corporate earnings, which saw a modest **5%** growth in FY25, are expected to accelerate significantly, with consensus estimates pointing toward **12–15%** year-on-year growth over the FY26–27 period. Market valuations have normalized following a period of consolidation. The Nifty 50, which traded at peak multiples of **25x** forward earnings in early 2025, has corrected to a more sustainable **20x–21x** trailing P/E. Analysts have set base-case targets for the Nifty at **29,120** by December 2026, with the Sensex potentially approaching the **1,00,000** mark within the next **18 months** if current breakout patterns hold. Key sectors currently under focus include manufacturing, driven by "Make in India" initiatives, and financial services, which remains the largest allocation in Kela’s portfolio. The IPO pipeline also remains robust, with an estimated **₹2.65 lakh crore** in upcoming issues, signaling continued confidence in the Indian entrepreneurial landscape. For the long-term investor, the current environment offers a balanced setup where earnings delivery and policy alignment are expected to drive the next leg of wealth generation.
IT Sector Outlook: Valuation Trends and AI Integration Opportunities according to Manish Sonthalia
Market volatility has intensified in the Indian IT sector as the Nifty IT index fell nearly 5% in a single session on February 13, 2026. This decline marks the worst weekly performance for the technology basket since March 2020. Total weekly losses for the index have reached 10.8%, dragging the year-to-date return to a negative 17.5%. Investors have wiped out over 4 lakh crore in market capitalization during this period. The sell-off is largely attributed to the "Anthropic Shock," following the launch of highly advanced AI automation tools that threaten the traditional labor-intensive outsourcing model. Large-cap heavyweights are bearing the brunt of the pressure. Infosys saw its share price tumble 6.3%, reaching its lowest point since April 2025. Tata Consultancy Services (TCS) dropped 4.9% to hit a fresh 52-week low. Other major players including HCL Tech and Wipro recorded declines between 3.5% and 4.7%. Despite the immediate panic, industry experts maintain a contrarian outlook. Analysts suggest that while AI may cause revenue deflation due to reduced manpower requirements, it will significantly boost profit margins. The sector is currently shifting from a manpower-based delivery system to an "asset-led" model. AI-centric engagements now account for approximately 74% of all new contracts signed by major firms over the last six quarters. Strategic pivots are visible across the Big Six. TCS has launched physical AI initiatives and sovereign cloud ecosystems, while Wipro is prioritizing agentic and embodied AI. Mid-cap and specialized firms like Persistent Systems and L&T Technology Services are increasingly viewed as high-growth AI infrastructure plays. India’s broader AI market is projected to reach 17 billion by 2027, supported by 70 billion in ongoing data center investments. Valuations for the Nifty IT index have moderated to a price-to-earnings ratio of 22.4, down roughly 25% from recent peaks. Institutional data shows that mutual funds have maintained strong positions, adding over 1 crore shares to several IT stocks in early 2026. The current correction is being framed by long-term investors as a transition phase rather than a sector collapse, as companies move from billable hours to high-impact, outcome-based revenue streams.