Bullish News
Collection
Market Outlook Driven by Trade Agreements and Execution Risks
Market Outlook: India 2026 India continues to navigate a complex global landscape, balancing robust internal growth with shifting international trade dynamics. While the long-term foundation is strengthening through deepened trade ties, the near-term market environment remains defined by a tug-of-war between strong domestic participation and cautious foreign flows. Economic Growth and Trade The growth narrative remains resilient, with real GDP projected to expand by **6.9%** in 2026. This performance positions India as a global leader in growth, even as it manages the impact of international trade shifts. A significant breakthrough occurred in early February 2026 with a new trade framework that saw reciprocal tariffs on Indian goods reduced from **25%** to **18%**. This adjustment is expected to provide an incremental boost of **0.2 percentage points** to the annual GDP. Furthermore, services exports continue to be a pillar of strength, maintaining a growth rate of approximately **11%** year-on-year, primarily driven by software and business services. Monetary Policy and Inflation The Reserve Bank of India (RBI) maintains a steady hand to preserve macro stability. In the February 2026 policy meeting, the Monetary Policy Committee unanimously held the repo rate at **5.25%**, maintaining a "neutral" stance. This follows a cumulative **125 basis point** reduction in rates during 2025. Inflation remains within a manageable range, with retail inflation recorded at **2.75%** in January 2026 under the new base series. Projections for the first half of 2026 suggest headline inflation will hover between **4.0%** and **4.2%**, providing the central bank with room to prioritize growth over aggressive tightening. Equity Markets and Capital Flows Equity markets have entered a phase of heightened sensitivity to earnings visibility and currency fluctuations. The Nifty 50 and Sensex have recently stabilized near the **26,000** and **84,300** marks, respectively. Foreign Institutional Investors (FIIs) have shown a mix of caution and selective interest, with recent single-session inflows of approximately **₹2,254 crore** providing temporary relief. However, the broader trend shows significant outflows as global investors wait for clearer recovery signals in corporate earnings. Domestic Institutional Investors (DIIs) continue to act as a stabilizing force, frequently absorbing foreign selling pressure. For instance, recent data showed DIIs as net buyers of over **₹2,600 crore** in a single day, supported by consistent retail participation through systematic investment plans. Currency and Liquidity The Indian Rupee is experiencing increased volatility as it transitions toward a more market-driven valuation. The USD/INR exchange rate has recently breached the **90.00** level, fueled by a widening trade deficit and delayed trade deal implementations. Analysts project potential pressure toward **92.00** by the third quarter of 2026, despite occasional central bank interventions. System liquidity remains comfortable, with a surplus averaging **₹70,000 crore** per day. The RBI has also utilized tools like open market operations and forex swaps, injecting roughly **₹6.3 trillion** into the banking system to support credit growth and market stability. Strategic Allocation Given the current volatility, a disciplined approach to asset allocation is essential. Blending equity exposure with stable fixed-income instruments—such as corporate bonds, which now feature new derivative options for better risk management—allows investors to stay aligned with India's expansion while mitigating short-term fluctuations. Priorities should remain focused on long-term time horizons rather than reactive trades to currency or flow-driven cycles.

Mutual Funds Increased Holdings by Over 10 Million Shares Across 9 Stocks in January 2026
Market Brief: Mutual Fund Activity January 2026 Institutional conviction remained high in January 2026 as mutual funds strategically expanded their portfolios. Despite a **14%** month-on-month dip in overall equity inflows to **24,028 crore**, fund managers displayed aggressive buying in specific high-growth counters. Total industry Assets Under Management (AUM) reached a milestone of **80.76 lakh crore**, supported by steady SIP contributions which held firm above the **31,000 crore** mark for the second consecutive month. High-Volume Institutional Additions Mutual funds added over **1 crore** shares each to nine specific stocks during the month. **Vodafone Idea** led the volume surge with a massive addition of **629 crore** shares. **HDFC Bank** followed with an increase of **3,351 crore** shares, despite the stock facing a price correction of **7%** during the period. This buying pattern signals a tactical shift toward value-based accumulation in large-cap and recovery plays. Professional fund houses appear to be using market volatility to consolidate positions in dominant market leaders and turnaround candidates. Performance Leaders and Price Gains Several stocks in the high-addition category delivered immediate returns for institutional investors. **Ujjivan Small Finance Bank** and **Union Bank of India** both recorded price gains of **18%** since the start of January. Mutual fund holdings in Ujjivan reached **47.9 crore** shares, while Union Bank exposure rose to **31 crore** shares. Other notable performers included **Bandhan Bank**, which saw a **17%** price appreciation, and **Tata Steel**, which climbed **16%** as funds increased their stake to **186.5 crore** shares. Strategic Sector Shifts While flexicap funds attracted the highest individual inflows at **7,672 crore**, there was a visible rotation into defensive and asset-backed instruments. Gold ETFs witnessed a record-breaking surge, with inflows doubling to **24,039 crore**, surpassing the total net inflows of the entire equity segment. In the equity space, funds showed high conviction in the energy and defense sectors. **Bharat Electronics (BEL)** and **ONGC** emerged as top picks, rallying up to **9%** in late January on the back of heavy institutional volume and strong order book visibility. Portfolio Consolidation Trends The market is currently seeing a "quality over quantity" approach. The number of unique stocks held by only a single fund house reached **240**, highlighting a push for differentiated alpha. Simultaneously, concentration in multibagger stocks increased; **253** stocks are now owned by more than **100** different mutual fund schemes. This indicates a clustering of institutional capital around proven performers in the engineering, financial services, and renewable energy sectors.

Info Edge Q3 Results: Consolidated PAT Increases 12% YoY to Rs 272 Crore, Revenue Grows 13%
Info Edge India Limited, the parent company of Naukri.com, has reported a steady financial performance for the third quarter of fiscal year 2026. Despite a volatile broader market environment, the digital services giant saw its consolidated net profit rise by 12% year-on-year, reaching 272 crore. Revenue from operations followed a similar upward trajectory, growing 13% to reach 819 crore for the quarter. This growth was anchored by a robust performance in standalone billings, which increased nearly 12% to 747.2 crore. Recruitment solutions remain the primary engine of the business, contributing 548.3 crore to total billings. Real estate portal 99acres also showed significant momentum with a 14.4% increase in billings, reflecting a healthy appetite in the property market. In a move to reward shareholders, the board has declared an interim dividend of 2.40 per share. The record date for eligibility is fixed for Friday, February 20, 2026, with payments expected to commence on or after March 9, 2026. The stock market environment has been challenging for the technology sector. On February 13, 2026, the Nifty IT index witnessed a sharp 4% decline as global concerns regarding artificial intelligence disruption triggered a sell-off in major tech stocks. Info Edge shares felt this pressure, touching an intraday low of 1,105 and trading near 52-week lows. The broader market also saw significant corrections, with the Sensex dropping over 900 points during the session to slip below the 83,000 mark. While the stock price has faced a downward trend over the past year, falling approximately 25%, the company's fundamentals remain supported by its diverse digital portfolio. Info Edge continues to maintain a debt-free balance sheet and is actively expanding its investment reach. The company recently announced a commitment of up to 1,000 crore to a new alternative investment fund. This initiative is designed to back emerging tech startups, continuing the strategy that saw early and successful entries into platforms like Zomato and Policybazaar. Policybazaar, a key part of the Info Edge investment stable, reached its own milestone this week by facilitating over 2,069 crore in term insurance claims, underscoring the growing maturity of India’s digital insurance landscape. The overall sentiment for the internet sector remains cautious due to high valuations and shifting global tech trends. However, Info Edge’s consistent revenue growth across recruitment and real estate verticals provides a level of operational stability amidst the current market volatility.

Federal Realty Investment Projects Annual FFO Above Estimates Amid Strong Leasing Demand
Federal Realty Investment Trust (NYSE: FRT) has updated its market outlook following a record-breaking 2025. The trust is positioning for steady growth through 2026, driven by an unprecedented surge in leasing activity and the continued resilience of grocery-anchored retail centers. 2026 Financial Targets The company introduced its 2026 guidance for Funds From Operations (FFO) in a range of **$7.42 to $7.52** per share. This represents a core growth of approximately **5.8%** at the midpoint. This forecast arrives as the REIT navigates a higher interest rate environment, specifically a **170–180 basis point** headwind caused by refinancing older, low-rate debt. Leasing and Occupancy Momentum Federal Realty ended 2025 with the highest annual square footage leased in its history. The portfolio is currently **96.6% leased**, with physical occupancy standing at **94.5%**. Rental demand remains aggressive. Comparable rent spreads—the difference between new and expiring leases—hit their strongest levels in over a decade. In the fourth quarter alone, the trust signed **105 comparable deals** with a **12% rental rollover** increase. This leasing pipeline has secured an incremental **$27 million** in new rent that is signed but not yet contributing to the bottom line. Strategic Asset Recycling The trust is actively refining its portfolio to unlock capital. During the recent period, it closed nearly **$340 million** in acquisitions, adding approximately **1 million square feet** of retail space in Maryland and Nebraska. Simultaneously, the company is offloading residential and non-core assets. It recently completed over **$325 million** in dispositions, including high-value apartment complexes. Management indicates that another **$400 million to $500 million** in additional residential assets could be candidates for sale throughout 2026. Market Position and Dividends Federal Realty maintains a market capitalization of approximately **$9.04 billion**. As a member of the "Dividend Kings," it recently marked its **58th consecutive year** of dividend increases, the longest record in the REIT industry. While the trust faces a **60–85 basis point** credit reserve for 2026 to account for potential tenant volatility, its focus on affluent, high-density suburban markets provides a defensive cushion. Residential expansion remains a key pillar, with a **$500 million** development pipeline currently underway to integrate luxury housing with its existing retail footprint.

Realty Stocks Decline as Technology Sector Volatility Impacts Market Sentiment
Market Brief: Real Estate Sector Volatility Indian real estate stocks faced a sharp downturn on **Friday, February 13, 2026**, as the **Nifty Realty index** plunged **2.78%** to a level of **818.90**. This sell-off marks a significant reversal from the post-budget rally earlier this month. The decline was most pronounced among developers with heavy exposure to the **Bengaluru** market. Investors are reacting to a broader tech-sector rout where the **Nifty IT index** tanked nearly **4%** to hit a four-month low. AI Disruption and Market Sentiment The primary catalyst for the slump is growing anxiety over **Artificial Intelligence (AI)**. New AI models and automation tools are raising fears of significant job rationalization within the IT services sector—the backbone of Bengaluru's property demand. Market participants are concerned that a reduction in white-collar hiring will lead to a **12% to 15%** drop in demand for mid-to-premium housing. Short-term traders are currently prioritizing these fears over the long-term infrastructure narrative. Key Stock Performance The impact was visible across major industry players during intraday trade: * **Prestige Estates:** Dropped **4.37%** * **DLF:** Declined **3.71%** * **Godrej Properties:** Fell **3.61%** * **Brigade Enterprises:** Slumped **3.38%** * **Sobha:** Down **1.65%** Despite this volatility, the sector had recently seen gains of up to **15%** following the **Union Budget 2026**, which allocated **₹3,000 crore** to urban housing and introduced tax holidays for data centers. Commercial and Residential Outlook In the commercial segment, global tech leaders have warned that AI’s impact on office space demand could eventually exceed that of the pandemic. However, some analysts argue the market is entering a "mature phase" rather than a collapse. Bengaluru’s rental market remains a outlier, with annual growth still holding at **15% to 20%** in hubs like **Indiranagar** and **Whitefield**. Current property prices in these tech corridors range between **₹7,000 and ₹10,500** per square foot. Summary of Indicators The **India VIX** rose **6.24%** today, reflecting heightened market volatility. While long-term forecasts suggest the real estate sector will contribute **15.5%** to the GDP by **2047**, the immediate outlook is clouded by technological transitions. Investors are now watching for stabilization in IT hiring and further clarity on interest rate cuts from the **Reserve Bank of India**, as the sector remains highly sensitive to both tech-sector health and borrowing costs.

Bitcoin trades near $66,000 as broader crypto market weakens
Bitcoin is currently trading near **$65,000**, reflecting a period of intense consolidation after a volatile slide from its late-2025 peaks. The market is attempting to find a stable floor following a rebound from the **$60,000** support zone, though selling pressure remains persistent. A significant shift in Federal Reserve expectations has fueled recent risk-off sentiment. The nomination of Kevin Warsh as the next Fed Chair has introduced a hawkish outlook, with markets now bracing for tighter monetary policy and higher real interest rates. Total crypto market capitalization has retreated to approximately **$2.26 trillion**. Institutional sentiment shows signs of caution, evidenced by net outflows from spot Bitcoin ETFs totaling **$276 million** in recent sessions. Volatility is currently compressed, with open interest sitting near **$23 billion**. This indicates that much of the previous market leverage has been flushed out. Analysts are closely watching a trading corridor between **$60,000** and **$70,000** as the primary zone for liquidity absorption. The immediate focus for traders is the release of U.S. Consumer Price Index (CPI) data. Both Headline and Core CPI are projected at **+0.3%** month-over-month. These figures will be critical in determining if the market can reclaim the **$71,000** level or if a deeper correction toward **$50,000** is likely. While short-term weakness prevails, long-term indicators remain active. Major entities continue to accumulate, with MicroStrategy recently acquiring **1,142 BTC** for **$90 million**, bringing their total reserves to over **714,000 BTC**. Technical resistance is firmly established at **$83,000**, while a breach below the **$60,000** psychological mark could trigger further liquidations. For now, the market remains in a "wait-and-see" phase, sensitive to every macro-economic update.
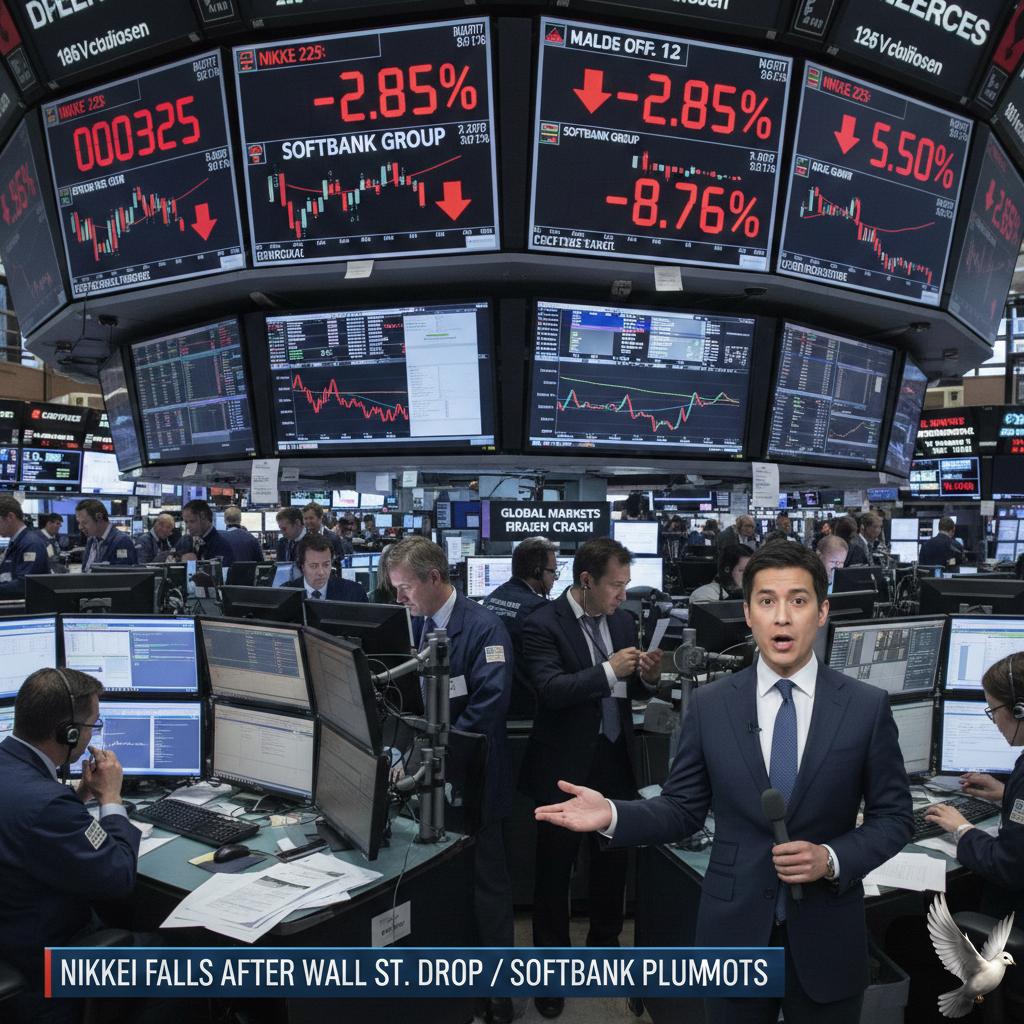
Nikkei Falls Following Wall Street Decline as SoftBank Group Shares Drop Nearly 9%
Japan's equity markets faced a wave of volatility this Friday as the Nikkei 225 index dropped 1.18% to settle at 56,958 points. The decline was largely triggered by a sharp sell-off on Wall Street, where renewed concerns over the sustainability of capital spending in the artificial intelligence sector weighed heavily on technology stocks. SoftBank Group emerged as the primary drag on the benchmark index. Despite reporting a fourth consecutive quarterly profit of approximately $1.6 billion—driven by valuation gains from its OpenAI investment—the stock plummeted 6.46%. Analysts noted a lack of positive surprises in the earnings report, leading investors to offload shares as the company is increasingly viewed as a proxy for the volatile U.S. tech market. In a sharp contrast to the broader tech slump, semiconductor heavyweights found solid footing. Tokyo Electron climbed 2.98% and Advantest rose 1.29%, buoyed by a robust long-term outlook for the global chip industry. Additionally, Kioxia Holdings surged 12% following strong quarterly results, highlighting a split in the technology sector between infrastructure providers and general investment firms. Nissan Motor provided a rare bright spot for the industrial sector, with its shares jumping 7.47%. The automaker reported a surprise quarterly profit and successfully trimmed its full-year loss projections. Market sentiment shifted as investors viewed the latest financial update as a sign of a potential turnaround, sparking significant short-covering activity. The energy sector faced headwinds as Inpex, the nation’s leading oil and gas explorer, saw its stock slide 10.98%. While the company recently beat expectations for the current period, its forward-looking projections for a 16% decline in annual net profit spooked shareholders. This pessimistic outlook overshadowed a record 293.4 billion yen profit achieved in the first nine months of the fiscal year. Broader economic indicators show Japan’s economy growing at a moderate pace, with the 2024 October-December GDP rising at an annualized rate of 2.8%. However, persistent high interest rates in Western markets and shifting U.S. trade policies continue to create a cautious environment for Japanese exporters. The Japanese yen remains under pressure, trading near the 153.30 mark against the U.S. dollar. While a weaker yen typically benefits exporters, the current market focus remains pinned on upcoming U.S. inflation data and its potential impact on future central bank policies both domestically and abroad.
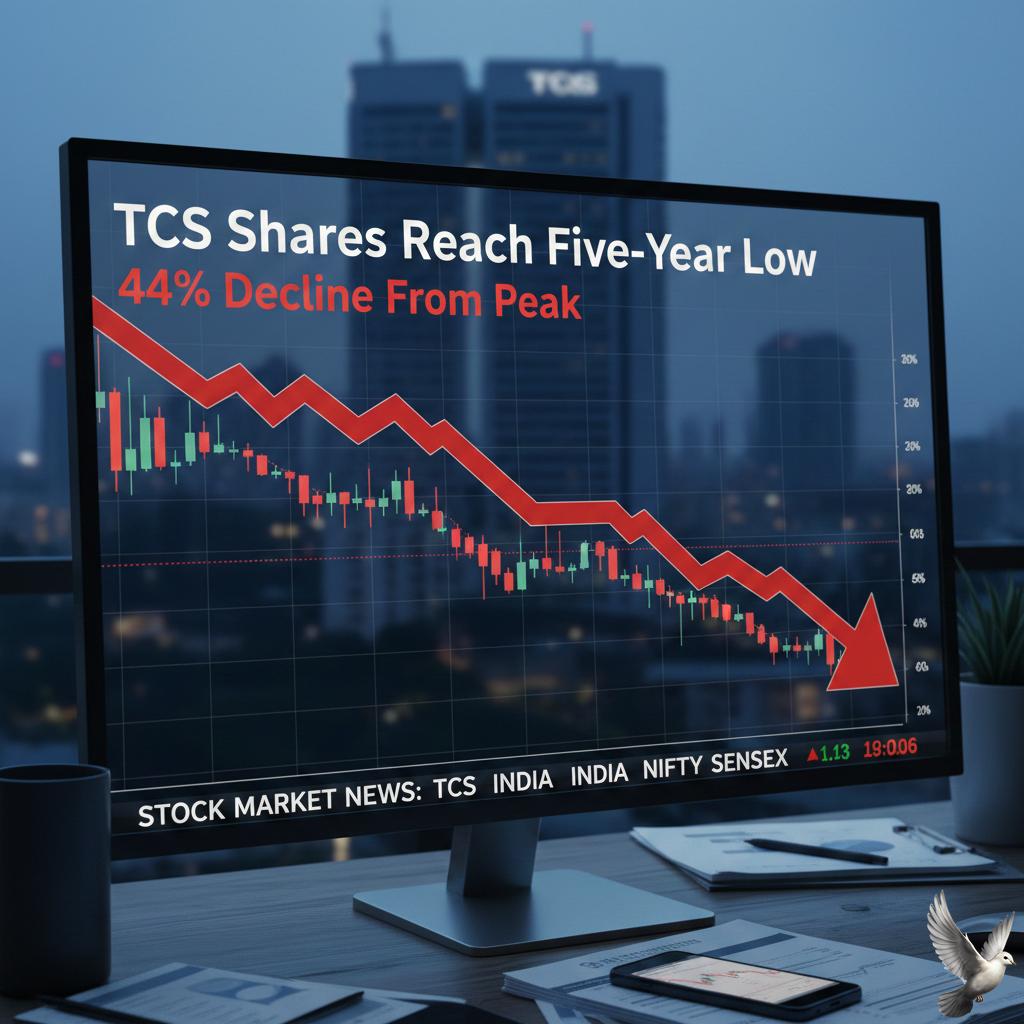
TCS Shares Reach Five-Year Low Following 44% Decline From Peak
Indian IT Market Brief: February 13, 2026 The Indian Information Technology sector is facing a severe valuation correction as artificial intelligence disruption shifts from theoretical risk to market reality. **Tata Consultancy Services (TCS)** has seen its share price sink to a fresh 52-week low of **₹2,579**, marking a significant decline from its previous stability. The downturn has erased over **₹1.3 lakh crore** in investor wealth across the Nifty IT index in just two sessions. This rout has pushed the market capitalization of TCS below the psychological **₹10 lakh crore** mark, currently sitting at approximately **₹9.45 lakh crore**. Consequently, State Bank of India has overtaken TCS as India’s fourth most valuable listed company. The Anthropic Shock The primary catalyst for the current sell-off is the "Anthropic Shock." The US-based AI startup recently launched specialized tools capable of automating high-value legal and coding tasks. This development has sparked fears that traditional billable-hour models used by Indian firms are becoming obsolete. Global sentiment has soured further following a steep decline in US-listed tech stocks. **Infosys ADRs** plummeted nearly **10%** overnight, while **Wipro ADRs** fell by **4.6%**. The Nasdaq’s recent **2.03%** drop continues to weigh heavily on Indian providers that rely on North American clients for the bulk of their revenue. Sector-Wide Impact The Nifty IT index has emerged as the worst-performing sectoral index, falling over **4%** in a single day. Other major players have not been spared: * **Infosys** shares hit a low of **₹1,298** * **HCL Tech** declined by **4.32%** to **₹1,412** * **Wipro** dropped to **₹209** Beyond AI fears, macroeconomic factors are compounding the pressure. Stronger-than-expected US jobs data has dampened hopes for imminent interest rate cuts by the Federal Reserve. A strengthening Indian Rupee, hovering near **90.27** against the Dollar, is also expected to squeeze profit margins for exporters who earn primarily in foreign currency. Shifting Fundamentals Institutional investors are actively rotating capital out of IT and into domestic-heavy sectors like banking. While TCS reported a **5%** year-on-year revenue increase to **₹67,087 crore** in its latest quarterly results, its net profit fell by **14%** to **₹10,657 crore**. This divergence highlights the rising costs of competing in an AI-first economy. The market remains in a "sell-on-rise" mode as technical indicators show IT stocks trading well below their 200-day moving averages. Analysts suggest that the sector's recovery will depend on how quickly these firms can integrate generative AI into their own delivery models to protect their long-term pricing power.

AI-Driven Volatility Impacting Markets Amid Potential Earnings-Led Recovery: Vinit Sambre
Indian Equities Outlook: February 2026 The Indian equity market is demonstrating significant resilience as it navigates a complex global environment. While AI-led disruptions have recently rattled international technology sentiment, domestic indices are maintaining a constructive stance. The **Nifty 50** is currently hovering near the **26,000** mark, showing a steady positive bias supported by robust internal growth drivers. The macroeconomic foundation for 2026 remains exceptionally strong. India's **GDP** is projected to grow between **6.8%** and **7.2%** for the upcoming fiscal year. This expansion is anchored by anchored inflation and a series of structural reforms, including a simplified **GST** structure and significant income tax relief that has bolstered middle-class disposable income. Sectoral Leadership and Earnings Banking and financial services are spearheading the current market momentum. The **Bank Nifty** is consistently testing levels above **60,700**, driven by healthy asset quality and steady credit demand. Experts anticipate a mid-teens earnings growth for the sector as net interest margins stabilize and private lenders capture expanding market share. Consumer discretionary and automotive sectors are also emerging as key performers. Recent tax revisions have resulted in a **5%** to **10%** cost reduction across various auto categories, sparking a surge in demand. Retail activity remains vibrant, with automobile registrations climbing **18%** year-on-year, reflecting a highly optimistic consumer sentiment. Valuation and Momentum Valuations are currently viewed as reasonable, with the **Nifty** trading at approximately **20.5x** one-year forward earnings. This alignment with long-term historical averages suggests that the market is focusing on business momentum rather than temporary price corrections. Foreign Institutional Investors (FIIs) have recently returned as net buyers, reflecting renewed confidence after a period of volatility in 2025. This shift is partly attributed to a landmark trade agreement between India and the United States finalized in early **February 2026**, which has reduced export-related uncertainties for domestic manufacturers. Key Performance Indicators * **Nifty 50 Index**: Trading around the **25,950** level. * **Sensex**: Maintaining a base near **84,200**. * **GDP Forecast**: **7.4%** for FY 2025-26 with upside risks. * **Interest Rates**: Repo rate reductions of **125 bps** over the past cycle. * **Industrial Production**: Accelerated to **4.8%** growth in the latest half-year report. The combination of supportive monetary policy and targeted fiscal incentives is creating a fertile environment for domestic equities. Investors are increasingly prioritizing quality large-cap stocks and sectors benefiting from the "Quick Commerce" boom and green energy transitions. As corporate balance sheets remain lean and deleveraged, the path for a sustained recovery into the second half of **2026** appears well-defined.

Indian Gold Prices Slip to Discount for First Time in Nearly a Month
Domestic gold prices in India are witnessing a rare shift as physical demand struggles under the weight of historic highs. For the first time in a month, local prices have slipped into a discount relative to international benchmarks. Market rates for 24K gold currently hover around **₹15,578 per gram**, with 10-gram futures on the MCX trading near the **₹1,58,540** level. This represents a significant correction from the record peak of **₹17,885 per gram** reached in late January 2026. Despite jewellers offering concessions to stimulate interest, consumer activity remains subdued. The high cost of entry has led to a projected **24% drop** in jewelry demand for the year. Total Indian gold demand is forecasted to fall between **600 and 700 metric tons**, a five-year low, as volatile price swings outpace household budgets. In contrast, China is experiencing a surge in physical gold interest. Ahead of the Lunar New Year, wholesale demand remains robust with withdrawals from the Shanghai Gold Exchange reaching **126 tons** in January. Chinese gold ETFs have also seen record-breaking momentum, with inflows of **RMB 44 billion** (approximately **$6.2 billion**). This trend is supported by retail investors seeking a hedge against domestic market volatility and a cooling real estate sector. The People's Bank of China continues its aggressive diversification strategy. The central bank recently reported its 15th consecutive month of gold acquisitions, adding **1.2 tons** to bring its official reserves to **2,308 tons**. Gold now constitutes approximately **9.6%** of China's total reserve assets. Globally, the market is adjusting to a stronger US dollar and shifting interest rate expectations. Spot gold recently dipped below the psychological **$5,000 per ounce** threshold, triggering technical sell-offs. However, analysts maintain a bullish long-term outlook, with price targets for late 2026 ranging between **$5,200 and $6,000 per ounce**. In the Indian market, investment demand is the primary outlier. While jewelry sales have crashed, gold investment via bars, coins, and ETFs grew by **17%** recently. Many investors are pivoting to the metal as a safer alternative to the underperforming domestic equity indices.

Kumar Rakesh Positions Select IT Stocks Amid AI-Driven Market Volatility
India IT Market Brief: The AI Transition The Indian IT sector is currently navigating a complex "two-phase" transformation as Artificial Intelligence shifts from an experimental tool to a core production driver. While the market is experiencing immediate friction, the long-term outlook remains anchored by a projected industry valuation of **$350 billion** by the end of 2026. Current Market Sentiment and Performance Equities are reflecting near-term anxiety over AI-led disruption. As of **February 13, 2026**, the **Nifty IT Index** has seen significant volatility, trading around the **33,160** level. This represents a sharp monthly decline of approximately **12.7%**. Major constituents such as **TCS** and **Infosys** have faced selling pressure, with the index down roughly **13%** year-to-date. This "front-loaded" disruption is driven by fears of revenue deflation as automation reduces the manpower required for traditional legacy contracts. Spending and Growth Forecasts Despite the stock market correction, enterprise spending in India is accelerating. Total IT spending is forecast to reach **$176.3 billion** in 2026, a **10.6%** increase from the previous year. Investment is heavily concentrated in two areas: * **Data Center Systems**: Projected to grow by **20.5%** as AI infrastructure demand peaks. * **Software**: Expected to rise **17.6%**, reaching **$24.7 billion** as GenAI becomes an embedded standard in applications. The Deflationary vs. Inflationary Tug-of-War The sector is moving through a "revenue deflation" phase. AI agents are now capable of reducing claims processing or coding tasks from minutes to seconds, allowing firms to execute the same volume of work with less labor. However, analysts suggest this is a neutral long-term outcome. The decrease in billable hours is being offset by a transition to **asset-led models** and outcome-based pricing. As companies shift from "running" business to "transforming" it, new inflationary opportunities are emerging in consulting and complex system integration. Labor Market and Talent Shifts The job market is seeing a decisive "capability gap." While routine back-office roles face high risk, demand for specialized AI skills has caused a **28% wage premium** for AI-focused roles compared to non-AI counterparts. India currently leads global AI talent acquisition with a hiring rate of **33%**. This specialized talent is increasingly concentrated in southern hubs, with **Bangalore** and **Hyderabad** accounting for over **20%** of all AI-specific job postings. Looking Ahead The structural transformation is expected to stabilize by the second half of 2026. As Fortune 500 clients begin reporting concrete productivity gains from their AI investments, the focus for Indian IT providers will shift from headcount-based growth to margin-rich, platformized delivery. The current valuation correction is viewed by some analysts as an overreaction to the initial automation shock, overlooking the massive infrastructure cycle currently underway.

Sameer Dalal Identifies Market Value in Consumption, Cement, and Tourism Sectors
The Indian equity landscape is navigating a period of recalibration following the Union Budget for fiscal year 2026-27. While headline indices have faced pressure, market experts like Sameer Dalal are identifying significant value in domestic-facing sectors. The core investment thesis centers on a 1-to-2-year revival cycle in consumption and industrial infrastructure. The Nifty 50 and Sensex recently adjusted to new fiscal realities, settling around 24,825 and 80,722 respectively. This correction has been attributed to a rare Sunday trading session and an increase in the Securities Transaction Tax. However, the Nifty India Consumption Index remains a focal point, trading near 11,976 with a price-to-earnings ratio of 40.66, reflecting continued investor confidence in the domestic demand story. India is on a trajectory to become the world's third-largest consumer market by 2026, surpassing Germany and Japan. Real GDP growth for the 2025-26 fiscal year is projected at a resilient 7.4%, supported by a cooling but steady manufacturing PMI of 59.5. This structural shift is being driven by a growing affluent class and a significant rise in discretionary spending power. The discretionary consumption and tourism segments are witnessing a noticeable uptick. Recent policy moves, such as the reduction of Tax Collected at Source to 2% on outbound tours, have provided a psychological and financial boost to the sector. Major players in the hospitality space are benefiting from a shift toward experience-led travel, with specialized indices highlighting stocks like Trent and Indian Hotels as key beneficiaries of this trend. The cement sector is emerging as a compelling, often overlooked opportunity. Domestic demand is projected to grow by 7% to 8% annually through 2026, fueled by a record capital expenditure outlay of 12.2 trillion INR in the latest budget. Top producers are preparing to invest approximately 1.25 lakh crore INR between 2025 and 2027 to expand capacity by 130 million tonnes. Infrastructure projects, including high-speed rail corridors and urban development in tier-2 and tier-3 cities, are providing long-term demand visibility for the building materials sector. With operating profits in the cement industry expected to rise by 12% to 18% in the coming fiscal year, the segment offers a defensive yet growth-oriented hedge against global volatility. Investors are increasingly looking past short-term market noise to focus on these domestic structural plays. The combination of tax relief for the middle class, massive government infrastructure spending, and a maturing digital economy creates a robust environment for consumption-led portfolios. The focus remains on quality domestic businesses that can capitalize on India's 2.4 trillion USD household consumption base.

JP Morgan Increases Stakes in Indian IT Sector Following Market Downturn
The Indian IT sector is undergoing a significant valuation reset as of February 2026. Market capitalization for major players has seen a sharp contraction, with an estimated loss of **Rs 5.7 lakh crore** across the industry. This downturn is largely attributed to investor anxiety over artificial intelligence (AI) disruption and a rotation of capital into higher-growth sectors like banking. The Nifty IT index reflects this bearish sentiment, having declined more than **20%** over the past year. In a historic shift, the State Bank of India (SBI) recently overtook Tata Consultancy Services (TCS) in market value, with TCS’s capitalization slipping below the **Rs 10 lakh crore** mark for the first time in over five years. Market strategists, including those at JP Morgan, suggest the current sell-off may be an overreaction. They view these firms as the essential "plumbers" of the global technology ecosystem. While the transition to AI creates near-term uncertainty, it also offers long-term implementation and consulting opportunities. Valuations have reached levels that present deep value for long-term investors. Specifically, dividend yields for industry leaders have climbed to crisis-level highs, providing a buffer for shareholders. Infosys and TCS currently offer yields between **2.3% and 3.3%**, appearing attractive against a backdrop of stabilizing corporate earnings. JP Morgan maintains a recommendation to accumulate Infosys and TCS at these levels. Analysts believe the downside is limited given the high switching costs for enterprise clients and the steady demand for "run-the-business" IT services. Infosys recently hit a 52-week low of approximately **Rs 1,281**, while TCS is trading near **Rs 2,610**. Despite the immediate price pressure, the sector is forecast to reach a **$350 billion** valuation by the end of 2026, driven by a ramp-up in data center investments and AI-enabled software solutions. Growth in the sector is expected to stabilize between **11% and 14%** annually through 2026. This momentum is supported by the rapid expansion of Global Capability Centers (GCCs) in India and a resilient workforce that remains highly cost-effective for global enterprises. Investors are now monitoring upcoming quarterly results and US inflation data for signs of a sentiment shift. For those focused on fundamentals, the current pricing represents a significant departure from previous premiums, signaling a shift from a "growth-at-any-price" model to a value-oriented entry point.

Gaudium IVF and Women Health Announces IPO for February 20
Gaudium IVF and Women Health Limited is set to make history as the first dedicated fertility services provider to list on the Indian stock exchanges. The company plans to raise between **150 crore and 200 crore** through an Initial Public Offering (IPO) expected to open on **February 20, 2026**. The offering is structured as a book-built issue. It includes a fresh issue of approximately **1.14 crore equity shares** and an offer-for-sale (OFS) of nearly **95 lakh equity shares** by the promoter, Dr. Manika Khanna. The company has earmarked **50 crore** from the fresh proceeds for capital expenditure to establish **19 new IVF centers** across India. Additionally, **20 crore** will be utilized for debt repayment, while the remainder will support general corporate needs and a diversification into the FMCG sector through specialized healthcare products. Financially, the company has shown consistent growth. For the fiscal year ending March 31, 2025, Gaudium reported revenue of **70.72 crore** and a profit after tax of **19.13 crore**. This represents a sharp increase from the **47.89 crore** revenue and **10.31 crore** profit recorded in the previous year. The company currently operates a "hub-and-spoke" model with **7 hubs and 28 spokes** across multiple states. This expansion comes at a time when the Indian IVF market is projected to reach **$1.87 billion by 2029**, growing at a compound annual rate of **15.7%**. Market trends indicate that the sector is shifting from a niche service to a mainstream healthcare priority. Infertility rates in India currently stand at roughly **13%**, affecting approximately **27.5 million couples**. This demand is further fueled by delayed parenthood, lifestyle changes, and the rising adoption of advanced reproductive technologies like AI-driven embryo selection. While Gaudium is the first to launch, other major players like **Indira IVF** are also preparing for public listings, with some filings targeting a significantly higher valuation of nearly **3,500 crore**. For retail investors, the Gaudium IPO typically reserves **35%** of the net offer, with **50%** allocated to Qualified Institutional Buyers (QIBs) and **15%** for High Net-Worth Individuals (HNIs). The face value of each share is set at **5**.

US Stocks Rise as Options Trading Activity Increases During Earnings Season
U.S. equity markets have entered February 2026 with an aggressive surge in post-earnings volatility, creating a highly lucrative environment for non-directional options strategies. A long straddle strategy—buying both a call and a put at the same strike price—has delivered an exceptional **45% return** over the last four weeks. This performance is nearly double the typical returns seen in historical earnings cycles. Several factors are fueling these outsized moves: **Surprise Market Dynamics** While the S&P 500 recently reached record levels near **7,000**, the underlying market leadership has shifted. Mega-cap technology stocks have cooled, with the "Magnificent 7" gaining only **0.3%** in January. Meanwhile, cyclical and small-cap sectors, such as those in the Russell 2000, surged **5.4%**. This rotation is causing unexpected price swings when companies report their quarterly figures. **Mispriced Volatility** Heading into February, the VIX (Volatility Index) hovered around **17.65**. These relatively low levels made option premiums "cheap" for buyers. Because investors were not pricing in major shocks, the actual stock movements following earnings announcements have frequently exceeded the "implied move" predicted by the options market. **Macro Economic Sensitivity** Stock prices are reacting sharply to company guidance regarding inflation and federal policy. With the Federal Reserve holding interest rates at a **3.5% to 3.75%** range and a new Fed Chair nomination on the horizon, any deviation in corporate outlook is triggering immediate, high-magnitude re-ratings. **Recent Performance Data** Data from the current reporting cycle shows that **46%** of straddles have yielded positive returns. While the 3-year average return for this strategy is **7.0%**, the average return for the current Q4 period has spiked to **9.9%**, with top-performing individual stocks seeing moves as high as **17%** to **18%** in a single session. Traders are finding that the cost of "buying the move" is being handsomely rewarded as the gap between expected and realized volatility remains unusually wide.

US Market Update: Federal Reserve Policy Outlook Drives Investor Divergence
Fed Policy Outlook: Restrictive Stance vs. Labor Support Federal Reserve Governor **Stephen Miran** has intensified his call for a transition to looser monetary policy. He warns that the current settings may be overly restrictive and could stifle economic growth. This position stands in sharp contrast to the prevailing consensus within the Federal Open Market Committee. In the January 2026 meeting, Miran was one of only two dissenters in a **10-2 vote** to maintain the federal funds rate at its current range of **3.50% to 3.75%**. Inflation Crosscurrents Miran argues that inflation is no longer a primary threat to the economy. His perspective is rooted in the significant cooling of shelter inflation, which typically carries heavy weight in price indices. He suggests that low housing costs can effectively offset price pressures in other sectors. Recent data supports a cooling trend, with some measures of everyday household purchases showing a **0.23% decline** in January—the first monthly drop in nearly a year. Annualized Core PCE inflation was last recorded at **2.8%** at the end of 2025. While this remains above the **2.0%** target, Miran contends that expanding supply conditions allow for growth without reigniting high inflation. Labor Market Resilience The push for rate cuts comes as the labor market displays unexpected strength. January 2026 payroll data showed a gain of **130,000 jobs**, significantly outperforming economist expectations of **70,000**. The unemployment rate also edged down to **4.3%** from previous levels. This stability has led many Fed officials, including Chair Jerome Powell, to favor a "wait-and-see" approach. Market expectations for the next rate cut have shifted further into the year. Futures markets now point toward **July 2026** as the likely window for the next reduction, moving away from earlier hopes for a spring adjustment. Divergent Internal Views The Federal Reserve is currently navigating a period of internal transition and differing economic philosophies. While Miran emphasizes the risk of a "hiring recession" and advocates for immediate easing, other officials remain cautious. * **Lorie Logan (Dallas Fed):** Opposes further cuts, citing concerns that policy is not yet doing enough to restrain stubbornly high prices. * **Hawkish Shift:** Recent policy statements have upgraded the description of economic growth from "moderate" to **"solid."** * **Fiscal Influence:** The impact of tax cuts and shifting trade policies continues to complicate the Fed's "data-dependent" path. With the effective federal funds rate holding at **3.64%**, the debate centers on whether to prioritize labor market protection or continue the fight against a "sticky" inflation floor. Miran’s stance remains the most prominent dovish signal in an otherwise cautious central bank environment.

Indian Bond Yields Steady as Profit-Taking Offsets Debt Switch Gains
The Indian sovereign bond market is navigating a phase of cautious consolidation as participants balance favorable inflation data against heavy debt supply. Benchmark 10-year government bond yields recently settled near 6.71%, recovering slightly from earlier lows as traders engaged in profit-taking following a period of steady rallies. Market sentiment is currently anchored by a landmark shift in the domestic inflation framework. Retail inflation for January 2026 was recorded at 2.75%, calculated under a newly introduced Consumer Price Index series with a 2024 base year. This figure confirms that price pressures remain well within the Reserve Bank of India’s target band of 2% to 6%. Notably, the core inflation print stood at a muted 3.4%, signaling that underlying demand-driven pressures are effectively contained. Despite these benign inflation numbers, the bond market faces significant technical resistance. The Reserve Bank of India maintained the benchmark repo rate at 5.25% during its February 2026 meeting, signaling a neutral stance. While the central bank acknowledges that inflation is under control, it has opted for stability over further easing, emphasizing that liquidity management remains its primary focus. Supply-side pressures are emerging as a primary concern for investors. State-run firms and provincial governments are ramping up borrowing activities as the fiscal year draws to a close. Public sector entities plan to raise approximately 175 billion rupees ($1.93 billion) through fresh bond issuances this week alone. This influx of supply has kept the 10-year yield hovering between 6.68% and 6.73%, preventing a more aggressive decline in borrowing costs. Global factors are also exerting pressure on domestic notes. The US 10-year Treasury yield recently climbed to 4.18% following strong labor market data, reducing the likelihood of immediate rate cuts by the Federal Reserve. This narrowing yield spread between Indian and US debt typically limits the room for domestic yields to soften further. Looking ahead, the market remains rangebound. While robust GDP growth of 7.4% and foreign inflows—driven by India’s inclusion in global bond indices—provide a strong floor, the sheer volume of upcoming debt auctions will likely cap any significant price appreciation in the near term. Investors are now closely monitoring liquidity conditions and the central bank’s upcoming open market operations to determine the next major move for the benchmark index.
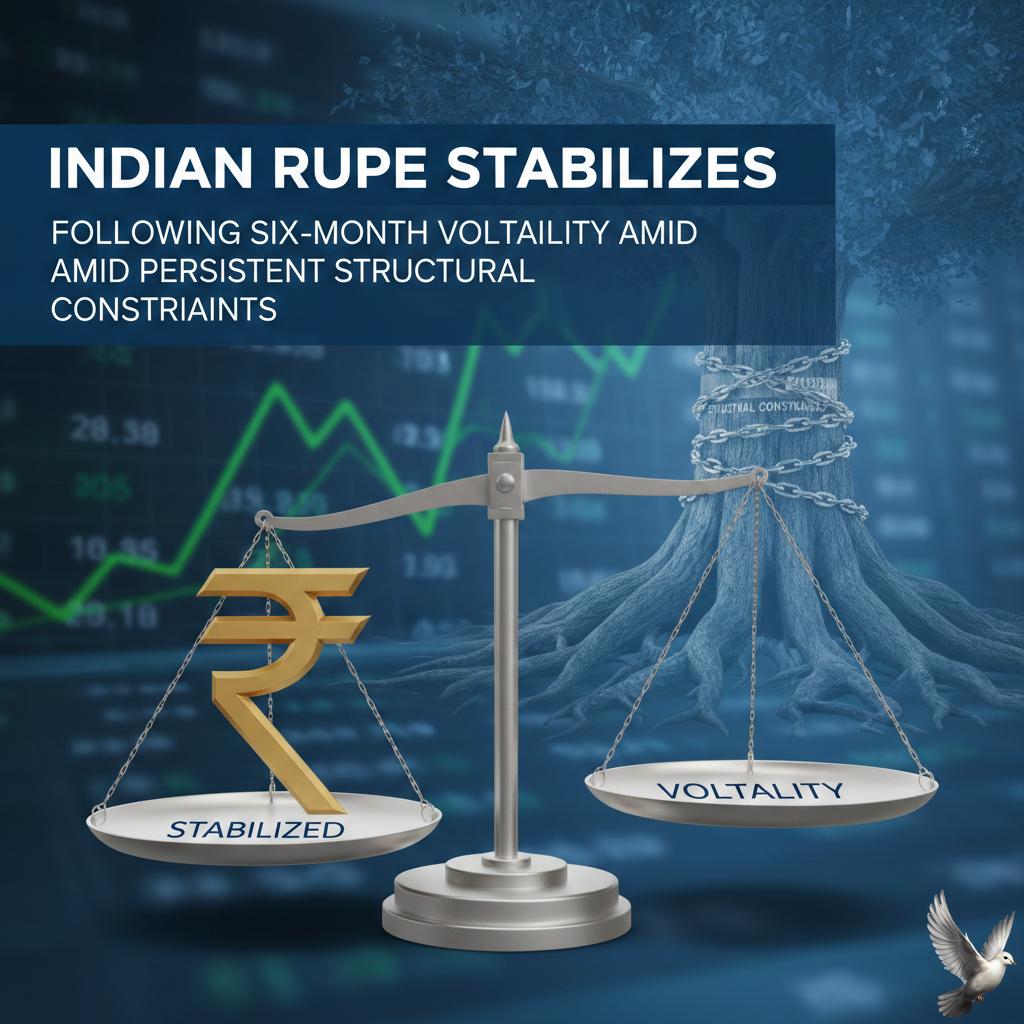
Indian Rupee Stabilizes Following Six-Month Volatility Amid Persistent Structural Constraints
Rupee Market Update: February 13, 2026 The Indian Rupee is navigating a pivotal shift in February 2026, breaking a consistent six-month decline. After months of pressure from U.S. trade policies, the currency has found a temporary floor. As of February 13, the exchange rate is holding steady in the **90.50 to 91.00** range. This follows an aggressive intervention by the Reserve Bank of India (RBI), which surprised markets on February 12 with heavy dollar sales to prevent a breach of the psychological **91.00** barrier. Trade Deal Catalysts The primary driver of improved sentiment is the landmark U.S.-India interim trade deal announced earlier this month. Key details show a reduction in reciprocal tariffs from **50% down to 18%**. Under this framework, India has committed to purchasing **$500 billion** in U.S. energy products, aircraft, and agricultural goods over the next five years. While the deal is not yet legally finalized—with a target for signing by late March—it has significantly reduced the trade uncertainty that plagued the Rupee throughout late 2025. Capital Flows and Reserves Foreign Portfolio Investors (FPIs) have shown early signs of a comeback. After selling nearly **$4 billion** in January, inflows have reached approximately **$2.3 billion** in the first half of February. Banking liquidity remains exceptionally high, with a surplus hovering near **Rs 3 trillion**, the highest level in six months. This abundance of cash has provided a buffer for domestic equities, even as global markets face volatility. Commodity Dynamics Lower global energy costs are providing much-needed relief to India's trade deficit. Brent crude is currently trading around **$69.20** per barrel, while West Texas Intermediate (WTI) sits near **$62.80**. In the bullion market, gold has undergone a sharp **10%** correction from its late January peaks. Current domestic rates for 24K gold are approximately **Rs 15,230** per gram, down from record highs near **Rs 17,885**. This pullback in gold prices typically reduces the demand for dollars used in imports, easing pressure on the INR. 2026 Outlook Despite the recent recovery to the **90.40** level, analysts maintain a cautious stance for the remainder of the year. While the trade deal provides a near-term boost, fundamental risks remain. Growth forecasts for India’s real GDP remain robust at **6.9%** for 2026. However, persistent importer demand and corporate hedging are expected to keep the USD/INR pair volatile. Current projections suggest a potential move toward **93.00** by the fourth quarter of 2026 as the initial euphoria of the trade deal settles into long-term implementation.

**Muthoot Finance Shares Fall 14% Post-Q3 Results as Analysts Weigh Profit Growth Against Performance Outlook**
Market Brief: Muthoot Finance **Muthoot Finance** shares experienced a sharp sell-off on **February 13, 2026**, despite delivering record-breaking growth in its third-quarter earnings. The stock plummeted as much as **14%** during intraday trading, touching a low of **Rs 3,577** on the BSE. This correction ended a five-day winning streak and saw the company underperform the broader **Sensex**, which fell by approximately **0.82%** on the same day. The market reaction stands in stark contrast to the company's fundamental performance. For the quarter ending December 2025, standalone net profit nearly doubled, surging **94.9%** to **Rs 2,656 crore** compared to **Rs 1,363 crore** in the previous year. This growth was fueled by a massive **64%** rise in total income, which reached **Rs 7,263 crore**. Assets Under Management (AUM) reached a milestone of **Rs 1.48 lakh crore**, reflecting a year-on-year expansion of **51%**. The core gold loan portfolio remains the primary driver, accounting for **Rs 1.40 lakh crore** of the total assets. Management has responded to this momentum by raising its annual growth guidance for **FY26** to **44–45%**, up from the previous estimate of **30–35%**. Analysts suggest the stock's decline may be attributed to profit booking and technical factors. While the stock fell below its **20-day** and **50-day** moving averages, it remains above its **200-day** moving average of **Rs 3,045**, indicating the long-term bullish trend is still intact. Concerns over a **2%** sequential dip in gold tonnage and a slight moderation in core net interest margins likely contributed to the immediate price pressure. Brokerages remain overwhelmingly positive. **Jefferies** maintained a Buy rating with a target of **Rs 4,750**, citing healthy loan-to-value buffers and easing regulatory norms for branch expansion. **CLSA** retained its Outperform rating with a target of **Rs 4,600**, noting that earnings exceeded projections by nearly **8%**. **Nuvama** raised its target price to **Rs 4,700**, highlighting the company’s ability to defend yields despite rising competition. Operational highlights include the planned opening of **150-200** new branches in the coming year. The company is benefiting from the **Reserve Bank of India's** decision to remove the requirement for prior approval for branch expansion for large lenders. This regulatory shift is expected to further accelerate the company's physical footprint and customer acquisition.

The Role of Insurance in Supporting India’s $5 Trillion Economic Objective
Market Overview The Indian insurance sector has reached a defining milestone, with total assets under management hitting **₹74.4 lakh crore** as of early **2026**. This surge reflects a **43%** jump in total premium income over the last four years, climbing to **₹11.93 lakh crore** in the latest fiscal cycle. Despite this revenue scale, the national insurance penetration remains at **3.7%** of GDP. This gap underscores a massive untapped market as India pursues its "Insurance for All by 2047" vision through aggressive regulatory shifts and tax reforms. Sector Performance and Trends The non-life segment is undergoing a structural transformation. **Health insurance** has officially overtaken motor insurance as the primary business line, now accounting for **41%** of all non-life premiums. * **11.5%**: The projected rise in medical plan costs for **2026**, forcing employers toward flexible benefit models. * **12.8%**: The year-on-year growth in life insurance Annualized Premium Equivalent (APE) recorded in January **2026**. * **112%**: Recent growth in SME insurance, driven by digital expansion and specialized regional outreach. Regulatory and Economic Catalysts A landmark shift in the landscape arrived with the **Sabka Bima, Sabki Suraksha Act of 2025**. This legislation raised the Foreign Direct Investment (FDI) limit to **100%**, inviting global capital and technology into the domestic market. Significant affordability gains were triggered in late **2025** by the removal of GST on life and individual health insurance premiums. This tax relief, combined with a projected **7.3%** GDP growth for **2026**, is expected to increase household disposable income and drive a **21%** surge in policy sales. Building National Resilience The focus has shifted toward shielding the "missing middle," specifically gig workers and MSMEs. The **NPS e-Shramik** model, launched to integrate the informal workforce, now supports over **211 lakh** subscribers. Social security nets continue to widen, with cumulative enrollments in government-backed schemes reaching **56.15 crore** for accident insurance and **26.32 crore** for life cover. These initiatives are designed to act as financial shock absorbers against rising climate and economic risks, stabilizing the path toward a fully insured nation by **2047**.