Bullish News
Collection
Smallcap Index Rises 6% Over Nine Sessions
February 2026 marks a decisive turning point for smallcap investors as the segment emerges from a bruising 2025. After a period of deep losses and valuation resets, the Nifty Smallcap 100 has already surged over 6% in the first nine sessions of the month. This recovery is underpinned by a fundamental shift in both corporate earnings and the geopolitical trade landscape. The December quarter results have acted as a massive catalyst. Analysis of Q3 earnings reveals that smaller companies have outpaced their large-cap peers in revenue growth and cash flow. Experts note that earnings downgrades are finally moderating, with many sectors seeing an acceleration that signals the start of a multi-year recovery cycle. Global trade breakthroughs are providing the necessary macro tailwinds. India’s landmark trade deals with the US and the European Union have fundamentally altered the outlook for export-oriented small and mid-sized firms. Under the new pact, US tariffs on Indian goods have dropped from nearly 50% to 18%, while the EU deal provides duty-free access for 99% of Indian exports over the next seven years. This shift is already translating into orders for labor-intensive sectors. Exporters in chemicals, footwear, and marine products report a surge in inquiries as India’s global competitiveness improves. Industry projections suggest Indian exports could reach the 1 trillion dollar mark by 2026-27, supported by these preferential trade terms. Institutional sentiment is following the fundamentals. After months of caution, Foreign Institutional Investors (FIIs) have turned net buyers in February, recording single-day inflows as high as 943 crore. While Domestic Institutional Investors (DIIs) continue to act as a cushion, the return of foreign capital is a vital sign of improving risk appetite for the broader market. Market breadth remains exceptionally healthy despite daily fluctuations. Recent sessions showed nearly 1,033 stocks advancing against only 173 decliners in the small-cap space. This advance-decline ratio of nearly 6:1 suggests that buying interest is widespread rather than restricted to a few heavyweights. While the BSE Smallcap index trades around the 46,825 mark, a divergence between winners and losers is becoming more pronounced. Sectors like industrial manufacturing, auto components, and building materials are leading the charge. Investors are shifting focus toward quality businesses with high return ratios and superior capital allocation, moving away from the speculative froth of previous years. [Market Mojo Small-cap Analysis](https://www.youtube.com/watch?v=OOxs7_FT8AA) This video provides an expert outlook on how selective small-cap stocks are positioned for a recovery following the Q3 earnings season. http://googleusercontent.com/youtube_content/0

Ajay Bagga on AI, Metals, and Defence: Market Landscape Analysis
**Market Brief: Sector Analysis & Outlook** **Indian IT: The AI Correction** The Indian IT sector is undergoing a significant structural reassessment as artificial intelligence disruption moves from a theoretical risk to a tangible market force. On February 12, 2026, a global tech sell-off wiped over **$1 trillion** in value, triggering a **5.51%** crash in the Nifty IT index. Major industry leaders saw sharp declines, with Tata Consultancy Services (TCS) falling below the **₹10 lakh crore** market cap milestone for the first time in five years. Market experts emphasize that traditional headcount-based models are under extreme pressure. Real-world data indicates that tasks previously requiring **200 hours** of manual labor are now being completed by AI in just **2 hours**. With the Nifty IT index down **12.5%** year-to-date, investors are advised to wait for concrete "use cases" and proof of business model evolution before increasing exposure. **Metals: Disciplined Momentum** The metals sector presents a more constructive outlook, supported by disciplined global supply and steady domestic demand. While LME aluminum prices saw a minor correction of **0.66%** to **$3,063** per tonne in mid-February, year-to-date prices remain up approximately **4% to 6%**. Demand remains robust, fueled by India’s infrastructure push and the growing electric vehicle (EV) ecosystem. Copper continues to experience volatility with swings of over **5%**, yet it remains a priority for electrification projects. Strategic "blanket orders" are becoming the preferred tool for industrial buyers to lock in prices amid early 2026 volatility. **Defense: Strategic Growth** The defense sector remains a pillar of long-term structural optimism despite recent market volatility. The Union Budget 2026-27 allocated a record **₹7.84 lakh crore** to defense, a **15%** year-on-year increase. Crucially, the modernization budget surged by **21.8%** to **₹2.19 lakh crore**. While the Nifty India Defence index faced a sharp **9%** correction following the budget due to unmet aggressive expectations and tax changes, the fundamental outlook remains strong. The government has earmarked **75%** of the capital acquisition budget for domestic procurement, ensuring a steady pipeline for local manufacturers. **Automotive: Retail Resurgence** The Indian auto sector began 2026 with exceptional momentum, recording a **17.61%** year-on-year growth in January retail sales. Total units reached **27.22 lakh**, driven by healthy rural cash flows and wedding season demand. Two-wheeler sales led the charge with a **20.82%** jump, while passenger vehicles grew **7.22%**, largely supported by the sustained popularity of SUVs. The industry is also pivoting toward mass-market electrification, with major players launching primary household EVs. Dealers remain optimistic for the first quarter, supported by a growth-oriented budget and stable interest rates. [Ajay Bagga maps the market landscape](https://www.youtube.com/watch?v=8s9wByjQlpY) This video provides expert insight into why investors should differentiate between short-term market noise and long-term trends in sectors like IT and defense.

Shifting Global Investment Patterns: An Analysis of International Market Realignment
Global markets are navigating a structural shift in early 2026 as the era of U.S.-led economic dominance transitions into a more fragmented, multipolar landscape. Investors are moving beyond traditional American tech-heavy portfolios, seeking resilience in a global order defined by competing trade blocs and localized supply chains. The focus is shifting toward non-U.S. equity markets, which demonstrated significant momentum leading into this year. In a notable reversal of recent historical trends, the S&P Global Ex-U.S. Index outperformed the S&P 500 by over 12% during 2025. This trend persists as European and Asian markets offer attractive relative valuations and benefit from diversifying capital flows. European equities, particularly in Germany, are gaining traction as the region accelerates its push for strategic autonomy. Heavy fiscal spending on defense and infrastructure is revitalizing the industrial sector. Banks and defense stocks are emerging as primary beneficiaries of this regional pivot, supported by the delayed stimulative effects of 2025 interest rate cuts. Energy markets remain a cornerstone of this new framework. Global oil supply is expected to outpace demand through 2026, putting downward pressure on prices. Brent crude is currently trading near $68 per barrel, with forecasts suggesting a further decline toward an average of $58. Despite lower prices, energy stocks remain vital as nations prioritize resource security, with record free-cash-flow generation supporting healthy dividends. Currency markets reflect this diversification. The Euro and Canadian Dollar have become key instruments for those hedging against a less dominant U.S. Dollar. The Euro is buoyed by improved corporate earnings expectations, while the Canadian Dollar is sensitive to the ongoing USMCA renegotiations. Meanwhile, the Indian Rupee has stabilized near 90 per USD, reflecting India's rising prominence in the multipolar trade environment. Emerging markets are no longer viewed as a single bloc. Diversification now requires a granular approach, pairing export-heavy economies with those driven by domestic consumption. India, for instance, remains a standout with projected GDP growth of 6.5% to 7%, even as global trade growth slows to a modest 0.5%. The move toward "friend-shoring" and national security-driven investment is now a core strategic variable. Capital is increasingly flowing toward sectors where security, energy, and supply chains converge. This realignment marks a definitive departure from cost-driven offshoring, favoring regional stability and strategic independence over globalized efficiency.
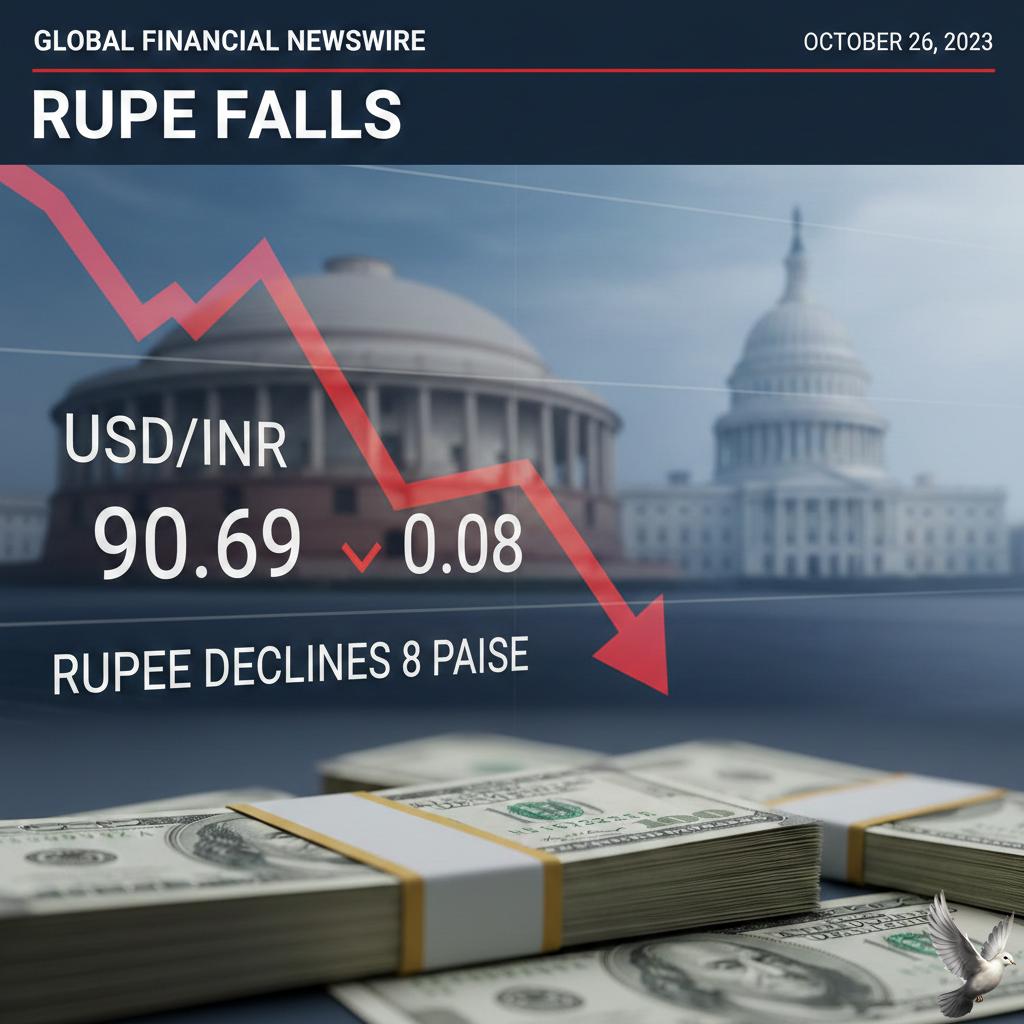
Rupee Declines 8 Paise to 90.69 Against US Dollar in Early Trade
The Indian Rupee faced selling pressure on Friday, February 13, 2026, trading near the **90.69** level against the US Dollar. This depreciation marks a shift in sentiment as the greenback gains strength from both geopolitical developments and a broad "risk-off" mood in global markets. Domestic equity markets acted as a primary drag on the currency. The BSE Sensex tumbled over **800 points** to trade around **82,900**, while the Nifty 50 dropped below the **25,600** mark. A massive sell-off in the IT sector, triggered by global concerns over artificial intelligence disruption and valuation repricing, wiped out approximately **₹4 lakh crore** in investor wealth. The US Dollar Index (DXY) showed resilience, hovering around the **97.00** mark. Support for the dollar was bolstered by reports that Russia is considering a return to dollar-based settlements. An internal Kremlin memo suggested a pivot back to the US currency for energy transactions as part of a potential economic partnership, a move that would reverse years of de-dollarization efforts. Emerging market currencies remained under pressure as global investors pivoted toward safe-haven assets. This cautious approach is being driven by uncertainty surrounding upcoming US inflation data and a general softening in global risk appetite. On the domestic front, new economic data provided a mixed cushion. India’s retail inflation for January 2026 was recorded at **2.75%** under a newly overhauled CPI series with a 2024 base year. While this is an increase from previous months, it remains well within the Reserve Bank of India’s tolerance band of **2% to 6%**, offering some fundamental stability despite the external volatility. The outlook for the rupee remains tied to the closing phase of the domestic earnings season and the persistence of Foreign Institutional Investor (FII) flows. While FIIs recently turned net buyers, the sharp decline in tech stocks and firming global bond yields continue to test the currency's resilience.

Sensex Drops Over 800 Points as Market Capitalization Declines by More Than Rs 4 Lakh Crore
Market Alert: Indian Tech Sector Selloff The Indian equity benchmarks faced a sharp downturn on Friday, February 13, 2026, as a massive rout in technology stocks triggered a broad-based market correction. The **Sensex tumbled 834.20 points** to trade at **82,840.72**, while the **Nifty 50 slipped 270.90 points**, falling to **25,536.30** during early sessions. Market volatility surged as the India VIX gained **4%**, reflecting heightened investor anxiety. The primary catalyst for the slump is a "qualitative risk" repricing within the IT sector, driven by fears that rapid advancements in artificial intelligence are making traditional labor-intensive outsourcing models obsolete. IT Index Crumbles Under AI Pressure The **Nifty IT index crashed 5.51%**, marking one of its steepest single-day declines in recent months. The index has now plummeted approximately **12.7%** over the last 30 days. Investor sentiment was further dampened by a weak lead from Wall Street, where the Nasdaq closed **2% lower** overnight due to AI valuation concerns. The selloff resulted in a significant erosion of household wealth, with the BSE market capitalization dropping by approximately **₹2.5 lakh crore**. Total market capitalization now stands at **₹474.5 lakh crore**. Performance of Key Tech Heavyweights Sector leaders experienced substantial losses, with several blue-chip stocks hitting multi-month lows. * **Infosys:** Fell **5.6%** to **₹1,398** * **TCS:** Dropped **5.2%** to **₹2,758**, falling below the **₹10-lakh-crore** market cap milestone * **Tech Mahindra:** Declined **4.3%** to **₹1,563** * **Wipro:** Shed **4.5%** to trade at **₹219.49** * **Coforge:** Emerging as a top laggard with a **6.8%** plunge Global and Domestic Headwinds Beyond technology-specific fears, broader economic indicators are weighing on Dalal Street. Stronger-than-expected **U.S. jobs data** has revived concerns that interest rates will remain "higher for longer," which typically compresses valuations for growth-oriented tech firms. Additionally, a recent **NITI Aayog roadmap** warned that the current $265 billion IT sector must shift from headcount-based revenue to platform-driven models to survive. This structural shift is causing "valuation repricing" as investors move capital toward performing sectors like Banking and FMCG. Foreign Portfolio Investors (FPIs) remain cautious, though they were marginal net buyers of **₹108 crore** in the previous session. Domestic Institutional Investors (DIIs) provided some support with purchases of **₹276 crore**, but this was insufficient to stem the tide of the tech-led retreat.

Hindalco Q3 Results: Robust Aluminium Earnings Balance Lower Novelis Margins Following Oswego Fire Impact
Hindalco Industries is currently navigating a complex market environment characterized by record-breaking performance in its domestic operations and temporary operational hurdles at its global subsidiary, Novelis. The company's latest quarterly results show a consolidated revenue of 66,521 crore, marking a 14% year-on-year increase. However, reported net profit fell to 2,049 crore from 3,735 crore in the previous year. This dip was largely driven by a significant exceptional item of 2,610 crore related to fire disruptions at the Novelis Oswego plant in the United States. Despite these challenges, Hindalco's India business remains exceptionally strong. The Aluminium Upstream segment achieved a quarterly EBITDA of 4,832 crore, a 14% increase from the prior year. The downstream business saw even more aggressive growth, with EBITDA surging 55% to 233 crore, supported by a 9% rise in sales volumes and a more profitable product mix. Global aluminium markets are providing a tailwind for the firm. London Metal Exchange (LME) aluminium prices recently hit a three-year high, testing the 3,000 per tonne threshold. As of mid-February 2026, cash offers are trending near 3,098 per tonne. This pricing strength is reinforced by declining global inventories and a structural shift toward "green demand" in sectors like electric vehicles and renewable energy. To capitalize on this demand, Hindalco has launched a massive 55,000 crore capital expenditure program. A major highlight is the 21,000 crore expansion of the Aditya Aluminium smelter in Odisha, which will add 3.6 lakh tonnes of annual capacity. The company also recently commissioned a 4,500 crore facility for flat-rolled products and battery-grade foil, aiming to halve India's dependence on aluminium imports. At Novelis, while the Oswego facility fire impacted short-term cash flow by an estimated 1.3 billion to 1.6 billion, the subsidiary continues to focus on cost optimization. It reported a 6% increase in Adjusted EBITDA per tonne to 430. The hot mill at the Oswego plant is expected to restart by early fiscal 2027, which should restore shipment volumes to normal levels. Market sentiment reflects these long-term growth prospects. Analysts have maintained "Buy" ratings, citing Hindalco's conservative debt-to-equity ratio of 0.48 and its leading ESG position in the global aluminium sector. Share prices are currently trading around the 950–970 range, having recently touched a 52-week high of 1,029.80.

Honasa Consumer Shares Rise 4% Following 93% Surge in Q3 Net Profit
Honasa Consumer has delivered a standout performance for the third quarter of the 2026 fiscal year, signaling a major recovery following recent distribution restructuring. The company reported its highest-ever quarterly revenue of 602 crore, representing a 16% year-on-year increase. On a like-for-like basis, revenue growth reached a robust 22%. Profitability saw a dramatic surge during the December quarter. Consolidated net profit nearly doubled, jumping 93% to 50 crore compared to 26 crore in the same period last year. This bottom-line expansion was supported by improved operational efficiency, with EBITDA margins doubling to 10.9% from 5% a year ago. Market sentiment reflects this growth, with the share price trading at approximately 312.75 as of mid-February 2026. The stock has gained over 13% in recent trading sessions following the earnings announcement, bringing its market capitalization to over 10,000 crore. A key driver of this turnaround has been Project Neev, the company's strategic shift to a direct distribution model in India's top 50 cities. By removing layers like super-stockists and improving retail servicing, Honasa has expanded its total reach to over 2.7 lakh outlets. Direct outlet coverage alone has now surpassed the 1 lakh milestone. The brand portfolio continues to diversify and scale. The flagship brand, Mamaearth, has successfully returned to double-digit growth in the teens. Younger brands, including Aqualogica and Dr. Sheth’s, grew by over 25%, while The Derma Co. maintained a healthy double-digit EBITDA profile. Looking forward, Honasa is pivoting toward the fast-growing men's grooming segment. The company recently acquired a 95% stake in the south-focused brand Reginald Men for 195 crore. This move aligns with broader industry trends where the Indian men’s skincare market is projected to reach 40,000 crore by 2032. The broader Indian beauty and personal care market remains a high-growth zone, currently valued at 40 billion. With sector-wide growth projected at 10–12%, Honasa is positioning itself through premiumization and a "house of brands" strategy to capture a larger share of discretionary spending among Gen Z and urban consumers.

Silver and Gold Recover Gains Following Recent Sharp Correction; Investor Outlook Analyzed
Precious metals are staging a recovery today, February 13, 2026, as buyers return to the market following a high-volatility selloff. Gold and silver futures on the MCX are trading higher, reclaiming ground lost during a sharp liquidation phase fueled by a strengthening US dollar and shifting interest rate expectations. MCX Market Performance Gold futures for March delivery have climbed to approximately **₹1,58,540 per 10 grams**, marking a rebound of over **1%** in early trade. This follows a volatile session where prices tested the **₹1,57,700** support zone. Retail 24K gold in major Indian metros is currently holding near **₹1,58,390 per 10 grams**. Silver is displaying its characteristic high beta, outperforming gold in the recovery. MCX silver futures have surged nearly **2.35%**, trading around **₹2,95,100 per kilogram**. The white metal has successfully bounced from its weekly low of **₹2,75,000**, though it remains well below the early February peak of **₹3,50,000**. Global Price Action In international markets, spot gold has moved back toward the **$4,960 per ounce** level. This recovery comes after a dramatic **3%** plunge in the previous session, which saw the metal briefly slip below the psychological **$5,000** mark. Spot silver is trading near **$76.76 per ounce**, rising approximately **2.1%** as industrial and speculative demand provides a floor. Despite the daily gains, both metals are on track for a modest weekly loss as markets digest the impact of "risk-out" moves. Macroeconomic Drivers The primary pressure on bullion earlier this week stemmed from January US jobs data. Non-farm payrolls rose by **130,000**, far exceeding estimates, while the unemployment rate edged down to **4.3%**. This labor market resilience has forced traders to push back expectations for the first Federal Reserve rate cut from June to July 2026. The resulting spike in the US dollar index made greenback-priced metals more expensive for global buyers, triggering a wave of stop-loss selling and margin-related liquidations. Emerging Trends and Indicators Market participants are now pivoting their focus to upcoming US inflation data. A reading below the anticipated **2.5%** could revive rate-cut bets and provide the necessary catalyst for gold to retest its all-time high of **₹17,900** per 10 grams seen in January. Central bank activity remains a structural pillar for the market. Emerging economies continue to diversify reserves, with annual central bank demand projected to average **585 tonnes** per quarter throughout 2026. This sustained institutional buying is expected to offset near-term volatility caused by currency fluctuations. Physical demand in India remains robust, supported by the ongoing wedding season and a cultural shift toward digital gold and silver accumulation. Analysts maintain a bullish long-term outlook, with several major institutions projecting gold to reach **$6,000 per ounce** by the end of the year as geopolitical uncertainties persist.
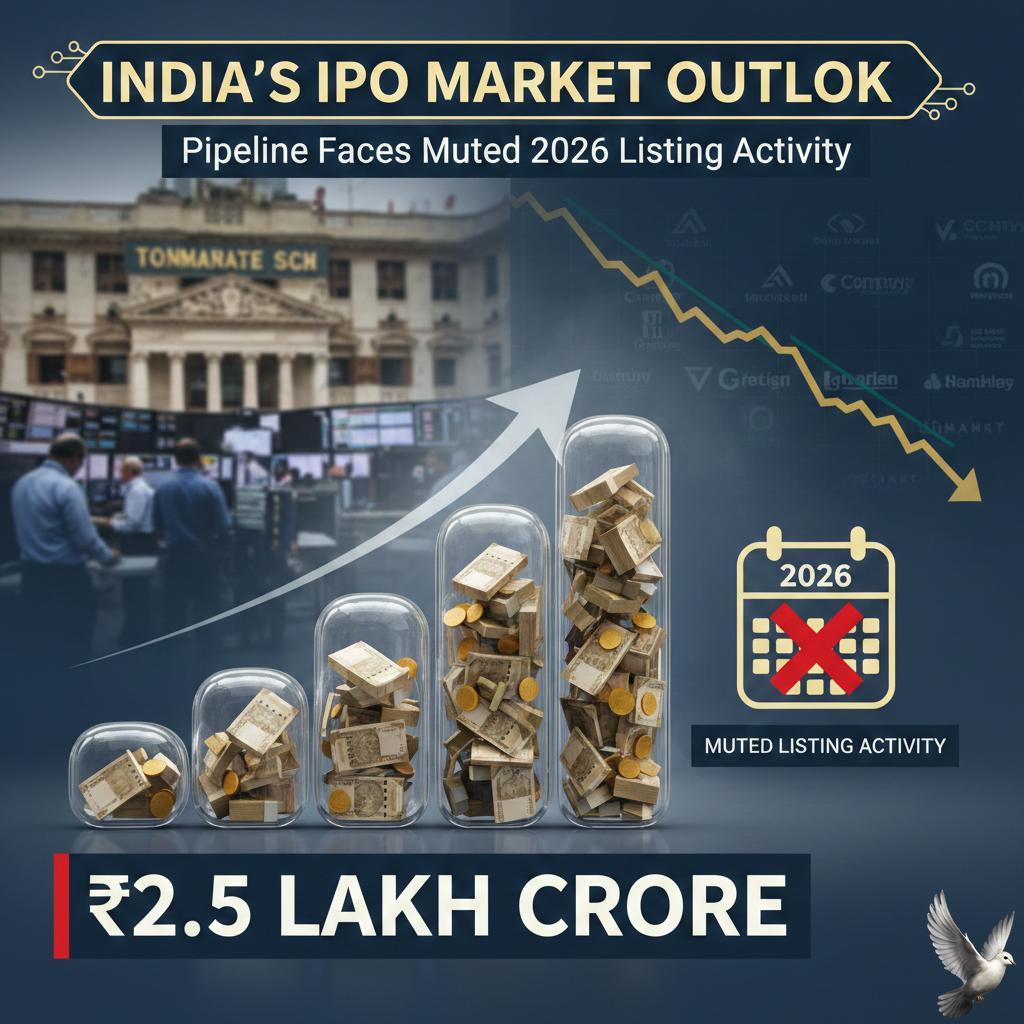
India's IPO Market Outlook: ₹2.5 Lakh Crore Pipeline Faces Muted 2026 Listing Activity
India's primary market is navigating a complex transition in early 2026. Despite a massive pipeline exceeding **Rs 2.5 lakh crore**, the pace of new listings has decelerated. This slowdown stems from a cautious secondary market, where benchmark indices have faced significant pressure. As of mid-February 2026, the **Nifty 50** has slipped below the **25,600** level, while the **BSE Sensex** is trading near **82,900**. This reflects a single-day drop of over **800 points** in recent sessions, driven largely by a sharp sell-off in the IT sector and global tech volatility. The market environment has been further complicated by the **Union Budget 2026**. While the budget proposed a record capital expenditure of **Rs 12.2 lakh crore** for the next fiscal year, it also introduced a hike in the **Securities Transaction Tax (STT)** on derivatives. This move initially triggered a **1,800-point** intraday crash on the Sensex as investors reacted to higher trading costs. Foreign Portfolio Investors (FPIs) have shown inconsistent behavior. After a heavy exit of **$3.95 billion** in January 2026, foreign inflows remain modest and selective. Although FPIs turned net buyers of approximately **$897 million** in the first week of February, the overall sentiment remains fragile. The IPO pipeline itself remains historically deep. Currently, **84 companies** have secured SEBI approval to raise roughly **Rs 1.14 lakh crore**, while another **108 firms** are awaiting clearance for an additional **Rs 1.46 lakh crore**. Total potential fund mobilization involves more than **190 issuers**. Mega-offerings from giants like **Reliance Jio**, **Flipkart**, and the **National Stock Exchange (NSE)** are anchoring this pipeline. Reliance Jio alone is eyeing a valuation between **Rs 11 lakh crore** and **Rs 12 lakh crore**, making it a potential milestone for Indian capital markets. However, listing gains have noticeably cooled. The average listing gain has dropped to approximately **10%** in the current cycle, compared to **30%** in previous years. Nearly **36%** of recent IPOs are trading below their offer price, forcing promoters and private equity firms to reconsider their timing. Domestic Institutional Investors (DIIs) continue to act as a vital cushion, providing liquidity through consistent SIP flows. Yet, the combination of high valuations and a volatile secondary market has led many companies to delay their launches. The market is now shifting toward a "wait and watch" phase, prioritizing realistic pricing over aggressive fundraising.
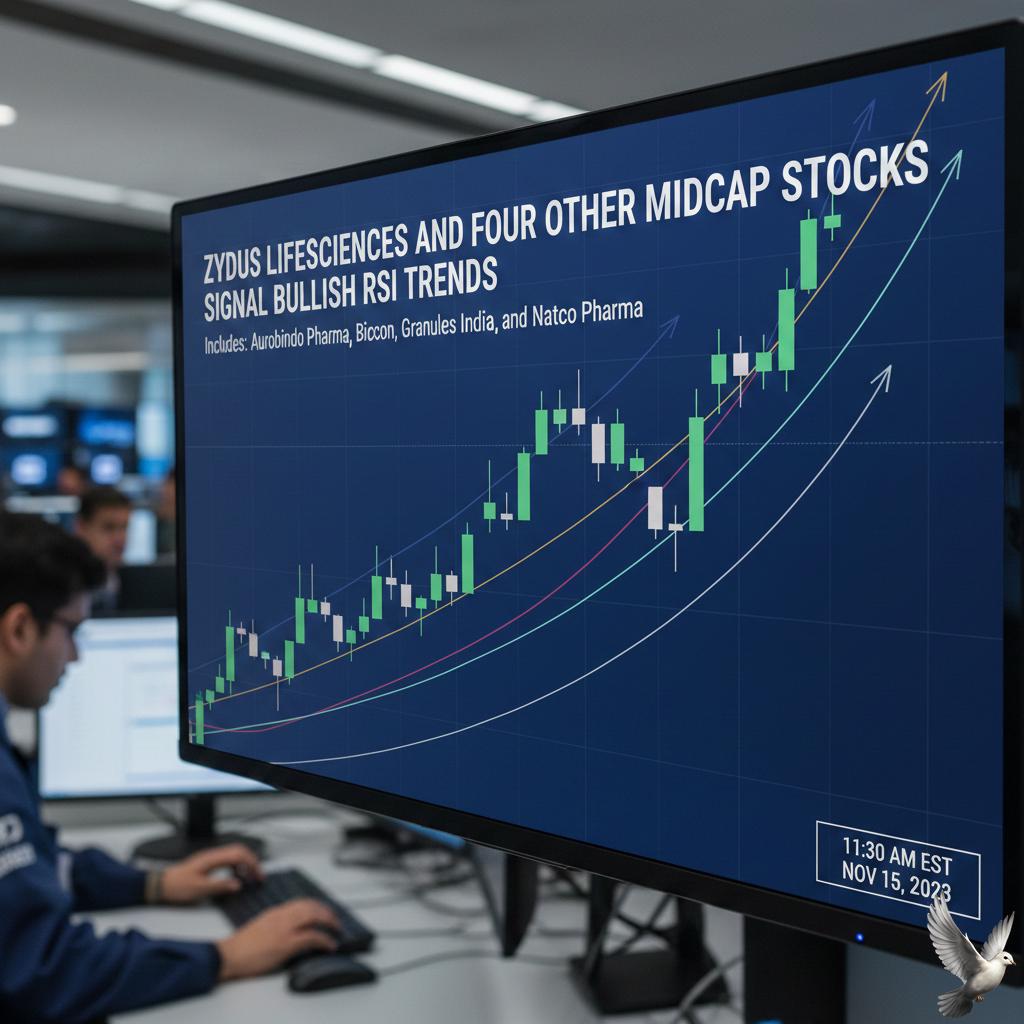
**Zydus Lifesciences and Four Other Midcap Stocks Signal Bullish RSI Trends**
Market performance on **February 13, 2026** reflects a period of heightened volatility and sector-specific shifts. Global equities are currently navigating a complex environment shaped by rapid advancements in artificial intelligence and shifting trade policies. In the United States, the **S&P 500** recently closed at **6,832.76**, marking a decline of **1.57%**. The **Nasdaq Composite** saw a sharper drop of **2.03%** to finish at **22,597.15**, driven largely by aggressive profit-taking in the technology sector as investors reassess the long-term impact of AI disruption on corporate margins. The **Dow Jones Industrial Average** also trended lower, closing at **49,451.98**, down **1.34%**. This "risk-off" sentiment is echoed across Asian markets, with the **Nikkei 225** opening down **0.77%** at **57,197.33** and the **Hang Seng Index** falling **1.45%** to **26,640.16**. Indian markets show a similar pattern of cautious consolidation. The **Nifty 50** sits at **25,807.20**, while the **Sensex** is at **83,674.92**. Technical analysts are closely watching the **26,000** level for the Nifty, noting that a sustained move above this threshold is required to trigger a fresh leg of the uptrend. From a technical perspective, the **Relative Strength Index (RSI)** remains a critical tool for gauging this momentum. An uptrend signal is fundamentally confirmed when the RSI value crosses above **50** from below. This crossover indicates that buying pressure is beginning to outweigh selling pressure, marking a transition into a bullish zone. Current technical setups for several blue-chip stocks show the RSI rebounding from mid-range support. For example, specific entries are being identified where the daily **14-period RSI** is sustaining above its **9-period average**, reinforcing positive bias even amid broader market swings. Commodities are experiencing their own set of pressures. **Gold** prices are currently hovering between **₹1,50,000** and **₹1,58,000** on the MCX. **Silver** has shown more significant movement, trading near the **₹2,40,700** per kg mark, up roughly **1.80%** as it benefits from renewed industrial demand and a multi-year bullish outlook. Oil markets remain sensitive to geopolitical tensions and supply disruptions in North America. **North Sea Dated crude** is trading near **$73** per barrel. Meanwhile, the cryptocurrency sector is seeing a concentration of capital into major assets, with **Bitcoin** facing liquidity tightening as the U.S.-Japan yield spread narrows below the **1%** level. Trade dynamics are also shifting the competitive map. New tariff adjustments have made certain imports, such as Italian rice, nearly **12%** cheaper in the U.S. market, while others have become significantly more expensive. These macroeconomic shifts are expected to influence sourcing decisions and trade flows throughout the remainder of **2026**.

Indian Equities Viewed as Attractive Relative to 2024 Peaks Despite Potential Further Downside
Market Outlook: Resilience and Rebound The Indian equity markets have entered a phase of constructive stability following a period of heightened volatility. As of February 2026, the **Nifty 50** is hovering near the **26,000** mark, while the **Sensex** remains steady above **83,500**. This recovery is underpinned by a "Neutral" stance from the Reserve Bank of India, which has maintained the repo rate at **5.25%**. The cooling of valuations is increasingly positioning India as a preferred destination for emerging market capital. After a period of selling, Foreign Portfolio Investors (FPIs) have returned as net buyers, injecting approximately **$897 million** in the first week of February alone. This shift is largely driven by a significant Indo-US trade deal targeting **$500 billion** in bilateral trade, which has bolstered global investor sentiment. Corporate Earnings and Sectoral Shifts Earnings growth is showing a notable revival across diverse sectors. Corporate India is projected to deliver earnings growth of approximately **10% to 14%** for the 2026 fiscal year. In the recent third-quarter results, manufacturing and services recorded growth rates of **9.1%** and **9.2%** respectively. Consumption-linked sectors are leading the charge. Companies in the FMCG and Auto segments have reported revenue jumps ranging from **8% to 23%**, supported by stable rural demand and festive spending. Private consumption remains a cornerstone of the economy, currently contributing to a real GDP growth estimate of **7.4%** for the current fiscal year. Broader Opportunities in Commodities Market participants are looking beyond traditional safe havens like gold and silver. While gold remains structurally supported near **$5,000**, interest is rotating toward industrial metals. Copper and aluminum are expected to see upside potential of **20% to 30%** through 2026, fueled by global demand for electric vehicles and renewable energy infrastructure. Energy prices offer a different narrative. Brent crude is forecasted to average around **$62 to $67** per barrel, providing a significant cost cushion for Indian industries. This downward trend in energy input costs acts as a tailwind for corporate margins, which are expected to stay healthy between **20% and 22%**. Mid and Small-Cap Dynamics The valuation gap between large-cap and smaller-cap segments is narrowing after a sharp correction in early 2026. The **BSE Smallcap** index recently shed over **7%**, bringing trailing price-to-earnings multiples down to a more sustainable **25x–26x** range. Despite the recent drawdowns, earnings visibility in the mid-cap segment remains robust, with some analysts projecting growth exceeding **20%** for specific high-quality businesses. Investors are increasingly focusing on stock-specific opportunities where business models offer high certainty, particularly in sectors like media, specialty chemicals, and real estate.

Hindalco Shares Volatile Following 45% Year-over-Year Decline in Q3 Net Profit
Hindalco Industries has demonstrated significant operational resilience, reporting a 60% year-on-year surge in consolidated net profit to 3,735 crore for the December quarter. This performance sharply contrasts with previous downturns and was driven by record-breaking results in its domestic Indian business. Consolidated revenue for the period rose to 58,390 crore, reflecting a steady 11% expansion. The company’s Indian aluminum upstream segment achieved an all-time high EBITDA of 4,222 crore, a 73% increase supported by lower input costs and industry-leading margins of 42%. The copper business also provided a strong anchor, with EBITDA growing 18% to 777 crore. Domestic sales remained robust as the company secured the Copper Mark-JDDS accreditation for sustainable production, marking a first for any Indian firm in the sector. Novelis, Hindalco’s U.S.-based subsidiary, faced a more complex quarter. Its revenue grew 4% to 4.1 billion USD, but adjusted EBITDA fell 19% to 367 million USD. Operations were hampered by two fires at the Oswego, New York plant in late 2025, which caused a 72-kilotonne reduction in shipments. Restoration at the Oswego hot mill is progressing, with a restart now projected for late Q2 2026. Despite these short-term capacity constraints, Novelis received a 750 million USD equity contribution in December to bolster liquidity, which stood at 2.6 billion USD at year-end. In the markets, Hindalco’s stock is trading near 965 INR as of mid-February 2026, showing a year-to-date gain of approximately 9%. The stock recently hit a 52-week high of 1,029.80 INR, supported by a healthy net debt-to-EBITDA ratio of 1.33x. Global aluminum prices have shown volatility but remain at elevated levels compared to 2024. LME cash settlement prices currently hover around 3,098 USD per tonne. While base metals saw a slight correction from January peaks, tight inventories and supply caps in China continue to support the long-term pricing floor. Future growth remains focused on aggressive domestic expansion. Hindalco is moving forward with a 21,000 crore smelter expansion and a 4,500 crore project in Odisha. These initiatives, combined with high demand from the solar and electric vehicle sectors, position the company to leverage the ongoing shift toward clean energy infrastructure.

NSE Trading Accounts Reach 25 Crore Following Rapid Growth
NSE Market Update: Milestone Achievement The National Stock Exchange (NSE) has reached a historic peak as total investor accounts officially surpassed the **25 crore** mark in February 2026. This surge highlights a rapid acceleration in retail participation, with the most recent **1 crore** accounts added in just the last two months. The expansion is driven by a maturing digital ecosystem and the rise of low-cost fintech platforms. Currently, the unique registered investor base stands at **12.7 crore**, as many participants maintain multiple accounts across different brokerage firms. Regional Performance and Demographics Maharashtra continues to lead the national landscape with **4.2 crore** accounts, representing nearly **17%** of the total base. Uttar Pradesh holds the second position with **2.8 crore** accounts (**11.3%**), followed by Gujarat with **2.2 crore** (**8.7%**). The investor profile is becoming notably younger, with the median age now at **33 years**. Approximately **40%** of all investors are now under the age of **30**, while female participation has grown to represent **one in every four** investors on the exchange. Market Value and Ownership Trends Retail investors have solidified their influence on the market, now holding a **22-year high** of **18.75%** of the total market capitalization of NSE-listed companies. In value terms, this individual ownership accounts for approximately **₹83.6 trillion**. While foreign portfolio investors (FPIs) have seen their share dip to a **15-year low** of **16.9%**, domestic liquidity remains robust. Systematic Investment Plan (SIP) inflows have scaled to an average of **₹27,464 crore** per month, providing a steady cushion against global volatility. Indices and Economic Outlook The Nifty 50 has demonstrated resilience, trading near the **25,800** level as of mid-February 2026. Domestic fundamentals remain strong, supported by an expected GDP growth rate of over **7%** for the current fiscal year. Market capitalization for all NSE-listed firms has reached approximately **₹473 lakh crore** (roughly **$5.22 trillion**). Despite global trade uncertainties, the "financialization" of Indian household savings continues to deepen, with investors now active across **99.85%** of the country's pin codes.

HUL Q3 Net Profit Declines 30% to Rs 2,118 Crore
Hindustan Unilever Limited (HUL) has navigated a complex third quarter for FY26, characterized by a massive surge in reported bottom-line figures contrasted against cooling core profitability. The FMCG giant reported a 121% jump in total net profit to 6,603 crore, though this figure was heavily inflated by a one-time exceptional gain of approximately 4,611 crore following the successful demerger of its ice cream business. While the headline growth appears robust, the underlying business from continuing operations told a different story. Net profit from core operations fell 30% to 2,118 crore. This decline was largely attributed to a 576 crore exceptional loss, primarily stemming from the implementation of new labor codes and associated liability adjustments. Revenue performance remained steady with a 6% increase to 16,235 crore. Growth was driven by a 4% rise in underlying volumes and a 5% increase in underlying sales. The Beauty & Wellbeing segment emerged as a standout performer, posting 11% growth fueled by premiumization and successful launches in the prestige beauty and haircare categories. Profitability margins faced significant pressure during the quarter. The EBITDA margin contracted by 70 basis points to 23.3%, down from 24% in the same period last year. This compression reflects higher advertising and promotion spends, which rose 2.4% to 1,522 crore, alongside rising input costs in specific commodity baskets and strategic investments in digital-first channels. Segment-wise, Home Care saw a 3% revenue rise, while Foods and Refreshments grew by 6%. The company’s Personal Care division saw more modest gains of 1% as it contended with a deflationary pricing environment in certain categories. Despite these pressures, management noted that Home Care achieved its highest-ever market share during this period. Market reaction to the results was cautious. Shares of HUL fell by roughly 3.6% following the announcement, touching an intraday low of 2,350. Investors remain focused on the stagnation of core operating profits and the sustainability of margins as competition from quick commerce and direct-to-consumer brands intensifies. Looking toward the next fiscal year, HUL anticipates a stronger FY27. This optimism is supported by early signs of consumption recovery and a more stable macroeconomic backdrop. The company is actively reshaping its portfolio, recently approving the 100% acquisition of OZiva to strengthen its footprint in the high-growth health and wellbeing sector. The broader FMCG sector is showing signs of a revival in the second half of the year. Rural demand continues to outperform urban growth, expanding at 7.7% compared to 3.7% in cities. With easing inflation and supportive government policies, the industry is eyeing high single-digit volume growth as it moves into the final quarter of the financial year.
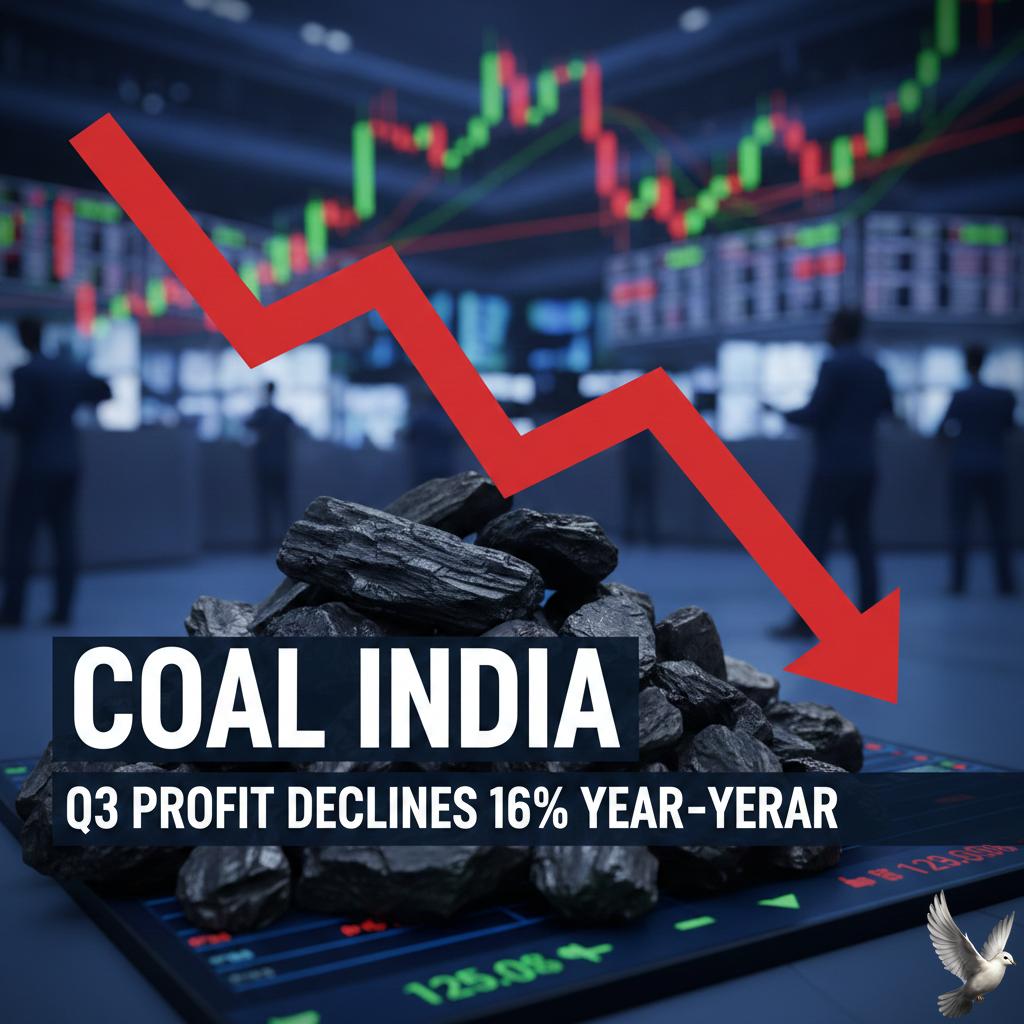
Coal India Q3 Profit Declines 16% Year-over-Year
Coal India reported a notable decline in its financial performance for the third quarter of the 2026 fiscal year. Consolidated net profit fell by **16%** year-on-year to **7,166 crore**, compared to **8,506 crore** in the same period last year. This contraction was largely attributed to a one-time provision of **2,201 crore** for employee pay revisions and a drop in overall sales volumes. Revenue from operations also faced pressure, sliding **5%** to **34,924 crore**. The company's total expenses for the quarter rose to **28,132 crore**, up from **27,280 crore** a year earlier. This increase in costs, combined with softer coal offtake, weighed heavily on the bottom line. During the April-December period, production stood at **529.19 million tonnes**, trailing behind the **543.36 million tonnes** produced in the previous year. Despite the earnings dip, the board declared a third interim dividend of **5.50 per share**. This follows previous payouts of **5.50** and **10.25** earlier in the fiscal year, maintaining the firm's reputation for strong shareholder returns. The record date for this latest dividend is fixed for **February 18, 2026**, with payments expected by mid-March. The shareholding structure saw a strategic shift during the December quarter. Foreign Institutional Investors (FIIs) increased their stake from **7.96%** to **8.22%**. Conversely, Mutual Funds reduced their exposure, with holdings dropping from **10.06%** to **9.04%**. The Government of India remains the dominant promoter, maintaining a steady **63.13%** stake in the Maharatna PSU. Market performance for the stock remains mixed. As of mid-February 2026, the share price is hovering around **419**, roughly **9%** below its 52-week high of **461.55**. Technical indicators reflect a neutral to mildly bearish momentum in the short term. While the daily moving averages show some resilience, the monthly MACD has turned cautious, signaling a potential plateau in price growth. Broad sector trends indicate that while thermal coal demand for power remains a primary driver, the industry is navigating a structural transition. India's coal output has crossed the **1 billion tonne** milestone, yet the sector faces emerging competition from renewable energy and a shift toward market-based pricing regimes. Future earnings will likely depend on the company's ability to manage rising operational costs and stabilize production levels amid these evolving energy dynamics.
Infosys and Wipro Shares Face Potential 10% Decline Following ADR Performance
Market Brief: AI Disruption Rattles Indian IT Indian IT giants **Infosys** and **Wipro** are facing intense selling pressure following a sharp decline in their American Depository Receipts (**ADRs**). Over the last 48 hours, **Infosys ADRs** plunged as much as **10%** to hit **$14.21**, while **Wipro** dropped roughly **5%** to **$2.28**. The sell-off was triggered by **Anthropic’s** launch of **Claude Cowork**, a suite of agentic AI plugins. Unlike previous tools, this platform is designed to autonomously execute high-level professional tasks including legal contract reviews, financial modeling, and complex code refactoring. Sector Impact and Market Value The **Nifty IT Index** has entered bear market territory, sliding more than **12.5%** since the start of **2026**. In a single session this week, the index tanked **5.5%**, marking its steepest one-day correction in nearly four years. Investor anxiety centers on the potential erosion of the traditional labor-intensive outsourcing model. Estimates suggest that advanced automation could eliminate **9% to 12%** of IT services revenue over the next four years as clients pivot toward autonomous AI agents for routine professional workflows. Performance Highlights * **Infosys:** Shares fell nearly **6%** on domestic exchanges, mirroring the **8.2%** overnight drop in its US-listed counterpart. * **Wipro:** Currently trading near its **52-week low** of **₹218**, with a year-on-year return down over **29%**. * **TCS:** Hit a **52-week low** of **₹2,776** as the broader sector sell-off erased approximately **₹2.5 lakh crore** in market capitalization. Economic Headwinds Beyond technology shifts, macro factors are compounding the pressure. Strong **US jobs data** from January 2026 has dampened hopes for imminent interest rate cuts by the **Federal Reserve**. Higher-for-longer rates typically compress valuations for growth-oriented sectors like IT. With nearly **60%** of revenue originating from the US market, Indian firms are highly sensitive to these shifts in American enterprise spending and monetary policy. Strategic Outlook While the "death of the pyramid" model is being debated, industry analysts note that the impact is bifurcated. Firms are now being valued based on their "AI-native" capabilities rather than headcount. The upcoming **India AI Impact Summit** in mid-February is expected to be a critical pivot point for leadership to address how they will integrate these autonomous tools to maintain competitive moats.

Wipro Share Price: Analysis of Recent Return Trends
Market Brief: February 13, 2026 Global equity markets are navigating a period of heightened volatility as technology-led selling in the U.S. spills over into Asian and domestic sessions. Sentiment remains cautious as investors digest a heavy stream of corporate earnings and shifting interest rate expectations. Equity Benchmarks and Performance Indian indices closed the previous session in the red, with the **BSE Sensex** dropping **558.72 points (0.66%)** to finish at **83,674.92**. The **Nifty 50** followed suit, sliding **146.65 points (0.57%)** to settle at **25,807.20**. Early indicators from the **GIFT Nifty** suggest a continued gap-down start, recently trading near **25,719**, a discount of over **130 points**. Technical indicators show a weakening trend, with **14 major stocks** recently breaking below their **200-day Moving Average (DMA)**. Key names like **LTIMindtree (LTP: ₹5,211.5)** and **Hindustan Unilever (LTP: ₹2,409.7)** are currently trading below these long-term support levels. Commodity and Currency Pulse Precious metals have seen significant corrections. **Spot Gold** is holding near **$4,926.79 per ounce** after a sharp **3.2%** decline in the previous session. In domestic markets, **24-karat gold** is priced at **₹1,58,390 per 10 grams**, while **silver** is trading at **₹295.10 per gram**. The energy sector shows marginal recovery, with **Brent Crude** rising slightly to **$67.58 per barrel** and **WTI** at **$62.91**. However, both are on track for their first back-to-back weekly drop of the year. The **Indian Rupee** continues to face pressure, currently positioned near **90.61** against the U.S. Dollar. Macro Indicators and Corporate News India's retail inflation, under the new **2024 base year**, rose to **2.75%** for January 2026. Despite this uptick, **Moody’s** maintains a positive outlook, projecting real **GDP growth of 6.4%** for the upcoming fiscal year, the fastest among G-20 nations. The **Defence Acquisition Council** has recently cleared capital acquisition proposals worth **₹3.60 lakh crore**, covering Rafale jets and P8I aircraft, which is expected to provide a long-term tailwind for the defense industrial base. Key Stocks in Focus * **Coal India:** Reported a **16% YoY decline** in Q3 net profit to **₹7,166 crore**. * **Muthoot Finance:** Strong performance with standalone profit nearly doubling to **₹2,656 crore**. * **Hindalco:** Faced a massive **₹2,610 crore** exceptional loss, impacting Q3 bottom lines despite revenue gains. * **Earnings Today:** Over **15 companies**, including **Torrent Pharma, Siemens Energy, and Ola Electric**, are scheduled to report quarterly results today.

HAL Q3 Net Profit Increases 30% to Rs 1,867 Crore with Margin Expansion
Hindustan Aeronautics Limited (HAL) has delivered a commanding performance in the third quarter of the 2025-26 fiscal year. The defence major reported a consolidated net profit of **1,867 crore**, marking a significant **30%** year-on-year increase. This growth reflects the company’s transition from securing massive orders to a high-intensity execution phase. Revenue from operations climbed **11%** to reach **7,699 crore**, supported by a steady ramp-up in deliveries for existing defence programs. Operating efficiency remained a highlight as EBITDA rose **11.2%** to **1,871 crore**, maintaining a stable margin of **24.3%**. In a major move to reward shareholders, the Board has declared a first interim dividend of **35 per share**. The record date for this payout is set for **February 18, 2026**, with payments expected to be processed by mid-March. The company's order book remains one of the strongest in the sector. Following the recent **62,370 crore** contract for 97 Light Combat Aircraft (LCA) Mk1A jets, HAL’s total order position is projected to hit **1.10 lakh crore** by the end of the year. This momentum is further bolstered by a new **2,312 crore** contract from the Ministry of Defence for eight Dornier 228 aircraft intended for the Indian Coast Guard. Addressing recent concerns over delivery timelines, HAL confirmed that **five LCA Mk1A** fighter jets are fully ready for handover. Additionally, **nine** more aircraft have been built and flight-tested. These remaining units are currently awaiting the arrival of F404 engines from GE Aerospace to complete final delivery. Market sentiment for the stock remains positive despite recent volatility. As of February 12, 2026, the share price closed at **4,178.80**, reflecting a **1.11%** gain following the earnings announcement. Analysts maintain a bullish outlook, with average price targets ranging between **5,000 and 5,760**, citing the company’s monopoly in domestic fighter production and the government’s **7.85 lakh crore** defence budget allocation. The broader sector is shifting toward indigenization, with **75%** of the latest capital acquisition budget reserved for domestic procurement. As HAL expands its production capacity in Nashik and Bengaluru to **24 aircraft per year**, it remains the primary beneficiary of India's push for strategic autonomy in aerospace.

SpiceJet Reports Q3 Net Loss of Rs 261 Crore Despite 14% Revenue Growth
SpiceJet has released its financial results for the third quarter of fiscal year 2026, revealing a complex landscape of recovery efforts and persistent cost pressures. The airline reported a net loss of 268 crore for the quarter ending December 2025. While the figures show a shift from the profitability seen in previous years, they represent a significant sequential improvement. The net loss narrowed from 635 crore in the preceding quarter, indicating that the carrier's turnaround strategy is beginning to take hold. Operational revenue for the quarter reached 1,384 crore, marking an impressive 77% increase on a quarter-on-quarter basis. This growth was supported by a strong passenger load factor of 90%, reflecting resilient demand for the budget carrier despite a competitive market. Financial stability remains a primary focus. SpiceJet recently eliminated 442 crore in liabilities through a major debt restructuring exercise. This involved allotting over 10 crore equity shares to aircraft lessors, effectively converting debt into equity and strengthening the balance sheet. The airline is aggressively expanding its capacity to capture market share, which rose to 4.3% by December 2025. The fleet has been bolstered with the addition of 16 aircraft, and there are active plans to introduce up to 100 more daily flights to meet peak travel demand. Market performance, however, reflects ongoing volatility. As of mid-February 2026, SpiceJet’s share price has faced significant downward pressure, recently touching a 52-week low near 20.25. The stock has declined by approximately 53% over the past year. Technical indicators suggest the stock is currently in oversold territory. The Relative Strength Index (RSI) has dipped to approximately 22.9, while the Money Flow Index (MFI) sits at 25.6. Both figures are well below the 30-mark threshold, which typically suggests a potential for a technical rebound. The airline is also moving forward with its goal to list on the National Stock Exchange (NSE), a move intended to enhance liquidity and investor accessibility. This follows a successful 3,000 crore fund infusion through a Qualified Institutional Placement (QIP) earlier in the fiscal year. External factors continue to influence the bottom line. Although aviation turbine fuel (ATF) prices saw a modest decrease of about 1% in early February, fuel remains a dominant expense, accounting for nearly 40% of total operating costs. Regulatory challenges also persist, with airlines currently contesting new cabin crew rest norms which could impact operational flexibility and costs. Despite these hurdles, the combination of a leaner debt profile and an expanding fleet positions SpiceJet for a critical transition period in the coming months.

Investors Pivot to Asian Equities Amid AI-Driven Volatility in US Markets
Global Market Brief: The AI Infrastructure Shift The global investment landscape is witnessing a significant divergence as market participants pivot from software-centric AI pioneers toward the physical infrastructure powering the revolution. While U.S. benchmarks grapple with volatility, Asian markets are demonstrating notable resilience. The **MSCI Asia Pacific Index** has surged more than **12%** in **2026**, outperforming major American indices. In contrast, the **S&P 500** has seen marginal year-to-date losses of **0.2%**, while the tech-heavy **Nasdaq 100** has retreated by approximately **2%**. Software Disruption vs. Hardware Dominance The sell-off in U.S. equities is largely driven by fears that advanced AI agents are beginning to displace traditional enterprise software. The **S&P 500 Software & Services Index** has plummeted **18.6%** so far this year. Investors are increasingly wary of "downstream" companies whose business models face disruption by automated AI workflows. Conversely, "upstream" players in Asia—the foundries and memory chipmakers—are benefiting from a "winner-takes-all" infrastructure boom. Leading hyperscalers like Amazon, Microsoft, and Google have projected nearly **$600 billion** in AI infrastructure spending for **2026**, representing a **75% to 80%** increase from the previous year. Key Regional Powerhouses The shift in capital has turned the spotlight on the world's primary hardware suppliers: * **TSMC**: The world’s leading contract chipmaker maintains an irreplaceable role, commanding a **70%** market share. With the mass production of **2nm** technology underway, TSMC’s market capitalization has surpassed **$1 trillion**. Analysts project its revenue growth could reach **30%** by the end of the year. * **Samsung Electronics**: Along with other regional giants, Samsung is capitalizing on a massive surge in memory demand. The market for **High Bandwidth Memory (HBM)** is expected to double, reaching **$68 billion** by the end of **2026**. Memory Pricing and Market Indicators Tightness in the supply chain has triggered substantial price hikes. Consumer memory prices, including **DDR4** and **DDR5**, rose nearly fourfold in late **2025**. Experts anticipate further spikes of up to **50%** through the first half of **2026**. South Korea’s **KOSPI** and Japan’s **Nikkei 225** remain in bullish structures, buoyed by this semiconductor super-cycle. Despite broader economic concerns, the Asia-Pacific region now holds a **51%** share of the global semiconductor market, valued at approximately **$659.66 billion** for the current year. Investors are essentially treating Asian chipmakers as the "strategic utilities" of the new economy. While software valuations are being reset amid fears of AI-driven obsolescence, the hardware required to run these models continues to command record-high pricing and unprecedented demand.