Bullish News
Collection
**Precious Metals Rebound as Technical Buying Drives Recovery From Weekly Lows**
Precious metals markets are witnessing a period of high intensity as of Friday, February 13, 2026. Following a week of significant price swings, gold and silver are attempting to find a floor after a sharp sell-off triggered by a resilient U.S. labor market. Spot gold is currently hovering near **$4,980 per ounce**, a notable decline from the record highs above **$5,600** seen earlier this year. In domestic markets, 24-carat gold is trading at approximately **₹15,854 per gram**, or **₹158,540 per 10 grams**. This follows a massive single-day plunge where prices dropped by more than **3%** in a matter of hours. Silver has faced even steeper volatility, with futures crashing nearly **9%** on Thursday before stabilizing on Friday. Current silver prices are holding around **$76.50 per ounce** globally. In local markets, silver is priced near **₹2,95,100 per kilogram**, reflecting an aggressive unwind of leveraged positions after the metal's historic rally in 2025. The primary catalyst for this recent volatility was the January U.S. employment report, which showed the economy added **130,000 jobs**—far exceeding the forecasted **70,000**. The unemployment rate unexpectedly fell to **4.3%**, signaling a labor market that remains far tighter than the Federal Reserve anticipated. This data has forced a rapid repricing of interest rate expectations. Markets have slashed the odds of a March rate cut to just **8%**, down from **20%** prior to the jobs report. Investors are now pushing back expectations for the first full **25-basis-point** cut to July, supporting a rebound in the U.S. Dollar Index to the **97.00** level. Despite the recent liquidations, the long-term structural bull case for bullion remains intact. Central bank demand continues to provide a massive floor for the market, with institutions expected to purchase an average of **585 tonnes** per quarter throughout 2026. Several major banks maintain year-end price targets for gold between **$5,400** and **$6,000 per ounce**. Attention now shifts to the upcoming Consumer Price Index (CPI) report. Analysts expect headline inflation to cool from **2.7%** to **2.5%**. If the data confirms a moderating trend, it may revive bets on earlier rate cuts and provide the necessary spark for a gold and silver rebound. For now, the gold-to-silver ratio remains high at roughly **85:1**, signaling that gold continues to outperform its more industrial counterpart in this volatile environment.

PAN HR Solutions IPO to List Today: GMP Trends and Market Expectations
Thinkink Picturez Limited, an established entertainment provider in the Indian market, continues to navigate a volatile landscape following its historical capital raising activities. The company, which operates across film, television, and web content, recently confirmed a board meeting scheduled for February 14, 2026, to review and approve its unaudited financial results for the quarter ending December 2025. As of February 12, 2026, the company’s stock is trading at approximately 0.19 to 0.20 on the BSE. This current pricing reflects a significant adjustment over the last year, with the stock experiencing a 52-week high of 0.40 and a low of 0.18. The market capitalization of the firm currently stands at roughly 27.02 crore. Investor sentiment remains mixed as the stock has faced downward pressure, declining by more than 50% over the past twelve months. Despite these headwinds, technical indicators show the stock is currently trading at a fraction of its book value, which is estimated at 1.73 per share. The company’s historical IPO, valued at 17.04 crore, was notably oversubscribed 11.85 times. This initial demand was driven largely by Non-Institutional Investors at 25.41 times, followed by retail participants at 8.99 times and Qualified Institutional Buyers at 6.57 times. Since then, the company has utilized various corporate actions to manage its equity base, including a 11:5 rights issue in late 2024 at a price of 1.50 per share and a 2:1 bonus issue in early 2025. Financially, the company has maintained a nearly debt-free balance sheet, though it has reported recent quarterly net profits in a narrow range of 0.02 crore. Revenue for the trailing twelve months is estimated at 10 crore, showing a shift in scale compared to previous years. Operating margins have seen sharp fluctuations, with some quarters reaching 26.67% while others dipped into negative territory during high-expenditure phases. The upcoming financial disclosure on February 14 is expected to provide critical clarity on current sales growth and the impact of recent content investments. Market participants are closely watching the 0.22 resistance level, which currently serves as the upper circuit limit. On the downside, the 0.16 level marks the immediate support zone in the current trading environment. The shareholder pattern shows a dominant retail presence, with public holding accounting for over 99% of the equity.

Biopol Chemicals IPO: GMP and Listing Preview
Market performance for Indifra Limited shows a significant transition from its initial public offering to current trading levels. The company, which operates in the infrastructure management and electrical appliance distribution sectors, has navigated a volatile landscape since its listing on the NSE SME exchange. The Rs 14.04 crore IPO was originally priced at Rs 65 per share. During its bidding period, the issue saw robust demand, closing with an overall subscription of 7.21 times. The retail segment showed the highest enthusiasm at 12.07 times, followed by non-institutional investors at 2.34 times. As of mid-February 2026, Indifra’s stock price is trading significantly lower than its debut levels. The shares are currently quoted at approximately Rs 14.40. This reflects a substantial correction from the issue price, with the stock experiencing a one-year return of roughly -22.58%. The market capitalization now stands at approximately Rs 10.94 crore. Financial data for the fiscal year ending March 2025 highlights a recovery in top-line growth. Total revenue reached Rs 12.13 crore, marking a 20.66% increase compared to the previous year. This growth outperformed the three-year average of 3.53%. The company also reported a slim net profit of Rs 0.01 crore, bouncing back from a loss of Rs 1.19 crore in 2024. Current fundamentals indicate a stock trading at 0.58 times its book value of Rs 24.92. While the company maintains a low debt-to-equity ratio, it continues to face challenges with low interest coverage and historically negative cash flows. Its business model remains focused on gas distribution pipeline management for clients like Adani Gas and the distribution of V-Guard electrical products. The broader infrastructure sector in India remains a key focus of the 2026-27 Union Budget. Public capital expenditure continues to rise, specifically targeting transport corridors and digital public infrastructure. While the industry average Price-to-Earnings ratio sits near 35.1, Indifra's high trailing P/E suggests the market is still adjusting its valuation based on recent earnings volatility. Investment patterns for February 2026 show that small-cap infrastructure stocks are sensitive to shifting interest rates and working capital requirements. Investors are closely monitoring the company's ability to scale its asset-light model while improving thin profit margins in a high-volume, competitive trading environment.
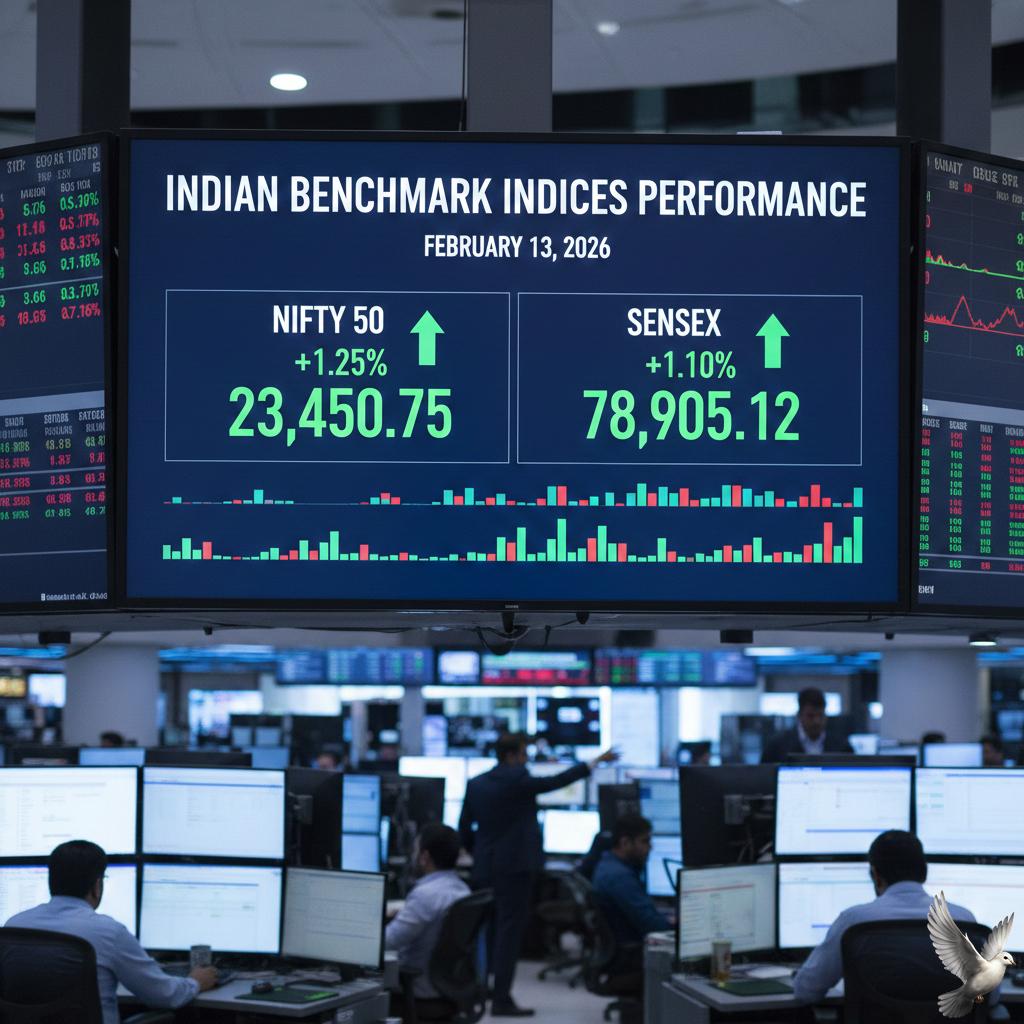
Indian Benchmark Indices Performance on February 13, 2026
Market Overview February 2026 The global economy is navigating a period of decelerating growth, with projections holding at **2.6%** for the year. The United States remains a primary anchor with **1.5%** to **2.0%** expansion, though momentum is softening compared to previous cycles. China is expected to moderate to a **4.4%** – **4.6%** growth rate as domestic property challenges persist and global trade maps reconfigure toward regional hubs. Equity markets are currently defined by a "Great Rotation." Investors are shifting capital away from hyper-growth technology leaders into "real economy" sectors. Value-oriented categories like Industrials, Materials, and Consumer Staples are seeing increased inflows as the market broadens beyond the narrow leadership of 2025. Benchmark Indices and Sector Shifts The **S&P 500** is currently treading water, trading near the **6,832** level as of mid-February. While the index has achieved a **52-week high of 7,002**, recent sessions have shown high volatility and a flat year-to-date return. This stability at the index level masks a significant internal churn. Information Technology has faced pressure, falling roughly **3.8%** recently as "AI fatigue" sets in. Large-cap tech firms like Alphabet have seen single-day drops of **2%** following massive bond sales intended to fund the intensifying infrastructure race. Conversely, Global Small Caps have emerged as a bright spot, surging over **5.4%** earlier this quarter. Energy and Commodities Energy markets are experiencing downward pressure due to a global supply surplus. **Brent Crude** recently settled lower at **$67.52** per barrel, a daily decline of over **2.7%**. **WTI Crude** followed a similar trajectory, closing at **$62.84**. The International Energy Agency has lowered its 2026 demand growth forecast to **850,000 barrels per day**, down from previous estimates of **930,000**. While geopolitical tensions in the Middle East provide a potential price floor, rising inventories—which increased by **8.5 million barrels** last week—continue to weigh on the outlook. Monetary Policy and Interest Rates Central banks are entering a period of divergent policy. The **U.S. Federal Reserve** is expected to maintain a terminal rate between **3.0%** and **3.25%**, with markets pricing in at least two rate cuts later this year. In contrast, the **Reserve Bank of Australia** became the first major mover of the year, hiking its cash rate to **3.85%** to combat persistent **3.8%** inflation. The **Reserve Bank of India** has opted for stability, holding its repo rate at **5.25%** for the first review of 2026. This "neutral" stance is supported by a robust growth outlook of **7.4%** and a breakthrough trade deal with the U.S. that reduced tariffs on Indian imports from **50%** to **18%**. Technology and AI Capex The technology sector is locked in a massive capital expenditure cycle. The top five U.S. hyperscalers are projected to spend over **$700 billion** on AI infrastructure in 2026, a staggering **60%** increase over previous years. This demand is creating a "supercycle" for semiconductors, with global chip revenues expected to hit **$975 billion**. However, this spending is creating bottlenecks. A shortage of memory chips is forecasted to drive up prices, potentially causing a **5%** to **9%** contraction in the global PC and smartphone markets as production costs rise. Enterprise IT spending is nevertheless expected to surpass **$6 trillion** for the first time this year.
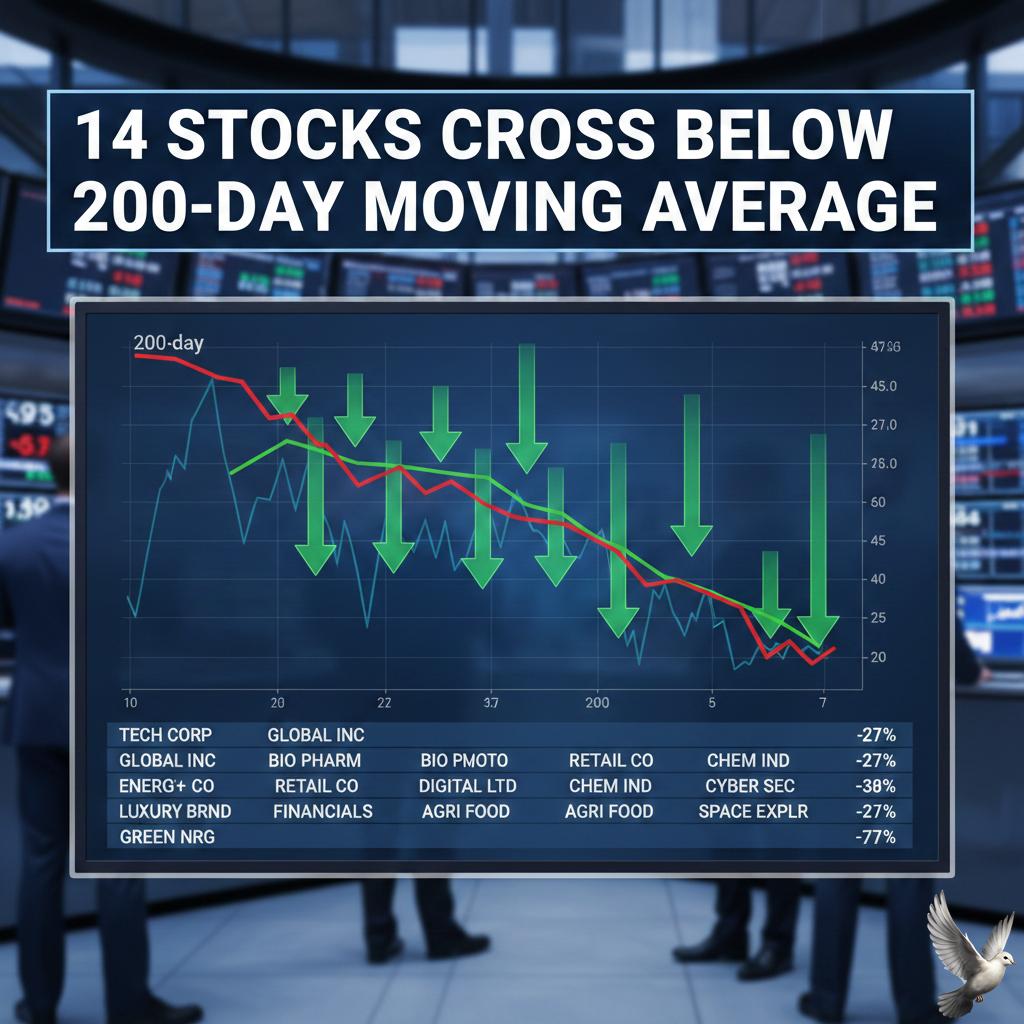
14 Stocks Cross Below 200-Day Moving Average
The Indian equity markets faced significant technical pressure on February 12, as fourteen stocks from the Nifty 500 index slipped below their 200-day moving average (DMA). This breach is a key technical indicator often signaling a shift into a long-term bearish phase. Major names in the IT and FMCG sectors led the downside movement. Tech Mahindra closed at 1,536.60 against its 200 DMA of 1,550.34, while Hindustan Unilever settled at 2,409.70, falling below its long-term average of 2,435.72. LTIMindtree also saw a sharp breach, finishing at 5,211.50 compared to its 200 DMA of 5,488.30. Broader market sentiment was weighed down by a massive sell-off in the IT sector, triggered by global concerns over artificial intelligence disruptions. The Nifty IT index plunged 5.51% in a single session. This volatility pushed benchmark indices lower, with the Sensex falling 558.72 points to end at 83,674.92 and the Nifty 50 declining 146.65 points to 25,807.20. The broader Nifty 500 index reflected this weakness, closing 0.55% lower at 23,651.55. Beyond technology, stocks like Divi's Laboratories, ICICI Lombard, and Pfizer also crossed below their 200 DMA, indicating that the bearish trend is spreading across healthcare and financial services. Economic cues remained mixed as the Reserve Bank of India recently held the repo rate at 5.25%, signaling an end to the current rate-cut cycle. While the GDP growth forecast for FY27 was raised to 6.9%, rising US bond yields and a strengthening dollar have led to cautious institutional flow. Other notable Nifty 500 stocks currently trading below their long-term trend lines include Inox India, Vijaya Diagnostic, and Gujarat State Petronet. Traders typically view these levels as major resistance points for any future recovery attempts. In contrast to the selling pressure, some financial stocks showed resilience. Bajaj Finance and Shriram Finance gained 3.31% and 2.48% respectively, providing a small cushion to the financial index. However, with the India VIX settling at 11.73 and GIFT Nifty signaling further negative openings, the short-term outlook remains sensitive to global tech trends and geopolitical developments.

Japanese Yen Records Largest Weekly Gain in 15 Months
The Japanese yen is experiencing a powerful surge this week, marking its strongest performance in over a year. This dramatic reversal follows a period of historic weakness, as market participants aggressively repriced the nation's economic and political trajectory. A primary catalyst for this rally is the political stabilization following Prime Minister Sanae Takaichi’s landslide victory in the February 8, 2026, general election. Her Liberal Democratic Party (LDP) secured 316 of 465 seats, granting her a powerful mandate to implement a "responsible active fiscal policy." While Takaichi was initially viewed as a monetary dove, her commitment to strategic investment and economic resilience has unexpectedly bolstered confidence in Japan’s long-term stability. Currency markets have responded with conviction. The USD/JPY pair, which traded near 160.00 earlier this year, has retreated significantly, sliding below the 153.00 level. This 1% gain over just two sessions reflects a shift in investor sentiment as the "Takaichi trade"—previously a bet on a weaker yen—is being reassessed. Analysts now project a gradual recovery for the yen toward 145.00 over the next twelve months. Japanese equities are mirroring this optimistic trend. The Nikkei 225 has delivered an exceptional start to 2026, gaining nearly 15% year-to-date. This week, the index briefly breached the historic 58,000 threshold, hitting an intraday record of 58,015. This rally is driven by domestic-oriented sectors and technology firms, fueled by the government’s $135 billion monetary easing and investment package. In the bond market, yields are also on the move. The 10-year Japanese Government Bond (JGB) yield recently touched 2.38%, a 27-year high. These rising yields are attracting capital back to Japan, as the interest rate gap with the United States begins to narrow. The Bank of Japan has signaled it will continue to normalize policy, with the short-term rate currently at 0.75%, the highest in three decades. While the outlook remains positive, investors are watching for potential headwinds. High public debt, currently at 230% of GDP, and persistent inflation remain key concerns. However, for the first time in years, a rare synchronized rally in the yen, stocks, and bonds suggests that Japan has emerged as a premier global investment destination.

Philip Fisher on Price vs. Value in the Stock Market
Market dynamics in early 2026 continue to validate Philip Fisher’s core philosophy: price and value are rarely the same. While global indices grapple with short-term swings, disciplined investors are finding opportunities in the gap between market noise and business fundamentals. **Global Indices and Volatility** The US market recently displayed a 5% discount to fair value estimates, reflecting a cautious but opportunistic environment. Despite a 1.5% rise in major indices during January, the VIX "fear gauge" remains active, having climbed by an average of 5.5% as investors react to shifting interest rate expectations. The S&P 500 recently hovered near 6,940, while the Dow Jones maintained a position above 50,000. These figures highlight a market that is resilient yet sensitive to high-voltage data releases, particularly regarding labor and inflation. **Growth and Sector Dispersion** Growth stocks have entered a period of significant valuation dislocation, currently trading at a 12% discount. In contrast, value and core stocks are trading much closer to their intrinsic fair values. Technology remains a primary driver of this dispersion. While certain mega-cap leaders continue to dominate, the "AI premium" is being scrutinized more heavily. This has led the tech sector to trade at a 16% discount, down from 11% just a month ago, as the market resets expectations for sustainable earnings. **Macro Economic Indicators** Global GDP growth is projected to hold steady at 3.3% for 2026. However, central bank policy remains a focal point. With US inflation edging closer to 3%, markets are pricing in a terminal interest rate between 3.0% and 3.25%. The labor market is showing signs of cooling, with hiring downshifting and the underemployment rate rising to 8.7%. This softening of labor, combined with large fiscal deficits, creates a complex backdrop where "real economy" positions are beginning to attract capital away from pure momentum trades. **Emerging Market Resilience** India and other emerging markets are becoming critical growth engines, with India expected to contribute 18% to global GDP expansion over the next five years. Domestic institutional investors have shown significant absorption capacity, often offsetting foreign outflows, with net inflows recently reaching 686 crore in a single session. **Strategic Focus for Investors** Success in this "investor’s market" requires looking past the 20-session averages and focusing on scalable models. Businesses with durable cash flows and clear plans to harness productivity gains—potentially lifting earnings by as much as 31% through cost restructuring—are positioned to lead. Market participants are increasingly moving away from "putting chips on the table" toward a rigorous assessment of balance sheets and management quality. By prioritizing intrinsic value over fleeting price movements, long-term success remains achievable despite the current volatility. [Market Outlook for February 2026](https://www.youtube.com/watch?v=akn48UBqyDk) This video provides a comprehensive breakdown of the macro pressures and sector trends shaping the investment landscape this month. http://googleusercontent.com/youtube_content/0

Market Update: Pre-Market Analysis and Trade Setup
Indian markets are navigating a volatile landscape as the Q3 earnings season draws to a close today, **February 13, 2026**. Benchmark indices recently faced significant pressure, with the **Sensex** dropping **559 points** (0.66%) to settle at **83,675**, while the **Nifty 50** slid **146 points** (0.57%) to close near **25,807**. Volatility is rising slightly as the **India VIX** climbed **1.52%** to reach **11.73**. Despite the recent dip, the Sensex remains up approximately **9.9%** year-on-year, buoyed by strong domestic sentiment and a resilient macro economy. Institutional Flows and Inflation Market dynamics are being shaped by a tug-of-war between institutional investors. **Foreign Institutional Investors (FIIs)** have shown a cautious but selective buying trend, recording net purchases of **944 crore** in recent sessions. **Domestic Institutional Investors (DIIs)** continue to act as a primary cushion, contributing over **125 crore** in net buying. Investor focus is shifting heavily toward today's **CPI inflation** data. Retail inflation for January was recorded at **2.75%**, a figure that will guide future central bank policy. Sector Performance and Earnings The IT sector is experiencing a sharp downturn, triggered by global tech disruptions and weak performance in US-listed ADRs. Heavyweights like **Infosys** and **Wipro** saw declines of over **5-7%** in international markets, weighing heavily on domestic sentiment. In contrast, specific earnings reports are driving stock-level outperformance: * **ONGC** reported a **23%** profit jump to **11,946 crore**. * **Muthoot Finance** doubled its standalone profit to **2,656 crore**. * **Coal India** saw a **16%** decline in net profit to **7,166 crore**, yet declared an interim dividend of **5.50 per share**. * **Zaggle Prepaid** posted an **84%** profit surge. Global and Trade Tailwinds Sentiment is supported by progress in the **India-U.S. interim trade framework**. Reports suggest India may secure zero-duty access for textiles by late March, providing a competitive edge over regional peers. However, external factors remain fluid. Brent crude prices have nudged higher toward **$69.74 per barrel** amid renewed geopolitical concerns. While the rupee is currently trading near **90.52** against the dollar, strong domestic SIP inflows—totaling over **30,000 crore** in January—provide a robust liquidity floor for Indian equities.
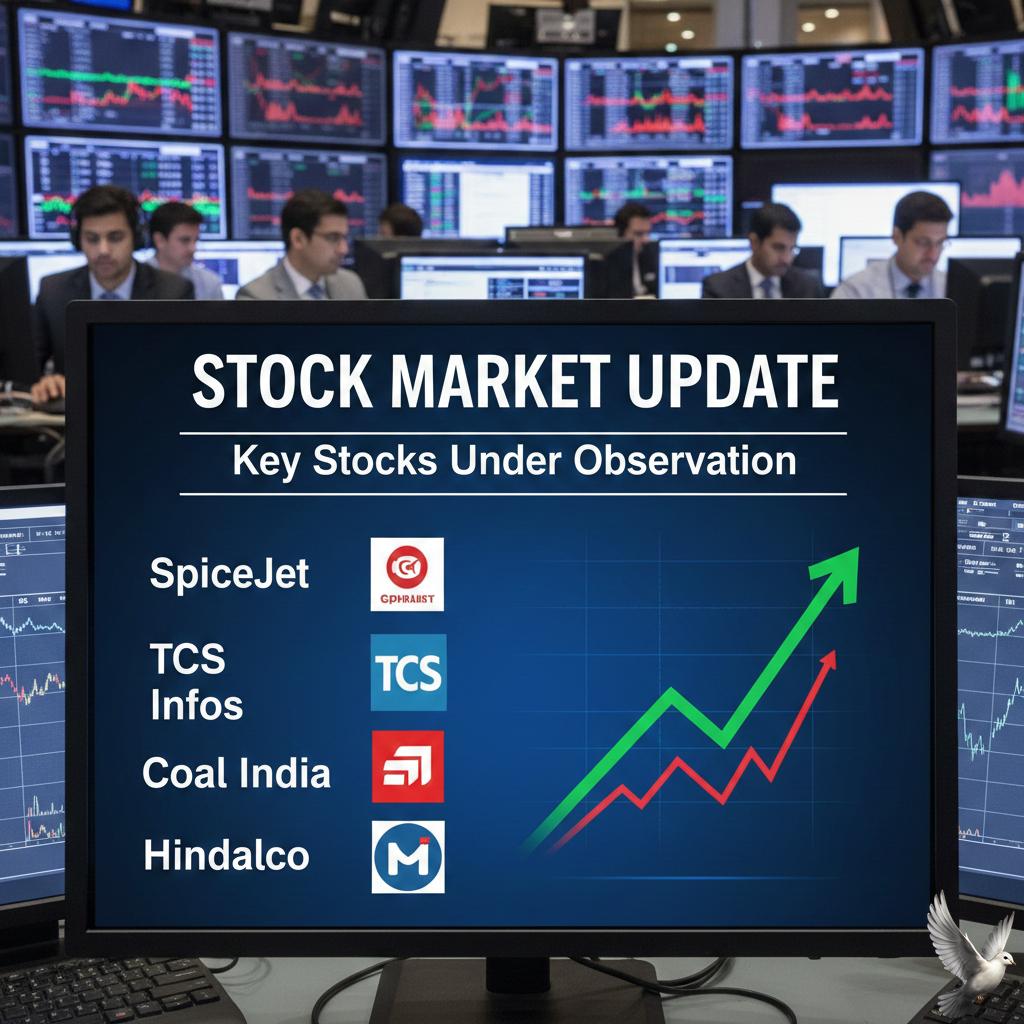
Stock Market Update: Key Stocks Including SpiceJet, TCS, Infosys, Coal India, and Hindalco Under Observation
Indian equity benchmarks ended in the red on Thursday, February 12, 2026, as a heavy sell-off in technology giants snapped a four-day winning streak. The BSE Sensex tumbled 558.72 points, or 0.66%, to settle at 83,674.92. Similarly, the NSE Nifty 50 declined by 146.65 points, or 0.57%, closing at 25,807.20. The downturn was primarily triggered by the Nifty IT index, which slumped over 5% to reach a 10-month low. Market sentiment was dampened by concerns over AI-led disruptions and waning hopes for a U.S. Fed rate cut following robust American economic data. Technology heavyweights were the major laggards. Infosys and Tata Consultancy Services (TCS) both plunged nearly 6%, while Tech Mahindra and Wipro saw significant declines. This followed a sharp drop in the ADRs of Indian IT firms on Wall Street. Corporate earnings for the December-ended quarter (Q3FY26) remained the central focus. SpiceJet reported a consolidated net loss of 261.38 crore, shifting from a profit in the previous year despite a 14% rise in revenue to 1,408 crore. The airline cited higher fuel costs and a one-time labor law impact of 18.6 crore. Coal India also faced pressure, reporting a 16% decline in consolidated net profit to 7,166 crore for the quarter. Despite the profit dip, the state-owned miner declared a third interim dividend of 5.5 per share, with the record date set for February 18. In contrast, other sectors provided a cushion against deeper losses. Finance and telecommunication stocks witnessed buying interest. Top gainers included Bajaj Finance, ICICI Bank, and Trent. Lenskart emerged as a standout performer, surging 12% intraday after reporting a multi-fold jump in net profit to 132.7 crore. Broader markets showed resilience compared to the benchmarks. The BSE MidCap Select Index fell a modest 0.48%, while the SmallCap Select Index slipped 0.28%. Analysts note that while IT faces structural challenges, performing sectors like banking and automobiles maintain a resilient undertone. The Indian Rupee closed stronger at 90.61 against the U.S. Dollar. Global oil prices remained relatively stable, with Brent crude trading near 69 per barrel. While volatility is expected to persist, foreign institutional investors (FIIs) have recently turned net buyers, providing some structural support to the market. [Sensex drops over 550 points](https://www.youtube.com/watch?v=J2QL5UL2nMs) This video provides a detailed breakdown of the IT sector's impact on the recent market decline and highlights key earnings reports from major companies. http://googleusercontent.com/youtube_content/0

Global Markets Decline Amid Technology Sector Volatility
Market Brief: AI Jitters and Global Asset Shifts Asian equity markets retreated from recent record highs today, following a significant sell-off in U.S. technology stocks. The downturn was fueled by mounting investor concerns regarding the heavy capital expenditure required for artificial intelligence and its potential to disrupt traditional software business models. The **MSCI Asia Pacific Index** fell for the first time in six sessions, reflecting a cautious shift in global sentiment. In the United States, the **Nasdaq 100** slumped **2%** on Thursday, while the **S&P 500** declined **1.6%**. This tech-led retreat spread beyond software into logistics and commercial real estate. Investors reacted sharply to news of new AI tools capable of automating complex professional workflows, leading to a **7.5%** weekly drop in the **S&P 500 Software & Services Index**, which is now down **18.6%** year-to-date. Capital moved decisively toward safety, driving a rally in U.S. Treasuries. The **10-year Treasury yield** settled at **4.10%**, a multi-month low, as investors moved away from riskier assets. This "flight to quality" was further supported by U.S. economic data showing weekly jobless claims at **227,000**, slightly higher than the expected **223,000**, and existing home sales falling **8.4%** to a 16-month low. The commodities market experienced intense volatility. Spot gold saw a dramatic **3%** plunge in a single session, briefly breaking below the psychological **$5,000** mark. However, the metal stabilized in early Friday trading, hovering near **$4,939** per ounce. Algorithmic trading appeared to amplify the sudden drop, though the long-term outlook remains supported by central bank demand. Cryptocurrencies showed signs of a fragile recovery after a period of sustained pressure. **Bitcoin** edged higher by **0.6%** to reach approximately **$66,205**, attempting to find a foothold after four consecutive days of losses. Despite this minor bounce, the digital asset remains down nearly **26%** since the start of the year, echoing the broader "risk-off" mood affecting speculative investments. Early Asian trading on Friday showed a tentative stabilization. While Japan's **Nikkei 225** faced pressure, U.S. equity-index futures moved slightly higher, suggesting that some investors are looking for entry points following the recent correction. Markets now await January inflation data, with the **Consumer Price Index** expected to show a yearly increase of **2.5%**.

Unilever reports profit growth alongside slowing market outlook
Unilever has finalized a transformative fiscal year, reporting a **4.6%** increase in net profit for its retained brands, which reached **$6.8 billion** (€5.7 billion). This performance follows the successful demerger of its ice cream business, including brands like Magnum and Ben & Jerry’s, which was completed in late 2025. The company is now operating under a leaner structure led by CEO Fernando Fernandez. While the ice cream spinoff helped sharpen focus, total group revenue slipped **3.8%** to **$50.5 billion** (€50.5 billion) due to currency fluctuations and the impact of business disposals. Growth and Sector Performance Despite the drop in total turnover, underlying sales growth (USG) remained healthy at **3.5%**. This was driven by a **1.5%** increase in volume and **2.0%** in pricing. The fourth quarter showed particular strength, with USG accelerating to **4.2%**. Unilever's "Power Brands," which now represent **78%** of total turnover, are the primary engine of this growth. These brands saw an underlying sales increase of **4.3%**, outperforming the broader portfolio. * **Personal Care:** Grew **4.7%**, supported by strong innovation in brands like Dove. * **Beauty & Wellbeing:** Increased **4.3%**, with double-digit growth in the health-focused segments. * **Home Care:** Reported a **2.6%** rise, showing resilience in emerging markets. 2026 Market Outlook Management has issued a cautious forecast for 2026, warning of "slower market conditions" in developed economies. Sales growth for the coming year is expected to land at the bottom end of the company’s **4% to 6%** multi-year target range. Consumer behavior in the United States and Europe remains a challenge. Shoppers in these regions are increasingly trading down to unbranded or private-label alternatives due to cost-of-living pressures. In contrast, emerging markets—specifically India and Indonesia—continue to provide a vital buffer, with the latter seeing a significant profit surge post-spinoff. Financial Health and Efficiency Operational efficiency has improved, with the underlying operating margin expanding by **60 basis points** to reach **20.0%**. This was bolstered by a productivity program that delivered **$670 million** (€670 million) in savings by the end of 2025, exceeding initial targets. The company remains committed to shareholder returns, announcing a new share buyback program of up to **$1.5 billion** (€1.5 billion) set to begin in the second quarter of 2026. This follows **$6.0 billion** already returned to shareholders through dividends and buybacks over the previous year. Unilever is now prioritizing its "Beauty, Wellbeing, and Personal Care" divisions, which account for over half of its revenue. The strategic pivot aims to capture higher-margin premium segments and expand digital commerce footprints to offset the stagnation expected in traditional Western retail channels.
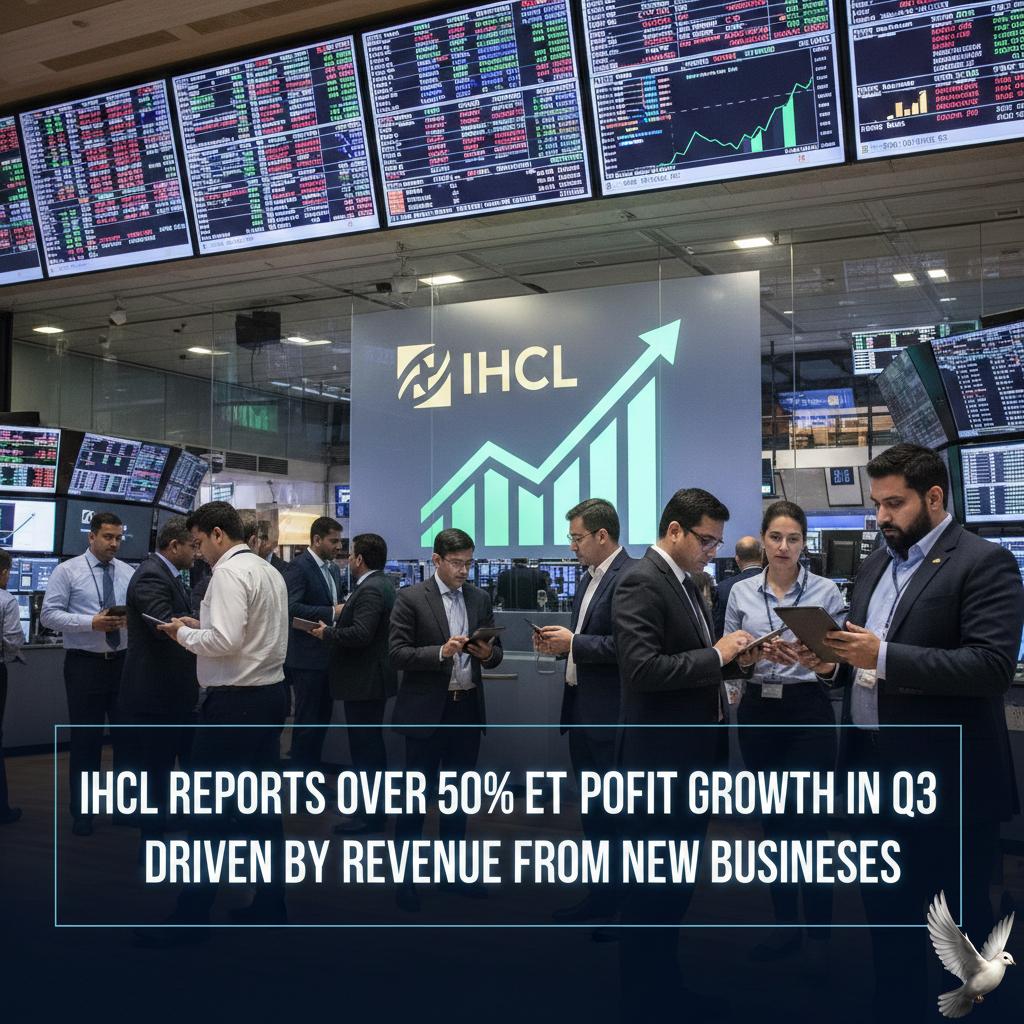
IHCL Reports Over 50% Net Profit Growth in Q3 Driven by Revenue From New Businesses
Indian Hotels Company Limited (IHCL) continues its historic growth trajectory, marking fifteen consecutive quarters of record-breaking financial performance. As of February 2026, the company has solidified its leadership in the Indian hospitality sector, fueled by a robust surge in demand across its diverse brand portfolio. **Q3 Performance Highlights** The company reported a substantial 51% increase in consolidated net profit, reaching **₹954 crore** for the third quarter. This growth was supported by a 12% rise in revenue from operations, which climbed to **₹2,842 crore**. The quarter also saw Ebitda reach **₹1,134 crore**, reflecting high operational efficiency and an Ebitda margin of approximately **39%**. **Stock and Market Valuation** IHCL’s market capitalization remains strong at approximately **₹1,00,679 crore**. As of February 12, 2026, the stock was trading near the **₹712** mark on the NSE. While the stock has seen a slight year-on-year consolidation of **5.4%**, its long-term performance remains impressive, delivering over **450%** returns to shareholders over a five-year period. **Sector Trends and Operational Metrics** The broader Indian hospitality industry is currently benefiting from a favorable demand-supply mismatch. Nationwide occupancy rates for premium hotels are holding steady between **70% and 72%**. Average Room Rates (ARR) for IHCL’s standalone domestic business saw a significant uptick, with luxury segments reporting average rates of **₹20,440**, a **12.9%** increase. Revenue per available room (RevPAR) followed this trend, growing by nearly **15%**, driven by the wedding season, corporate travel, and large-scale MICE events. **Strategic Expansion and New Businesses** Under its "Accelerate 2030" strategy, IHCL is aggressively moving toward a target of **700 hotels** by the end of the decade. The company currently manages a portfolio of **617 hotels**, with an industry-leading pipeline of **256** additional properties. Key recent developments include: - Acquisition of a **51%** stake in **Brij**, a boutique experiential leisure brand. - Controlling stake in **Atmantan**, marking a strategic entry into the integrated wellness segment. - Expansion of the **Ginger** brand through the acquisition of a **51%** stake in ANK and Pride hospitality entities. - International expansion with new signings in **Egypt** (Grand Continental Hotel, Cairo) and **Bhutan**. **Financial Outlook** The company maintains a healthy liquidity position with a gross cash balance of **₹3,877 crore**. Management has allocated over **₹1,200 crore** for asset management and new project developments in the coming fiscal year. Contributions from "New Businesses"—including Ginger, Qmin, and amã Stays & Trails—have grown by **31%**, signaling a successful diversification beyond traditional luxury hospitality. This multi-brand approach ensures IHCL is well-positioned to capture growth in both metropolitan hubs and emerging Tier-2 and Tier-3 markets.
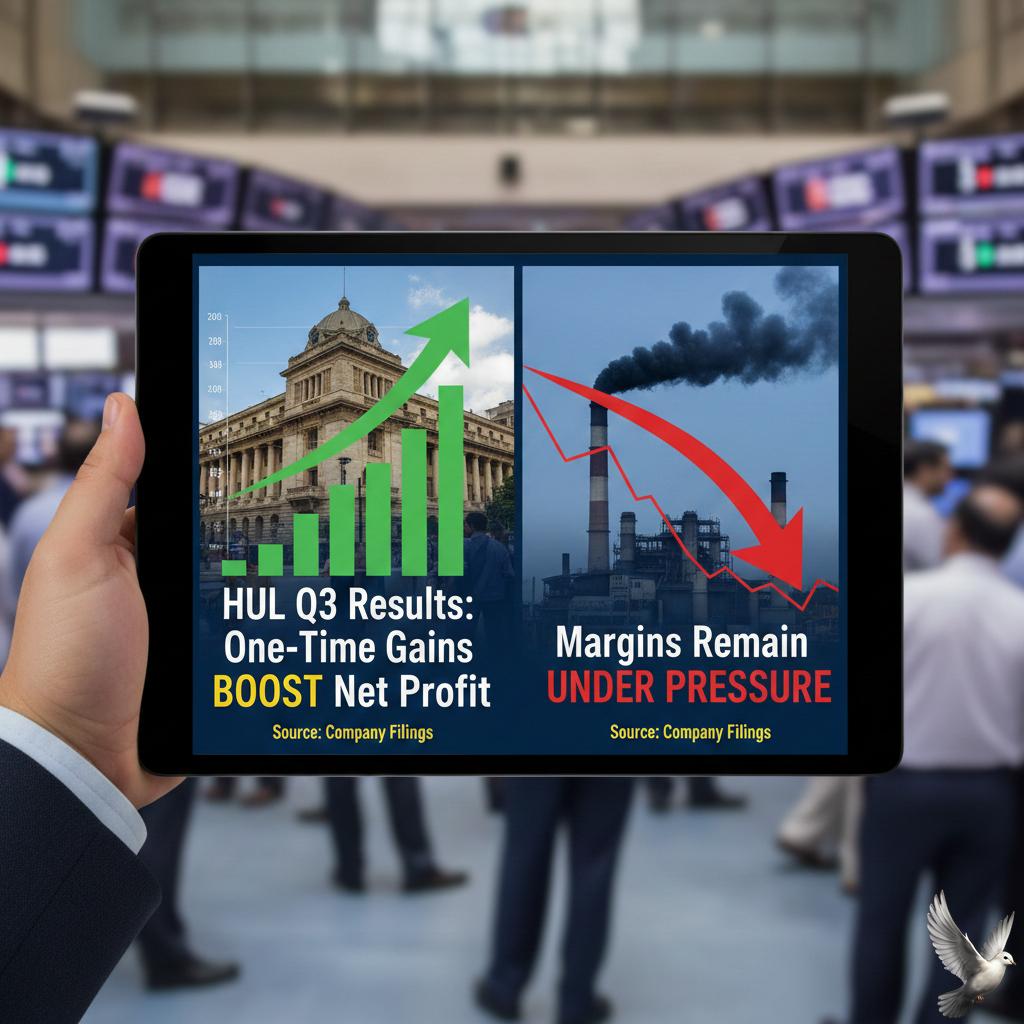
HUL Q3 Results: One-Time Gains Boost Net Profit While Margins Remain Under Pressure
Hindustan Unilever Limited (HUL) has reported a complex financial performance for the quarter ending December 2025 (Q3 FY26), characterized by significant accounting shifts and a strategic pivot toward high-growth wellness categories. Financial Performance Highlights The company posted a consolidated revenue of **16,197 crore**, representing a **6%** increase compared to the same period last year. This growth was underpinned by a **4%** underlying volume expansion, indicating steady consumer demand despite a shifting economic backdrop. The headline net profit saw a dramatic surge of **121%**, reaching **6,603 crore**. However, this figure was primarily driven by a massive one-off exceptional gain of **4,611 crore** following the demerger of the company's ice cream business into Kwality Wall’s (India). Core Profitability and Margins Beyond the one-off gains, the core financial health reflected ongoing challenges. The Profit After Tax (PAT) from continuing operations—which excludes the ice cream business and other exceptional items—actually declined by **30%** to **2,118 crore**. Operating margins faced pressure from persistent input costs and the implementation of new national Labour Codes, which created an incremental liability of **113 crore**. Consequently, the EBITDA margin softened by **70 basis points** to settle at **23.3%**. Market Dynamics and Consumer Trends Rural markets have emerged as a primary growth engine, outperforming urban areas for the seventh consecutive quarter. Rural volume growth reached **8.4%**, nearly double the **4.6%** growth seen in cities. This resurgence is supported by: * Easing food inflation and stable commodity prices * Supportive government policies and rural welfare spending * High consumer interest in "Premium" products within rural segments Strategic Realignment HUL is aggressively reshaping its portfolio to focus on high-margin sectors. A key highlight is the full acquisition of Zywie Ventures (**OZiva**) for **824 crore**, signaling a "double down" on the health and wellbeing space. Simultaneously, the company has exited underperforming ventures like Nutritionalab to streamline operations. Market Outlook and Valuation Following the earnings announcement on **February 12, 2026**, HUL shares saw an intra-day decline of approximately **3.6%**, trading around **2,368–2,400**. Investors remain cautious regarding core margin compression despite the strong rural recovery. Management anticipates a stronger performance in the next fiscal year (**FY27**), banking on portfolio optimization and the benefits of a deflationary commodity environment to restore core profitability.

Accor and InterGlobe Explore IPO for Hospitality Joint Venture
Strategic Hospitality Brief: Accor & InterGlobe Public Market Entry Europe’s largest hospitality group, **Accor**, and Indian aviation powerhouse **InterGlobe Enterprises** are actively exploring public markets for their consolidated hotel venture. This strategic move follows a transformation of their partnership into an autonomous platform that now both owns and operates high-value assets. The venture has set an ambitious target to reach **300 hotels** across India by **2030**. This expansion represents a significant scaling from the current footprint of approximately **70 operational properties**. To accelerate this growth, the partners have integrated their development and management businesses into a single entity. Financial Performance & Growth Metrics The hospitality sector in India is entering 2026 with high demand visibility. Key performance indicators for the venture and the broader market include: * **Revenue Growth:** Accor reported a record **12% increase** in Revenue Per Available Room (RevPAR) during the 2025 fiscal period. * **Signings Milestone:** 2025 marked a historic high for Accor in India, with approximately **4,000 new rooms** signed—the highest in the company’s regional history. * **Market Position:** Through a strategic investment in the tech-led platform **Treebo**, the joint venture has secured a combined portfolio exceeding **30,000 rooms**, positioning it as India’s third-largest hospitality player. * **Profitability:** InterGlobe Hotels reported revenues of approximately **₹642 crore** in FY2025, with Gross Operating Profits (GOP) rising to **₹262 crore**. Market Outlook for 2026 The Indian hospitality industry is projected to maintain a stable outlook throughout 2026. Market data suggests a transition toward "intent-led" growth characterized by: * **Occupancy Stability:** Premium hotel occupancy is expected to hold steady between **72% and 74%**. * **Pricing Discipline:** Average Room Rates (ARR) are forecast to rise to the **₹8,200–₹8,500** range. * **Supply Dynamics:** New room inventory is growing at a CAGR of **4.5% to 5.0%**, lagging slightly behind robust demand from domestic leisure and MICE (Meetings, Incentives, Conferences, and Exhibitions) segments. Portfolio Diversification The joint venture is shifting toward a diversified asset-heavy and asset-light mix. While midscale brands like **ibis** and **Mercure** remain the volume drivers, there is an aggressive push into the luxury and lifestyle segments. High-profile openings such as **Fairmont Mumbai** and upcoming **Raffles** residences are designed to capture rising affluence in the domestic market. The partnership’s exclusive vehicle will now manage all Accor brands in India, including the high-growth **Ennismore** lifestyle portfolio. The transition to a public listing is intended to provide the capital necessary to maintain this pace of development, targeting a network that triples the current presence within the next four years.
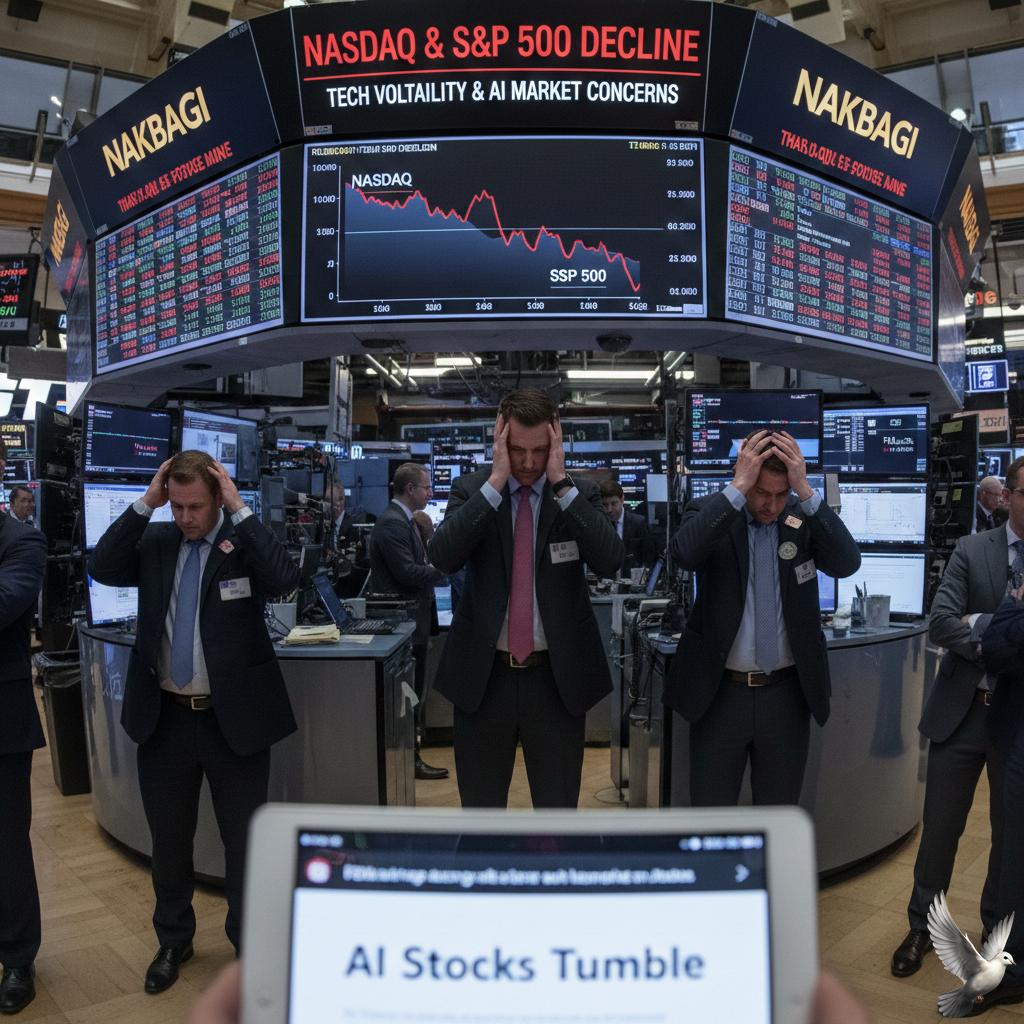
Nasdaq and S&P 500 Decline Amid Tech Sector Volatility and AI Market Concerns
Indian Market Brief: February 12, 2026 Indian equity benchmarks retreated sharply on Thursday as a wave of selling hit the technology and transport sectors. The **BSE Sensex** dropped **558.72 points**, or **0.66%**, to settle at **83,674.92**. Simultaneously, the **NSE Nifty 50** declined by **146.65 points**, closing at **25,807.20**. The Information Technology sector faced a significant "nosedive" correction. The **Nifty IT index** plummeted over **5%**, erasing approximately **₹1.56 lakh crore** in market value in a single session. This selloff was fueled by mounting anxiety over structural shifts caused by Artificial Intelligence. Investors are increasingly concerned that rapid advancements in AI, such as automated coding and task-based plugins, could disrupt traditional headcount-based outsourcing models. Major industry players saw heavy losses, with **Tech Mahindra**, **Infosys**, and **TCS** all tumbling between **5.4% and 6%**. Economic data from the United States further dampened sentiment. Stronger-than-expected **US non-farm payroll data**, showing **130,000** new jobs in January, reduced hopes for near-term interest rate cuts by the Federal Reserve. This stable labor market data suggests a "higher-for-longer" rate environment, which typically pressures high-growth tech valuations. Domestic investors also turned cautious ahead of local economic indicators. India’s January retail inflation, released under a new **2024 base year** series, came in at **2.75%**. While this figure remains within the central bank's tolerance band, it represents an acceleration from previous months due to rising food and metal prices. The transport and logistics sector also faced pressure. Shares of **IndiGo** and **Adani Ports** ended in the red following a broader trend of weakness in transport hiring data. This contributed to a lopsided market where declining stocks outnumbered gainers by a significant margin. Despite the broad selloff, specific sectors like financials and retail showed resilience. **Bajaj Finance** led the gainers with a **3.12%** rise, followed by **ICICI Bank** and **Trent**. However, the overall market undertone remained bearish, with the **India VIX** rising **1.5%** to **11.72**, signaling an uptick in investor nervousness.
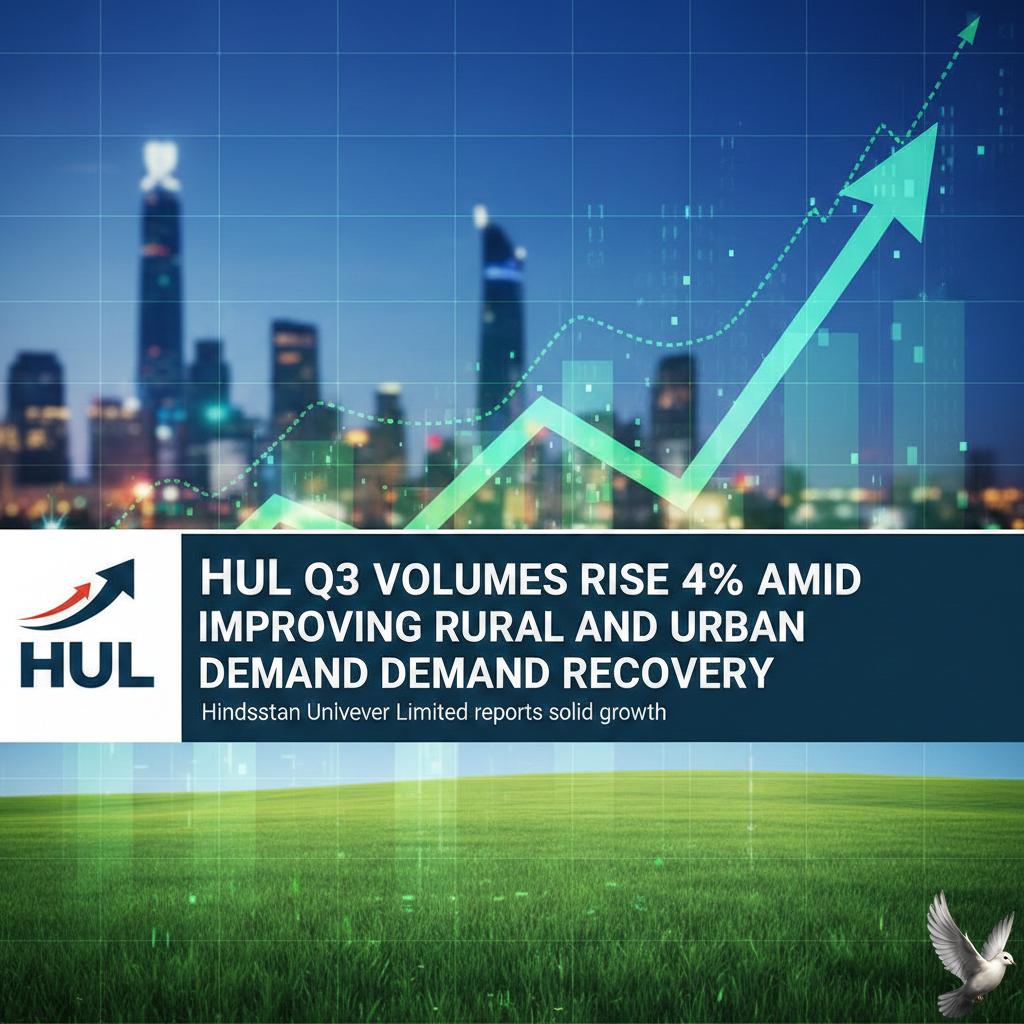
HUL Q3 Volumes Rise 4% Amid Improving Rural and Urban Demand Recovery
Hindustan Unilever Limited (HUL) reported a significant surge in its performance for the December 2025 quarter (Q3 FY26), with consolidated net profit climbing **121%** to reach **₹6,603 crore**. This sharp increase was primarily fueled by an exceptional gain of **₹4,611 crore** following the demerger of its ice cream business. Total revenue from operations grew by **6%** year-on-year, standing at **₹16,580 crore**. The company achieved an underlying sales growth of **5%**, underpinned by a healthy **4%** increase in underlying volume. This volume recovery reached a multi-quarter high, signaling a steady rebound in consumer demand. Operational efficiency remained stable with EBITDA at **₹3,788 crore**, up **3%** from the previous year. While the EBITDA margin saw a slight contraction of **70 basis points** to **23.3%** due to new labor code provisions, it remained within the company's guided range. The Beauty & Wellbeing segment emerged as a top performer, delivering **11%** revenue growth. This was bolstered by the full acquisition of **OZiva** and the continued integration of **Minimalist**, which now contributes to a combined annual revenue run rate of **₹1,100 crore** in the premium wellness and skincare space. Strategic portfolio shifts have been central to this growth. HUL has sharpened its focus on high-growth digital channels, with Quick Commerce now accounting for approximately **3%** of the total business. The company also announced a complete exit from its minority stake in **Nutritionalab** to streamline its health and wellness bets. Management maintains a positive outlook for the remainder of the fiscal year, citing improving macroeconomic stability and supportive policy measures. Early signs of recovery in both rural and urban markets suggest a stronger performance in **FY27** compared to **FY26**. The Home Care segment continues to lead revenue contributions, achieving its highest-ever market share this quarter. High-single-digit volume growth across the Foods category and double-digit expansion in premium Hair Care brands like **Dove** and **TRESemmé** further reinforce the company’s competitive positioning. Market reaction on the NSE following the results saw the stock trading at approximately **₹2,400**, as investors balanced the massive one-time gains against a **30%** decline in core operating profit from continuing operations. Analysts maintain a long-term target in the range of **₹2,600** to **₹2,800**, supported by HUL's zero-debt balance sheet and consistent dividend payouts.

IRDAI Clarifies Alternative Investment Fund Norms for Insurers
**IRDAI Markets Brief: February 2026** The Insurance Regulatory and Development Authority of India (**Irdai**) has introduced fresh updates to investment norms, granting insurers greater flexibility to deploy capital into Alternative Investment Funds (**AIFs**). The regulator is pivoting toward a more liberal investment environment while simultaneously tightening the borders around policyholder funds. A key clarification issued this week emphasizes that while insurers have more room to maneuver, the proceeds of insurer capital must remain within India. **Strategic Investment Shifts** Irdai has streamlined how insurers calculate their exposure to the AIF sector. Companies are now required to aggregate both **direct and indirect** exposures. This means any investment through a Fund of Funds (**FoF**) will be counted toward the single AIF exposure limit. This move aims to prevent "hidden" concentration risks that could arise from complex fund-of-funds structures. The regulator’s stance is clear: transparency in capital deployment is non-negotiable as the sector scales. **Capital Localization Mandate** A significant restriction has been reinforced regarding overseas assets. Under the current 2026 framework, insurers are strictly prohibited from using policyholder funds for overseas investments via AIFs. > **Key Rule**: Any AIF or Fund of Funds receiving insurance capital must include a specific clause in their offer documents. This clause must restrain the fund from investing in overseas companies or offshore funds. This policy ensures that the domestic insurance float—which fuels a market valued at over **$338 billion** in 2025—is utilized to support the Indian economy and infrastructure. **Market Momentum and Data** The Indian insurance sector is entering a high-growth phase. Analysts project a **6.9%** annual premium growth between 2026 and 2030, positioning India as the fastest-growing major insurance market globally. * **Market Value**: Expected to reach **$867 billion** by 2034. * **AIF Growth**: Total commitments raised in the AIF sector have surpassed **₹15.74 lakh crore**. * **FDI Impact**: Following the 2025 reforms, the removal of "Indian owned and controlled" restrictions has accelerated capital inflows, with foreign investment limits now at **74%** and reaching **100%** in specific segments. **Regulatory Oversight** To maintain stability, Irdai has mandated rigorous compliance checks. Insurers must now obtain a quarterly certificate from a concurrent auditor. This certificate confirms that no policyholder funds have leaked into restricted overseas avenues. These reports must be filed alongside quarterly returns within **15 days** of the period ending. The balance of "flexibility for growth" and "protection of domestic capital" defines the current 2026 regulatory landscape. As the industry moves toward the goal of "Insurance for All by 2047," these investment guardrails ensure that the massive pool of domestic savings remains a backbone for national development.

Agrochem stocks rise following Q3 results and trade agreement
Agrochemical and animal-feed stocks reached multi-month highs in mid-February 2026, catalyzed by a landmark trade breakthrough and exceptional third-quarter fiscal performance. Market sentiment shifted dramatically following the announcement of a new bilateral trade agreement between India and the United States. Under this deal, overall effective tariffs on Indian exports have been slashed from nearly 50% to a standardized 18%. Specifically for the marine sector, the previous punitive duties that pushed effective rates toward 58% have been rescinded. This reduction restores the competitiveness of Indian shrimp and feed products in the U.S. market, which remains India’s largest seafood destination. Avanti Feeds emerged as a top performer, hitting a 20% upper circuit as investors factored in the combined benefit of lower export barriers and strong Q3 earnings. The company reported a net profit of ₹163.47 crore for the quarter, supported by a 23.99% return on capital. Godrej Agrovet saw its share price surge over 9% to ₹644.95. The rally was underpinned by a net profit of ₹114.82 crore in the latest quarter and a year-on-year profit variation of 23.13%. Analysts have maintained a bullish outlook on the stock, citing its diversified presence in animal feed and crop protection. Mukka Proteins experienced a 7.32% intraday gain, with trading prices stabilizing around ₹25.50. The firm’s quarterly sales rose by 63.93%, reaching ₹244.58 crore, driven by a global surge in demand for fish meal and specialty proteins. The agrochemical sector broad-based this momentum. Sharda Cropchem jumped 9.6%, while smaller players like Sikko Industries and Aristo Bio-Tech advanced between 5% and 6%. This recovery follows a period of heavy inventory destocking that had previously weighed on the industry. Sector analysts indicate that the Indian agrochemical market is on track to reach a valuation of ₹50,000 crore by the end of 2025. Export revenue is projected to grow by 8% to 9% this fiscal year as global inventory levels normalize. Domestic demand remains supported by government initiatives and increased rabi crop output. However, the industry continues to monitor pricing pressures from China, where high U.S. tariffs on Chinese goods are pushing excess supply into other international markets. Operating margins for leading agrochemical manufacturers are expected to hold steady between 12.5% and 13%. Despite the volatility in raw material costs, the shift toward "China plus one" sourcing strategies continues to position Indian exporters as preferred global partners.

**US Economic Data and AI Sector Shifts Drive Decline in IT Stocks**
Indian IT Market Brief: February 2026 Indian software services stocks are facing a period of intense volatility and a broad-based sell-off. On February 12, 2026, the **Nifty IT Index** plummeted by **5.51%** to close at **33,160.20**. This marked the second time in less than ten days that the index has dropped by more than 5%, signaling deep-seated investor anxiety. Since the start of the year, the IT sector has been the primary laggard on Dalal Street. The Nifty IT Index has crashed by approximately **12.5%** year-to-date, contrasting sharply with the relative stability of the broader benchmark indices. This downturn has wiped out an estimated **₹1.3 lakh crore** in market capitalization in a single session. Macroeconomic Pressures The immediate catalyst for the recent decline stems from the United States. Unexpectedly strong US jobs data for January has revived fears that interest rates may remain higher for longer. Higher rates typically compress the valuations of growth-oriented stocks like IT services, which are priced based on future earnings potential. Additionally, Indian IT firms derive over **50%** of their revenue from the US market. The latest economic indicators have dampened hopes for a near-term Federal Reserve rate cut, causing a ripple effect that has hit American Depositary Receipts (ADRs) and subsequently domestic shares. The AI Disruption Factor Beyond interest rate concerns, the market is reacting to what analysts term the "Anthropic Shock." Recent advancements in automation tools—such as those from **Anthropic** and **Palantir**—have reignited structural fears. There is growing concern that AI could bypass the traditional labor-intensive model of Indian IT, which relies heavily on application maintenance and manual coding. Analysts from leading brokerages suggest that **40% to 70%** of revenue for major firms comes from application services. Some estimates indicate that **9% to 12%** of industry revenue could be eliminated over the next four years as clients shift toward AI-driven, outcome-based pricing models rather than headcount-based contracts. Stock Specific Impact The sell-off has been universal across the sector's heavyweights. **Infosys** fell over **5%**, touching its lowest levels in months, while **Tata Consultancy Services (TCS)** hit a fresh 52-week low of **₹2,750**. **Tech Mahindra** and **LTIMindtree** also saw significant declines of nearly **6%**. Mid-cap stocks were not immune, with **Coforge** and **Oracle Financial Services** leading the losers' list with drops exceeding **6%**. Despite these pressures, some analysts view the correction as a "panic reaction," noting that the industry continues to invest heavily in re-skilling its workforce to capture new AI-related opportunities. Long-Term Outlook While the short-term trend remains bearish, the structural importance of the sector to the Indian economy remains high. The industry is still projected to reach **$350 billion** by the end of 2026, contributing nearly **10%** to India's GDP. The current phase is increasingly viewed by institutional observers as a painful but necessary transition toward an AI-first service model.

Jane Street Challenges Indian Tax Dispute in Supreme Court Over Legal Privilege Issues
Market Brief: Jane Street vs. Indian Authorities Global trading powerhouse Jane Street has elevated its legal battle with Indian tax and market authorities to the Supreme Court. The firm is seeking a definitive ruling on the "legal privilege" of internal communications, a case that could redefine how corporate legal advice is protected across India. At the heart of the dispute is whether confidential emails and advice from in-house legal teams are shielded from investigative agencies. In October 2025, a Supreme Court bench suggested that in-house counsel, being salaried employees, might not enjoy the same statutory privilege as independent advocates. Jane Street has now filed a review application to challenge this distinction, with the next high-stakes hearing scheduled for March 25, 2026. The legal clash follows a period of unprecedented financial growth for Jane Street’s Indian operations. For the fiscal year ending March 2025, the firm’s local unit reported a staggering 494% surge in after-tax profit, reaching ₹28.40 billion. Net trading gains also skyrocketed by over 490% to hit ₹47.00 billion. Despite these record numbers, the firm faces intense regulatory pressure. The Securities and Exchange Board of India (SEBI) previously impounded approximately ₹48.43 billion in alleged "unlawful gains" related to index manipulation. While Jane Street has deposited this amount into an escrow account to resume certain operations, it continues to contest the findings. Simultaneously, the Income Tax Department is investigating the firm for potential tax evasion. Authorities are scrutinizing the use of the India-Singapore tax treaty and considering the invocation of General Anti-Avoidance Rules (GAAR). Officials have recommended that Jane Street’s profits be taxed as capital gains in India, rather than benefiting from offshore treaty protections. The outcome of the March 25 hearing will be a landmark for corporate India. A ruling against Jane Street could leave internal legal strategies and risk assessments of all major corporations vulnerable to regulatory discovery, fundamentally altering the landscape of corporate compliance and internal investigations in the country. This [report on Jane Street's tax dispute](https://www.youtube.com/watch?v=y5ew6VKCiiQ) provides context on the regulatory challenges and market manipulation allegations facing the firm in India. http://googleusercontent.com/youtube_content/0