Bullish News
Collection
BPCL Share Price: Live Updates and Market Risk Indicators (Beta Value)
**Global & Indian Market Update — January 29, 2026** **Market Pulse: Bulls in Control** Global and domestic equities are riding a wave of optimism, pushing key indices to historic milestones. The **S&P 500** has shattered the psychological barrier, crossing **7,000** for the first time, fueled by sustained AI optimism and resilience in the US labor market. In India, the bulls are firmly in charge. The **Nifty 50** closed decisively above the **25,300** mark, settling at **25,342**, while the **Sensex** advanced over **480 points** to end at **82,344**. The broader markets outperformed benchmarks, with Mid-Cap and Small-Cap indices rising nearly **1.7%** and **1.8%** respectively, indicating broad-based buying interest. **Key Driver: India-EU Free Trade Agreement** The primary catalyst for the domestic rally is the conclusion of the India-European Union Free Trade Agreement (FTA). Described by officials as the "mother of all deals," this pact is expected to eliminate tariffs on **99%** of Indian exports to the EU. Sectors likely to benefit—such as textiles, machinery, and defense—saw immediate traction. **Bharat Electronics** surged over **9%** on the back of strong earnings and sector optimism. This agreement is viewed as a critical counter-balance to ongoing global trade disruptions and US tariff uncertainties. **Commodities: Gold’s Historic Run** Precious metals are witnessing an unprecedented rally. **Gold** prices have broken through the **$5,400 per ounce** level, with spot prices testing **$5,500**. This surge is driven by a weakening US Dollar, which has slumped to four-year lows, and persistent central bank buying. Investors are flocking to safe havens amidst geopolitical friction and fiscal concerns in Western economies. **Crude Oil** remains stable but buoyant, with **Brent Crude** trading around **$67 per barrel**, finding support from a weaker dollar despite comfortable supply levels. **Crypto Markets: Bitcoin Consolidates** The cryptocurrency sector is seeing a period of consolidation after its recent explosive growth. **Bitcoin (BTC)** is hovering between **$88,000** and **$90,000**, reacting to the Federal Reserve's decision to hold interest rates steady. **Ethereum (ETH)** is trading near **$3,000**, with market dominance holding steady. While the immediate momentum has cooled slightly, the long-term trend remains supported by institutional interest and the "risk-on" sentiment spilling over from equity markets. **Central Bank Action: The Fed Holds** The US Federal Reserve has kept interest rates unchanged at **3.50%–3.75%**. Chairman Jerome Powell signaled that while inflation remains sticky, the labor market is stabilizing. The decision was not unanimous, with two officials favoring a cut, which has kept hopes alive for monetary easing later in 2026. This "dovish hold" has put downward pressure on yields and the dollar, further boosting non-yielding assets like Gold and Crypto. **Sector Spotlight** * **Defense & PSUs:** Major gainers following the FTA announcement and strong quarterly numbers. * **Banking:** **Axis Bank** jumped **4%** post-results, signaling robust credit demand. * **Metals:** Supported by a weaker dollar and hopes of European demand recovery. * **Tech:** US tech stocks continue to lead, with spillover effects aiding Indian IT counters despite currency headwinds. **Outlook** Volatility is expected to remain high as markets digest the full implications of the India-EU pact and the Fed's future path. Key support for Nifty is seen at **25,150**, with immediate resistance near **25,600**. Investors are advised to watch for profit-booking in high-flying mid-caps while maintaining focus on quality large-caps benefiting from the new trade regime.
Asian Paints Share Price: Six-Month Beta at 0.7235
**Global Market Brief: January 29, 2026** **US Markets: Fed Steady, Tech Earnings in Focus** US indices closed mixed following the Federal Reserve's decision to hold interest rates steady at **3.50%–3.75%**. Chair Powell cited an improving economic outlook, though inflation concerns linger. * **S&P 500**: Flat at **6,978** (-0.01%). * **Nasdaq**: Edged up to **23,857** (+0.17%), nearing record territory. * **Dow Jones**: Rose slightly to **49,015** (+0.02%). Megacap earnings drove volatility: **Meta** surged on strong results, while **Microsoft** slipped despite beating estimates due to high AI spending. **Tesla** reported mixed numbers but beat profit expectations. **Asian & Indian Markets: Trade Deal Optimism** Indian equities rallied, driven by the conclusion of the **India-EU Free Trade Agreement (FTA)**. * **Nifty 50**: Climbed to **25,342** (+0.66%). * **Sensex**: Jumped to **82,344** (+0.60%). * **Regional Trends**: Japan’s **Nikkei** and South Korea’s **Kospi** also closed in the green, tracking positive global cues. **Commodities: Gold & Silver Smash Records** Precious metals saw historic gains as safe-haven demand spiked amid US dollar fluctuations and geopolitical signals. * **Gold**: Breached **$5,300/oz** for the first time in history. * **Silver**: Surged past **$116/oz**. * **Oil**: Brent Crude slipped to **$67.25** per barrel despite winter storm disruptions in the US affecting short-term supply. **Crypto: Consolidation Continues** Digital assets remain in a consolidation phase following late 2025 volatility. * **Bitcoin**: Trading below **$90,000**, with support testing **$86,000**. * **Market Cap**: Total crypto market cap stands at **$2.93 trillion**. *** **Next Step for You:** I can provide a deeper technical analysis of the gold breakout levels or a breakdown of the specific sectors benefiting from the new India-EU trade agreement.
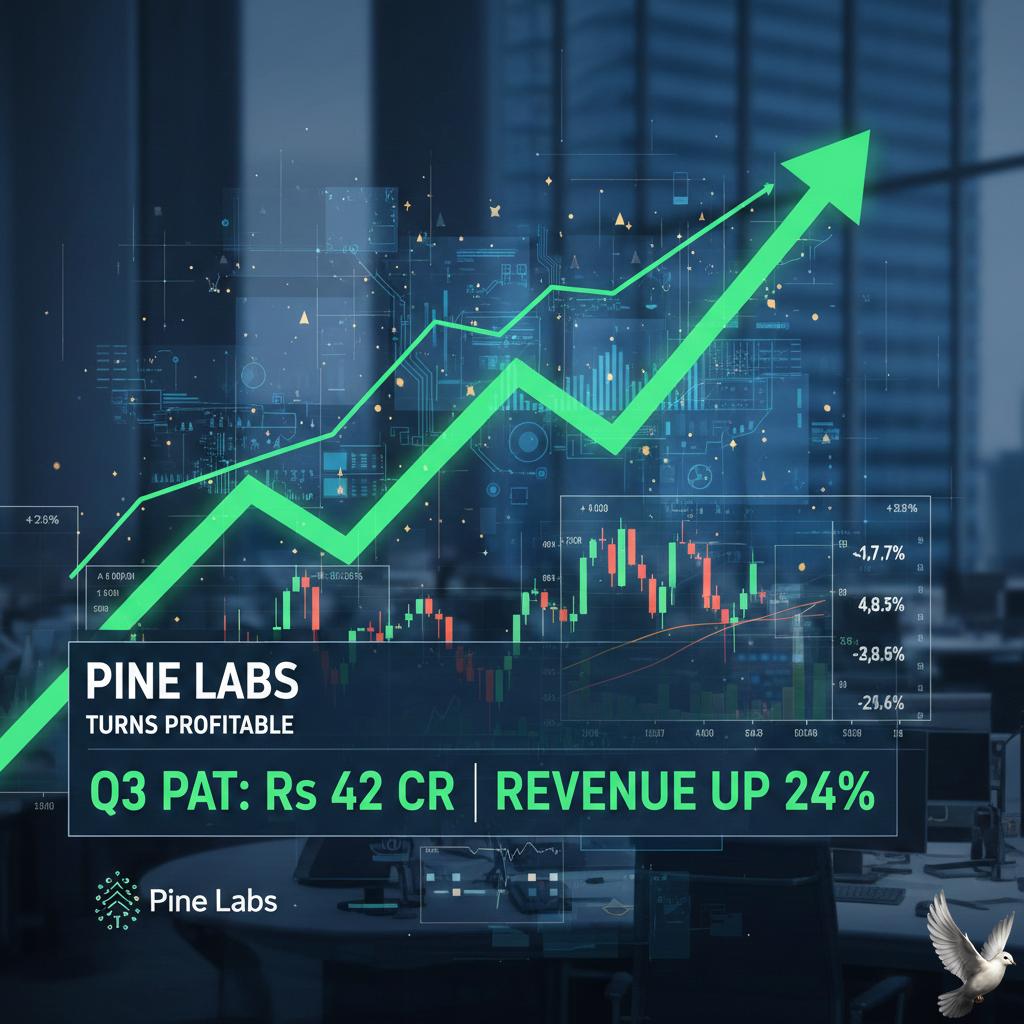
Pine Labs Turns Profitable in Q3 with Rs 42 Crore PAT; Revenue Up 24%
Financial Brief: Pine Labs The digital payments platform, recently listed, announced a significant turnaround, swinging to a consolidated net profit of **Rs 42 crore** in the third quarter of fiscal year 2026. This marks a substantial shift from the **Rs 57 crore** loss recorded in the corresponding period last year, reinforcing the company's trajectory towards sustained profitability. This earnings inflection point was driven by robust expansion across its core business lines. Revenue from operations climbed **24%** year-over-year to reach **Rs 744 crore** for the December quarter. The sequential growth was equally impressive, with net profit jumping an extraordinary **600%** compared to the preceding July-September quarter. Operational efficiencies were a key performance indicator. Adjusted EBITDA soared by **59%** annually, clocking in at **Rs 171 crore**. This increased efficiency resulted in the EBITDA margin expanding to a healthy **23%**, signaling improved operating leverage as transaction volumes scale. The contribution margin itself saw a **19%** uplift, reaching **Rs 551 crore**. The commerce platform demonstrated historic strength in its core transaction engine. Gross Transaction Value, or GTV, surged to an all-time high of **Rs 4.5 lakh crore** for the quarter, reflecting a **29%** jump year-over-year. The total number of transactions processed also showed robust momentum, growing **23%** annually to pass **192 crore** transactions. This velocity underscores the platform’s deepening integration within the merchant ecosystem. While operational metrics excelled, the quarter presented a challenge in cash management. Operating cash flow remained negative, registering a cash outflow of **Rs 152 crore** after accounting for early settlements. Management attributed this temporary negative positioning to higher working capital demands driven by the peak festive season demand and transaction volumes in the third quarter. These cash needs are anticipated to normalize in the coming period. The company's bottom line was also impacted by a one-time factor. An exceptional charge related to the implementation of new labor codes slightly trimmed the final profit figure. Excluding this impact, the net profit for the quarter would have been higher at approximately **Rs 52 crore**. The market is currently valuing the fintech major robustly. The company commands a market capitalization exceeding **Rs 26,430 crore**. Shares recently traded at approximately **Rs 231.75**, near the midpoint of its 52-week trading range of **Rs 213.50** to **Rs 284**. Market analysts maintain a generally positive outlook. The consensus rating on the stock remains a "Buy," with an average 12-month price target set at **Rs 262.50**. Forecasts suggest aggressive future growth, with earnings expected to swell by nearly **95%** annually in the coming years. Strategic expansion remains a priority, particularly in global markets. The international business segment has become a significant growth driver, generating **Rs 302 crore** in revenue within the first nine months of the financial year. This global footprint was recently cemented by a strategic partnership with UAE-based **Wio Bank**, modernizing the region's merchant acquiring infrastructure. On the product front, the subsidiary **Setu** launched an advanced, agentic bill-payment tool in India, leveraging cutting-edge technology to automate bill tracking and settlement for consumers, signaling continuous innovation in value-added services.

SpaceX Plans Potential World's Largest Initial Public Offering
**SpaceX Targeting Historic June 2026 IPO** **Elon Musk’s** aerospace giant is reportedly finalizing plans for a record-breaking initial public offering as soon as **June 2026**, aiming to raise up to **$50 billion**. If successful, this listing would shatter global records, surpassing Saudi Aramco’s 2019 debut to become the largest IPO in history. **Key Financial Targets** The company is eyeing a staggering **$1.5 trillion** public valuation—nearly double its recent private market valuation of **$800 billion** established during late 2025 tender offers. This aggressive target reflects the company's dominance in launch services and the massive recurring revenue scale of **Starlink**, its satellite internet division. **Strategic Details** * **Timeline:** Mid-June 2026 is the primary target, with reports suggesting Musk aims to align the listing with specific planetary events or his birthday, though analysts emphasize market conditions will dictate the final date. * **Banking Partners:** Heavyweights **Morgan Stanley**, **Goldman Sachs**, **JPMorgan**, and **Bank of America** have been tapped to lead the offering. * **Capital Use:** Proceeds will fuel the capital-intensive **Starship** program and the expansion of Starlink's next-generation orbital infrastructure. **Market Impact** A listing of this magnitude would reshape the global equity landscape, instantly positioning SpaceX among the world’s most valuable public companies alongside tech titans like Apple and Microsoft. It serves as a critical test of investor appetite for deep-tech hardware and space economy assets at a time when capital markets are recovering from 2025 volatility. **Regulatory & Risk Outlook** While the IPO window is opening, the deal faces intense scrutiny. Transitioning from a privately controlled entity to a public firm will expose SpaceX to rigorous quarterly reporting and regulatory oversight, potentially clashing with Musk’s preferred rapid-iteration operational style. I can set up a news alert for the official S-1 filing or confirmation of the June syndicate dates if you wish.

SBI Life Q3 Net Profit Rises 5% to Rs 577 Crore; Net Premium Income Up 22%
SBI Life has successfully navigated a dynamic quarter, confirming robust growth in profitability and core business metrics as of December 31, **2025**. The company reported a net profit of **₹577 crore** for the third quarter of fiscal year **2026**, marking a **5%** increase year-over-year. *** Business Momentum and Premiums The primary driver for the quarter remained premium collection, reflecting strong market activity and customer demand. Net premium income surged **22%** year-on-year, reaching **₹30,245 crore**. One-time premium receipts increased by **24%**, while renewal premiums grew by nearly **21%**, underscoring solid customer retention. New business traction was exceptional, with the Total New Business Sum Assured recording a massive **69%** growth for the quarter. This surge indicates growing customer preference for higher sum assured policies within the current environment. *** Profitability and Market Standing The focus on sustainable business is reflected in the Value of New Business (VONB), which grew by **22%** for the quarter, reaching **₹22.9 billion**. The company maintained strong profitability with the VONB margin standing at **28.3%** when excluding the impact of GST. For the nine-month period ending December **2025** (9M FY26), VONB registered a **17%** rise, totaling **₹5,040 crore**, on a **27.2%** margin. The company retained its industry leadership, commanding a **25.6%** market share in the Individual Rated Premium segment across the private market. Gross Written Premium (GWP) climbed **20%** year-on-year to **₹73,350 crore** during the nine-month duration. *** Financial Strength and Reserves The balance sheet demonstrated continued strength and stability. Assets under Management (AUM) expanded by **16%**, rising to **₹5.12 trillion** as of December 31, **2025**. Net worth strengthened by **15%**, increasing to **₹19,010 crore**. The company’s embedded value grew by **18%** to **₹801.3 billion** at the close of the period. The investment portfolio remains highly conservative, with a **59:41** debt-equity allocation, and nearly **95%** of debt investments are placed in AAA-rated and sovereign instruments. Critically, the Solvency Ratio stood at a robust **191%**, comfortably above the regulatory mandate of **150%**, indicating a strong financial cushion. *** Operational Focus and Costs Operational metrics reflect sustained quality, with the net claims settlement ratio remaining high at **99.3%**. Customer retention improved, evidenced by the 13th-month persistency ratio rising by **101 basis points** to **87.1%**. Strategic product diversification saw the protection segment deliver strong growth, increasing by **44%**. Distribution remains heavily reliant on the core bancassurance channel, which contributed **62%** of the annualized premium equivalent. Digital adoption continues to improve efficiency, with **99.7%** of individual proposals being submitted digitally. The quarter saw operational costs rise, however. The operating expense ratio increased to **6.2%** from **5.3%** year-over-year, leading the total cost ratio to climb to **11.2%**. Management guidance aims to sustain margins between **26%** and **28%** by optimizing the product and distribution mix. *** Market Snapshot SBI Life closed trading on January **28, 2026**, at **₹2,053**. The company holds a market capitalization of over **₹2.04 lakh crore**. The stock trades at a Price-to-Earnings ratio of **83.32**, reflecting premium valuation compared to broader indices. The consensus view among analysts suggests a near-term upside target of approximately **9%** from current levels.
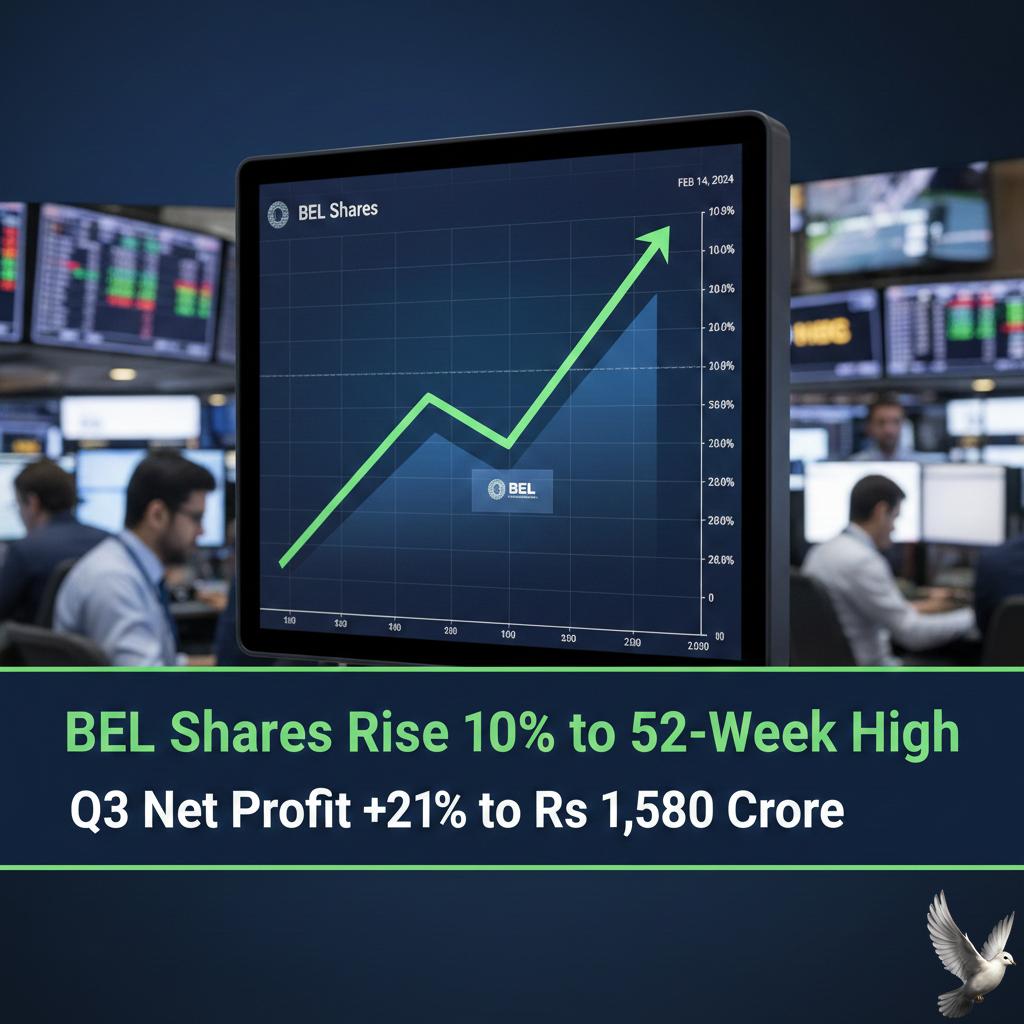
BEL Shares Rise 10% to 52-Week High as Q3 Net Profit Grows 21% to Rs 1,580 Crore
Bharat Electronics Ltd. (BEL) cemented its leadership in the strategic electronics space by posting a robust operational performance for the third quarter of the fiscal year 2026. The strong results immediately catalyzed a significant rally in the stock, driving shares to a new 52-week high. The defence public sector undertaking reported a consolidated net profit, or Profit After Tax (PAT), of **₹1,579 crore** for the December quarter. This represented a substantial increase of over **21%** compared to the same period in the previous year, surpassing many analyst expectations. Revenue from operations mirrored this growth trajectory, surging by approximately **24%** year-over-year to reach **₹7,154 crore**. This performance highlights BEL's efficient execution of existing contracts and its ability to capitalize on the sustained demand from the armed forces. The company demonstrated improved efficiency, with its Earnings Before Interest, Tax, Depreciation, and Amortization (EBITDA) margin expanding to **29.7%** in Q3, up from **28.9%** a year prior. Better cost management and operating leverage were key factors in this expansion, underscoring sustained profitability momentum. Following the announcement, BEL shares reacted sharply, closing the session at **₹453.00**. This single-day movement marked a gain of nearly **9%**, reflecting aggressive market buying interest. The stock touched an intraday **52-week high of ₹457.50**. The market's confidence is strongly underpinned by the company’s extensive pipeline of future work. As of January 1, 2026, BEL’s order book stood at a massive **₹73,015 crore** (or **₹730.20 billion**). This backlog provides clear revenue visibility for the coming several years, mitigating concerns about future demand volatility. Furthermore, the company has continued to secure fresh business in the current month, having bagged additional orders worth **₹610 crore** in January alone. These inflows span specialized equipment including radars, communication systems, simulators, and fire control systems. BEL is positioned at the epicenter of India’s push for defence indigenization. The entire domestic defence sector is currently transitioning from a phase focused on "order anticipation" to a "high-octane execution" phase. This broader ecosystem shift is highly favorable for electronics players. The national focus on self-reliance has propelled domestic defence production to a record high, crossing **₹1,50,000 crore** in the previous fiscal year. Government targets are set for manufacturing to reach **₹3,000 billion** by the year 2029, making BEL, as a core technology provider, a central beneficiary of this multi-year spending theme. Management remains highly confident in achieving or even exceeding its sales growth guidance for the current financial year. The company expects the final quarter to be materially strong, aligning with the traditionally robust seasonal patterns of the defence sector. BEL continues to prioritize maintaining a healthy EBITDA margin, guided at approximately **27%** for the full year. Strategic efforts like increasing indigenization and optimizing the product mix are central to sustaining these profitability levels, securing its dominant position in the aerospace and defence electronics market.
ACC Q3 Profit Falls 63% YoY to Rs 404 Crore, Revenue Rises 22%
**MARKET BRIEF: ACC Limited Q3 FY26 Performance Update** **Financial Snapshot** ACC Limited, an Adani Group subsidiary, reported a mixed set of numbers for the quarter ended December 31, 2025. Consolidated net profit fell sharply by **63%** year-on-year (YoY) to **₹404 crore**, down from ₹1,092 crore in the corresponding quarter last year. This decline was largely influenced by a high base effect from a one-off gain in the previous year and rising operational costs. Conversely, top-line performance was robust. Revenue from operations climbed **22%** YoY to **₹6,391 crore**, driven by strong domestic demand and volume expansion. **Operational Highlights** * **Record Volumes:** Cement sales volumes hit a historic high of **11.3 million tonnes (MT)**, registering a **15%** growth YoY. The Ready Mix Concrete (RMC) segment also surged, with volumes up **36%**. * **Premiumization Strategy:** The company reported a **33%** jump in premium product sales, which now constitute a larger share of the trade portfolio, aiding realization levels. * **Margin Pressure:** despite higher revenues, EBITDA margins compressed to **10.8%** (down from 18.8% YoY). Input cost inflation weighed heavily, with freight and other expenses rising by approximately **20-22%**. **Market Reaction & Stock Performance** Following the announcement on January 28, 2026, ACC shares traded softly, hovering around **₹1,681–₹1,685** on the BSE. The stock has been under pressure recently, trading near its **52-week low** of ~₹1,664, reflecting investor caution regarding profitability despite the volume leadership. **Strategic Outlook** Management remains focused on the "One Cement Platform" strategy, moving towards a full amalgamation with Ambuja Cements to unlock synergies. Immediate priorities include cost optimization—specifically targeting logistics and power costs through increased green power usage—to restore margin health in upcoming quarters. **Next Step:** I can prepare a comparative analysis of ACC versus peers like UltraTech or Ambuja Cements to highlight relative valuations and efficiency metrics.
Adani Electricity Mumbai Receives Sovereign-Grade Rating Following Deleveraging
Adani Electricity Mumbai Achieves Sovereign-Grade AAA Rating **Market Brief | January 29, 2026** **Rating Upgrade & Strategic Milestone** Adani Electricity Mumbai Ltd (AEML) has secured a **AAA** credit rating from India Ratings, marking a historic shift as India’s first private power distribution utility to match the sovereign credit profile. This upgrade underscores a successful turnaround following its 2018 acquisition, driven by a stable regulatory environment and disciplined capital allocation. **Financial Performance & Deleveraging** The utility’s financial health has strengthened significantly, supported by predictable cash flows under a cost-plus regulatory model. * **Asset Base:** Expanded to over **₹10,000 crore**, with the Regulated Asset Base (RAB) projected to cross **₹100 billion** by the end of fiscal 2026. * **Leverage:** Gross adjusted debt-to-RAB is forecast to drop below **1.0x** by FY26, highlighting sustained deleveraging despite elevated capital expenditure. * **Risk Management:** Long-term foreign currency borrowings are fully hedged, insulating the balance sheet from currency volatility and refinancing risks. **Operational Efficiency** AEML continues to outperform industry benchmarks, cementing its position as one of the country's most efficient utilities. * **Distribution Losses:** Reduced to **4.3%** in 1H FY26, down significantly from pre-acquisition levels. * **Collection Efficiency:** Remains robust at nearly **99%**, ensuring strong liquidity. * **Renewable Transition:** Green energy now accounts for **~40%** of the procurement mix (up from <3% in 2019), with a firm target to reach **60% by 2027**. **Sector Outlook** The upgrade reflects investor confidence in the Mumbai utility sector, bolstered by timely tariff orders from the Maharashtra Electricity Regulatory Commission (MERC). These orders have enabled the full recovery of past regulatory assets, shifting regulatory balances into a surplus position for FY26.
European Shares Pause; ASML Bucks Weakness
The pan-European equity surge stalled midweek as attention shifted sharply from broader market momentum to a crucial round of corporate earnings and forward guidance. Investors took profit after two consecutive days of gains, resulting in a widespread dip across continental indices. The benchmark **Stoxx 600 Index** fell approximately **0.7%**, closing the session at **608.51 points**. This retreat was characterized by defensive positioning ahead of key macroeconomic events, most notably the impending rate decision from the US Federal Reserve. **Luxury Sector Collapse Weighs Heavily** Sectoral performance was highly divergent, with luxury goods stocks acting as the primary drag on the overall market. The luxury sub-index experienced its fourth straight day of losses, tumbling **3.8%**. This severe sell-off was triggered by cautious commentary from key executives in the industry regarding the outlook for consumer demand in the year ahead. **LVMH**, the industry behemoth and owner of brands like Louis Vuitton, saw its shares plummet by **7.9%**. Other major players followed suit, with Gucci-owner Kering and Hermes also posting significant declines. This caution highlights investor sensitivity to slowing global demand signals, particularly from key markets in Asia. Meanwhile, national benchmarks reflected the broader weakness. The **FTSE 100** in London slipped **0.35%** to **10,172**, while key markets in France and Spain each recorded drops exceeding **1%** on the day. **ASML: An AI-Fueled Record** In contrast to the overall subdued mood, the technology sector showed initial robust strength, climbing over **2%** early in the session, largely fueled by the performance of European chip equipment maker **ASML Holding NV**. ASML, the central figure in global semiconductor manufacturing, provided a massive positive surprise to the market. The company reported record-breaking net bookings for the fourth quarter of 2025, totaling **€13.2 billion**. This figure was more than double the consensus expectation from analysts, signaling a sharp rebound in chipmaker capital expenditure. The company's full-year 2025 results showed total net sales reaching **€32.7 billion** and net income hitting **€9.6 billion**. The strong order flow was directly attributed by management to robust demand linked to the build-out of artificial intelligence infrastructure globally. ASML's record orders initially sent its stock surging to a **new record high**, confirming the original market sentiment. However, the gains proved unsustainable as broader market caution set in. The stock eventually closed the session down **1.9%** from its previous close, despite the stellar results, reflecting concerns over its already high valuation multiples. **Global Indicators and Geopolitical Risk** Beyond Europe, global macro-financial conditions remained a significant factor. The market continues to operate under the cloud of geopolitical risks, which supervisors across the UK and EU have listed as top priorities for 2026, stressing the need for banks to strengthen resilience. Investor attention was also fixed on the United States, where the S&P 500 briefly broke the **7,000** threshold for the first time, buoyed by AI optimism. However, the impending earnings reports from major US tech giants, including Microsoft and Meta, maintained a high level of nervousness regarding the sustainability of corporate spending. Currency markets saw the **US dollar** hover near a four-year low against a basket of peer currencies. This ongoing dollar weakness fueled a flight to traditional safe-haven assets. As a result, spot **gold** experienced a strong upward trajectory, crossing the significant **$5,300** per ounce level momentarily and settling higher at **$5,275** an ounce by the session close.
Nikkei Ends Steady as Tech Gains Offset Strong Yen Impact
**Market Brief: Nikkei Steady on Chip Sector Surge** **Current Status: Thursday, Jan 29, 2026** Japan's Nikkei 225 remains resilient, trading near **53,360** (+0.05%) in today's session. The index is holding onto gains from Wednesday’s close, largely driven by a renewed rally in semiconductor stocks that offset pressure from a strengthening Yen. **The Catalyst: ASML’s Record Shattering Orders** Global sentiment shifted sharply after Dutch chip equipment giant ASML reported blockbuster Q4 2025 results. * **Record Bookings:** ASML posted net bookings of **€13.2 billion**, nearly double the market consensus of €6.85 billion. * **AI Demand:** Surge attributed to insatiable demand for AI-related infrastructure and EUV lithography systems. * **Outlook:** Company projects 2026 sales between **€34 billion and €39 billion**, signaling sustained industry growth. **Sector Impact: Japan Tech Rally** The "ASML shock" immediately lifted Japanese semiconductor heavyweights, which are critical suppliers in the global chip supply chain. * **Tokyo Electron:** Surged approximately **4%**, capitalizing on the capex outlook. * **Advantest:** Gained over **2.3%**, tracking the AI-testing demand wave. * **SoftBank Group:** Added **3.1%**, riding the broader tech optimism. **Broader Market Headwinds** Despite the tech euphoria, upside is capped by macroeconomic factors: * **Currency Drag:** A sharply stronger Yen (trading around **153.59** per USD) is weighing on traditional export-heavy sectors like automotives. * **Fed Policy:** The US Federal Reserve kept interest rates unchanged in its latest decision, maintaining a cautious global liquidity environment. * **Mixed Sentiment:** While the Nasdaq 100 hit 3-month highs, the broader Japanese market remains mixed as investors balance tech optimism against currency risks. **Key Takeaway** The Nikkei is currently trading a bifurcation: **AI and Chip Equipment stocks** are aggressively outperforming, acting as a pillar against the drag from a rising Yen and cautious manufacturing data.
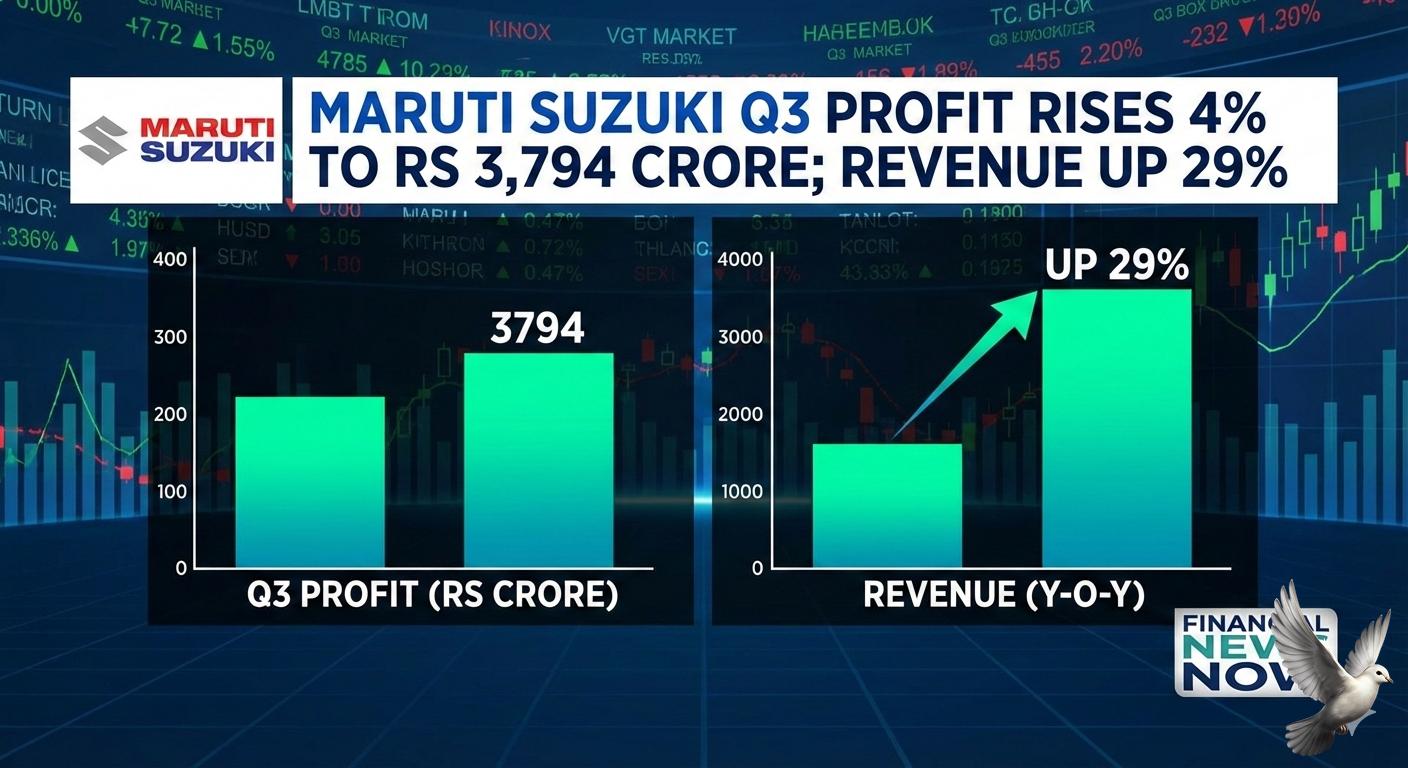
Maruti Suzuki Q3 Standalone Profit Rises 4% to Rs 3,794 Crore; Revenue Up 29%
**MARKET BRIEF: MARUTI SUZUKI Q3 FY26 EARNINGS** **Overview: Revenue Surges, One-Offs Weigh on Bottom Line** Maruti Suzuki India Limited has released its financial results for the third quarter of FY26, presenting a complex picture of record-breaking sales volumes tempered by regulatory adjustments. The country’s largest carmaker reported a **4% year-on-year rise** in net profit to **Rs 3,794 crore** for the quarter ended December 31, 2025. While positive, the bottom-line growth trailed the robust **29% increase** in revenue, which climbed to **Rs 49,891 crore**. The divergence between top-line surge and moderate profit growth highlights the impact of specific operational headwinds faced during the quarter. Despite achieving its highest-ever quarterly domestic sales, profitability was constrained by a significant one-time provision and softer export realizations. **Financial Performance Deep Dive** The headline revenue growth of nearly **30%** signals strong underlying demand. This performance was underpinned by a sharp recovery in the domestic market, particularly within the small car segment. Operational EBITDA rose **10%** to approximately **Rs 5,572 crore**, though margins contracted slightly to **11.2%**, compressed by rising input costs and the aforementioned one-off items. A key factor dampening net profit was a one-time provision of **Rs 594 crore** related to the implementation of new labor codes. Without this exceptional item, the core profitability trajectory would have likely mirrored the impressive revenue expansion more closely. Additionally, while export volumes remained healthy, "lower export proceeds" acted as a drag on the overall financial efficiency for the quarter. **Operational Highlights: Record Sales & Policy Tailwinds** The quarter was historic for Maruti Suzuki in terms of volume. The company clocked its **highest-ever quarterly domestic sales** of **564,669 units**, a substantial leap from **466,993 units** in the same period last fiscal (Q3 FY25). Total sales, including exports, touched a record **667,769 units**. A primary driver for this volume explosion appears to be the recently enacted GST reform. The shift of the small car segment into the **18% GST bracket** has revitalized demand in this price-sensitive category. The company noted that this policy shift alone accounted for an incremental volume of over **68,000 units**, signaling a potential structural turnaround for the entry-level hatchback market which had been under pressure in previous years. **Market Reaction & Stock Movement** Investors reacted with initial caution, leading to high volatility in the trading session following the announcement. Maruti Suzuki shares witnessed a sharp intraday sell-off, plunging over **5%** to hit a low of **Rs 14,431**. However, the market absorbed the "miss" on the profit front once the one-off nature of the labor code provision was digested. Buying interest emerged at lower levels, helping the stock recover significantly from its day's low. By the closing bell, the stock had pared most losses, settling near **Rs 14,880**. This resilience suggests that the street is prioritizing the record volume growth and the structural benefits of the GST reforms over the transient hit to quarterly earnings. **Forward Outlook** The results set a confident tone for the remainder of FY26. With the "small car" engine firing again due to favorable tax structures and rural demand stabilizing, the company is well-positioned to defend its market share. The key monitorable going forward will be the normalization of export revenues and the management of input costs to restore EBITDA margins to the **13-14%** range seen in previous high-growth cycles.
BEL Q3 Net Profit Rises 21% to Rs 1,580 Crore; Revenue Up 24%
**MARKET BRIEF: BHARAT ELECTRONICS LTD (BEL) Q3 FY26** **Robust Q3 Performance Beats Estimates** State-owned defence major Bharat Electronics Ltd (BEL) delivered a stellar performance for the quarter ended December 2025, significantly outpacing analyst expectations. The company reported a consolidated net profit of **Rs 1,580 crore**, marking a sharp **21%** year-on-year surge. **Key Financial Metrics** * **Revenue:** Operations revenue climbed **24%** YoY to **Rs 7,154 crore**, driven by accelerated execution in defence electronics. * **Profitability:** Strong operational efficiency pushed EBITDA margins to **29.7%** (up 100 bps YoY), defying expectations of margin contraction. * **Growth:** This marks a continued double-digit growth trajectory, supported by the government’s push for indigenisation in defence manufacturing. **Order Book & Visibility** Revenue visibility remains exceptional with a total order book standing at **Rs 73,015 crore** as of January 1, 2026. Recent wins include contracts for communication equipment, electronic warfare systems, and radars, reinforcing the company's dominance in the domestic defence ecosystem. **Market Reaction** Investors responded enthusiastically to the earnings beat. BEL shares surged over **9%** in intraday trade, hitting **Rs 454** and approaching the 52-week high. High trading volumes indicate strong institutional accumulation following the results. **Outlook** Analysts remain bullish, citing BEL’s consistent execution, healthy cash flows, and strategic position in upcoming defence modernization programs (UAVs, anti-drone systems) as key drivers for sustained long-term value.
TVS Motor Q3 Consolidated PAT Rises 49% YoY to Rs 841 Crore; Revenue Up 34%
**TVS MOTOR ACHIEVES RECORD Q3 RESULTS AMIDST ACCELERATING EV PUSH** TVS Motor Company has delivered its highest-ever quarterly performance, capping the calendar year 2025 with stellar financial results for the third quarter of Fiscal Year 2026. The two and three-wheeler major continues to strengthen its domestic and international footprint, successfully capitalizing on robust consumer demand and its strategic focus on premiumization. *** **FINANCIAL POWERHOUSE PERFORMANCE** The company's consolidated net profit for the quarter ended December 31, 2025, surged by **49%** year-on-year (YoY). This translated into a profit after tax (PAT) of **₹841 crore**, sharply higher than **₹566 crore** reported in the corresponding period of the previous fiscal year. Revenue from operations followed suit, climbing **34%** to an all-time high of **₹14,756 crore**, up from **₹11,034 crore** YoY. This marks a continuation of double-digit revenue growth momentum. Operational efficiency saw significant improvement, with the Earnings Before Interest, Taxes, Depreciation, and Amortisation (EBITDA) margin expanding to a record high of **15.39%**. This margin expansion reflects effective cost management and a favorable product mix leaning towards higher-margin vehicles. *** **SALES VOLUME BREAKDOWN** TVS Motor achieved its highest ever quarterly sales volume. Overall two-wheeler and three-wheeler sales, including international business, grew **27%** to a record **15.44 lakh units** in the December quarter. This volume growth was instrumental in driving the topline. The motorcycle segment was a primary growth driver, registering a **31%** increase in sales volume, reaching **7.26 lakh units**. Scooter sales were also robust, rising **25%** to **6.14 lakh units**, underscoring strong urban and semi-urban recovery. International two-wheeler sales also saw significant expansion, growing **35%** YoY. Furthermore, the three-wheeler segment experienced substantial growth, more than doubling its volume with a **106%** surge to **0.60 lakh units**. *** **ELECTRIC VEHICLE MARKET LEADERSHIP** The company cemented its position as a key leader in India’s electric mobility transition. Electric vehicle sales saw a substantial jump of **40%** in Q3 FY26, hitting a record **1.06 lakh units** for the quarter. This performance comes amidst a broader slowdown in the pure electric two-wheeler segment, which grew only marginally at **4.4%** in 2025 to **1.28 million** units industry-wide. TVS Motor remains the market leader in the electric space, posting over **300,000** unit sales in the calendar year, indicating significant share capture and consumer acceptance of its flagship EV model. The electric vehicle market remains supported by evolving government schemes like EMPS, which aim to sustain momentum despite reduced subsidies compared to previous policies. The industry overall is poised for strong long-term growth, with forecasts suggesting the Indian EV market could reach **4.0 million** units by 2026. *** **STOCK PERFORMANCE AND VALUATION** Following the results announcement on January 28, 2026, the company's stock exhibited strong movement, closing at approximately **₹3,733.65**, registering a daily gain of **4.72%**. Over the past year, TVS Motor has delivered stellar returns of nearly **60%**, significantly outpacing the benchmark indices. The market capitalization now stands close to **₹1,77,381 crore**. This robust investor confidence reflects the market's positive outlook on the company’s ability to deliver sustained earnings growth and successfully navigate the strategic shift towards electric mobility and premium product lines.

Value Hunting Amid Global Market Navigation
**India Market Brief: Strategic Value in Volatility** **Current Landscape** Indian equities are navigating a phase of cautious consolidation as of late January 2026. The **Nifty 50** is trading near **25,240**, while the **Sensex** hovers around **82,000**. Volatility remains a key theme, with the India VIX edging up to **14.45**, signalling potential sharp swings ahead of the Union Budget and amid mixed global cues. **Institutional Activity** Foreign Institutional Investors (FIIs) remain net sellers, exerting pressure on headline indices. However, domestic liquidity provides a crucial floor, with Domestic Institutional Investors (DIIs) continuing to absorb sell-offs. This tug-of-war highlights the importance of a selective investment strategy over broad index-level bets. **Expert Outlook: Selective Value Hunting** Market veteran Punita Kumar Sinha advises a nuanced approach for 2026. While the general sentiment is cautiously optimistic compared to 2025, the "easy money" phase is over. Investors are urged to pivot towards value hunting with a focus on stock-specific fundamentals rather than relying on sector-wide rallies. **Sectoral Opportunities** * **Equities:** Remain the dominant asset class for domestic investors given limited avenues for overseas diversification. The focus is shifting to companies with visible earnings growth, particularly those trading at reasonable valuations after recent corrections. * **Commodities:** Precious metals are back in focus. Gold and silver are gaining traction as tactical hedges against geopolitical instability and currency fluctuations, with silver also benefiting from industrial demand in clean energy and tech. * **Real Estate:** The sector shows mixed signals. While the luxury segment anticipates a slight moderation after a strong run, high-net-worth demand remains resilient. Investors are becoming more discerning, favouring quality assets in prime urban locations over speculative land deals. * **IT & Technology:** The outlook here is strictly stock-specific. The sector faces muted revenue growth forecasts for Q3 FY26, and Indian firms are playing catch-up in the global AI race. Opportunities exist, but they require identifying companies that are successfully integrating new tech to defend margins. * **Capex Cycle:** Infrastructure and capital goods remain structurally positive, supported by government spending and early signs of a revival in private capital expenditure. Investors should watch for firms benefitting from the production-linked incentive (PLI) schemes and the evolving India-EU trade narratives. **Key Watchlist** Traders should monitor the **24,900** support level on the Nifty. A breach below this could trigger further weakness, while a decisive move above **25,300** is needed to revive bullish momentum. The upcoming Union Budget will be the critical trigger determining the next directional move for the markets. **Video: Punita Kumar Sinha on Market Outlook** [Punita Kumar Sinha on India's 2026 market outlook](https://www.youtube.com/watch?v=WVRXoB25w2Q) This video provides direct insight from Punita Kumar Sinha regarding her optimistic yet cautious stance for 2026, detailing why stock selection is critical in the current environment. http://googleusercontent.com/youtube_content/0

Defence Stocks Rally Ahead of Union Budget 2026
The fiscal policy environment remains characterized by strict discipline, but market projections signal a meaningful restructuring within the government’s capital expenditure priorities. The focus is shifting towards strategic sectors that offer high growth multipliers. Overall projections indicate that public investment momentum will be sustained. Total government capital expenditure is expected to cross the **Rs 12 lakh crore** threshold in the Financial Year 2027. This represents a robust year-on-year growth rate, with estimates climbing in the range of **10%** to **12%**. This continued push on infrastructure is essential, particularly as recent data indicates a sequential softening in private sector capital expenditure plans. Market consensus forecasts see the central government’s total capital outlay reaching approximately **Rs 12.5 lakh crore** for FY27, underpinning the government’s primary role in driving asset creation and economic activity. The most aggressive growth is anticipated in the Defence capital outlay, which is poised to significantly outperform the general capex increase. Projections indicate defence capital spending could soar by as much as **25%** to **30%** in the upcoming fiscal year. This accelerated growth is a direct reflection of the national mandate on indigenization, military modernization, and enhancing domestic manufacturing capabilities. The anticipated allocation is expected to push the Defence capital budget to between **Rs 2.1 lakh crore** and **Rs 2.3 lakh crore** for the year. The funding boost will be channeled into major capital acquisition programs. Key priorities include advanced technology platforms such as Unmanned Aerial Vehicles, counter-drone systems, missile technologies, and indigenous naval platforms. Modernization efforts are projected to utilize roughly **Rs 1.5 lakh crore** for capital acquisitions alone. Supporting this strategic pivot, allocation for Defence Research and Development is also expected to rise substantially. This targets critical areas like advanced electronics, cybersecurity, and artificial intelligence applications for military use. On the broader macroeconomic front, this sustained investment strategy is coupled with a steady path toward fiscal consolidation. Analysts project the fiscal deficit will continue to narrow, targeting approximately **4.2% of GDP** in FY27. Net central government borrowing for the fiscal year is estimated to be around **Rs 11.7 lakh crore**. This borrowing strategy is designed to finance the planned investments while managing debt sustainability objectives, moving the debt-to-GDP ratio toward its medium-term target of **50%**. Market participants are observing the sectoral beneficiaries closely. Traditional infrastructure-linked sectors like **cement**, **steel**, and **capital goods** remain positioned to benefit from the general capex continuity. However, the multi-year outlook for the Defence sector, driven by anticipated spending growth of up to **25%**, marks domestic defence manufacturers and integrated electronics companies as primary strategic beneficiaries. The overall financial strategy is one of focused growth intervention, leveraging public capital expenditure as the core economic multiplier while maintaining prudence in fiscal management.

Shriram Finance Stock Performance: One-Year Growth Analysis
**Shriram Finance: Market Brief and Capital Outlook** Shriram Finance has cemented its position as a market powerhouse, driven by strategic capital infusion and sustained operational growth. The stock has delivered an exceptional return, gaining approximately **90.5%** over the past twelve months. This rally makes it a key outperformer in the non-banking financial services segment. The underlying metrics show robust momentum across key business lines. As of the end of the December 2025 quarter, Assets Under Management (AUM) expanded by **14.6%** year-on-year, reaching a substantial **₹2.91 trillion**. This growth is supported by strong traction in core commercial vehicle, passenger vehicle, and MSME loan segments. *** Despite the strong fundamentals, the rapid ascent has triggered technical caution. Momentum indicators currently signal that the stock is trading at **extremely overbought levels**. This suggests the high potential for near-term **consolidation** or minor profit booking as the market digests the significant gains recorded in the last year. Analysts largely maintain a constructive view on the stock's long-term prospects, with several research houses reiterating 'Buy' ratings and setting target prices as high as **₹1,200**. They view any current price weakness as a potential buying opportunity, based on the company’s structural advantages. *** The most significant recent event is the landmark capital infusion deal. Shareholders have overwhelmingly approved the preferential issue of equity shares to Japan’s **MUFG Bank Ltd**. This deal involves a massive capital injection of approximately **₹39,618 crore**, or about **$4.4 billion**, for a **20%** equity stake. This investment is cited as one of the largest foreign direct investments in India's financial sector. It fundamentally strengthens the company’s capital base, which is already robust with a capital adequacy ratio of around **20.7%**. The strategic partnership is expected to accelerate growth, potentially leading to lower costs of borrowing and favorable credit rating upgrades in the near future. *** The operational performance remains solid, highlighted by the results for the quarter ended December 2025. Profit After Tax (PAT), excluding one-time exceptional items from the prior year, demonstrated healthy growth of over **21%**. Crucially, the Net Interest Margin (NIM) has begun to recover, improving approximately **40 basis points** quarter-on-quarter to around **8.6%**. This improvement stems from a rationalization of excess liquidity held on the balance sheet and a decline in the overall cost of funds. Management is confident that NIMs will be sustained in the **8.5% to 9.0%** range in the near term. Asset quality is stable. Gross Stage 3 assets, a measure of bad loans, stood at approximately **4.54%**, while Net Stage 3 assets improved slightly to **2.38%**. The company anticipates credit costs will moderate further, supported by improving collection efficiencies. Looking ahead, management is focused on utilizing the newly bolstered capital to pursue an ambitious AUM growth trajectory of **18% to 20% CAGR** over the medium term. This will involve accelerated entry into secured MSME lending and the new commercial vehicle financing space, diversifying the portfolio beyond the core used-vehicle segment. *** The video below features the CEO of Shriram Finance discussing his confidence regarding the company's Q4 performance following strong growth in Q3. [Why Shriram Finance CEO Is Confident About Q4](https://www.youtube.com/watch?v=Hu9Y_ZV3_v8) http://googleusercontent.com/youtube_content/0
Swiggy Q3 Preview: Instamart Investments Widen Losses Alongside Anticipated 47% YoY Revenue Jump
The market brief below reflects the current trends and financial projections as of January 2026. Swiggy is anticipated to post a sharp widening of its consolidated net loss for the December 2025 quarter, designated as Q3 FY26. This pressure on the bottom line is expected despite robust revenue performance driven by the quick commerce segment. Analysts project the average consolidated net loss for the quarter will reach approximately **₹983.23 crore**, significantly higher than the **₹693.6 crore** loss reported year-on-year. Brokerage estimates for the Q3 loss range widely, from **₹804 crore** on the lower end to **₹1,045 crore** at the high end. This widening gap signals the aggressive nature of current market investments. *** Top-line figures, however, remain strong. Q3 FY26 revenue is projected to surge by **47%** to **48%** Year-on-Year, with total revenue estimated to reach around **₹5,909.5 crore**. The quick commerce vertical, **Instamart**, stands as the primary engine for this explosive growth. Instamart's Gross Merchandise Value (GMV) is projected to jump by an estimated **108%** over the previous year. This massive expansion, while driving scale, is directly responsible for the deepening losses. The segment demands continuous capital infusion to establish new dark store infrastructure and cover higher fixed operating costs. *** The competitive landscape in rapid grocery delivery is intensifying, forcing Swiggy to maintain aggressive pricing strategies. This high-burn environment is reflected in the segment's forecast, with substantial EBITDA losses for Instamart projected between **₹870 crore** and **₹920 crore** by major institutional analysts. The need for significant investment is critical to maintain market share against agile rivals like Zepto and the well-capitalized Blinkit, owned by Zomato. *** In contrast, the core **Food Delivery** segment is establishing itself as the operational anchor of the business, showing steady progress toward sustainable profitability. The food delivery vertical is projected to see healthy revenue growth of approximately **22%** Year-on-Year for Q3 FY26. Crucially, the segment’s contribution margins are improving, anticipated to expand sequentially to roughly **7.5%** for the quarter. This expansion is driven by improved order densities and increased operational efficiencies. *** In the public market context, Swiggy completed its Initial Public Offering (IPO) in November 2024, raising **₹11,327.43 crore** at a price band centered at **₹390** per share. Since listing, the stock has experienced notable volatility, trading near its issue price following a peak-to-trough decline of **56%**. This performance indicates heightened investor scrutiny regarding the company’s ability to transition from growth-at-all-costs to positive unit economics. Despite recent stock fluctuations, institutional backing remains firm. Institutional investor ownership in the company rose for the third consecutive quarter, climbing to **38.6%** in the December 2025 quarter. The current financial challenge is managing the high-burn quick commerce engine without compromising the profitable maturation of the food delivery business. Investors are focused on the company's strategy to navigate this duality and prove a viable path to long-term consolidated profitability.

CarTrade Tech Shares Decline Following Q3 Results
The market currently views CarTrade Tech’s recent financial results with a cautious eye, focusing squarely on top-line deceleration despite robust profitability metrics. *** The multi-channel auto platform reported Q3 FY26 consolidated net profit jumping by approximately **31.5%** year-over-year (YoY). This strong performance pushed net profit to **₹56 crore** for the December quarter, up significantly from **₹42.7 crore** in the corresponding period last year. Profitability surged due to exceptional cost management and operating leverage. Earnings Before Interest, Tax, Depreciation, and Amortisation (EBITDA) climbed an impressive **56%** YoY to reach **₹78 crore**. Consequently, the EBITDA margin expanded sharply by nearly **9 percentage points**, settling at a high of **37.2%**. This margin expansion was notable not only year-over-year but also sequentially. The market, however, prioritized the pace of revenue growth, which showed signs of slowing momentum. Revenue from operations grew **19%** YoY to **₹209.7 crore**. While this represents double-digit growth, investors were concerned that this rate moderated significantly from the **25%** revenue growth achieved in the prior September quarter (Q2 FY26). Following the announcement, shares experienced a sharp decline, sliding as much as **10.7%** to hit a low of **₹2,270** on the BSE. This reaction underscores a deep investor focus on sustained, accelerating top-line expansion for tech platforms, often overshadowing short-term profitability gains. *** Operationally, the digital platform continues to demonstrate strong user engagement. The company maintained nearly **85 million** average monthly unique visitors during the quarter. Crucially, **95%** of this vast audience continues to arrive through organic traffic, confirming brand strength and minimizing customer acquisition costs. The vehicle remarketing business segment is scaling efficiently. It recorded an annualized run-rate of **1.9 million** auction listings, reinforcing the platform’s dominant position in the segment for used vehicles. CarTrade Tech maintains a robust financial structure. The company is characterized by being almost **debt-free**, a key strength in the digital sector. Long-term performance metrics show strong fundamentals, with the company delivering a good five-year profit growth CAGR of **55.7%**. The company’s share price has experienced significant volatility, reflecting its growth-stage status. Despite the recent price drop, the stock’s current price level is still far above its 52-week low of approximately **₹1,318**, although substantially below its 52-week high near **₹3,291**. The focus now shifts to whether the management can stabilize and re-accelerate revenue growth in the forthcoming quarters while sustaining the newly established high margin profile. The market will be watching for clear strategies to monetize the high organic traffic base more aggressively and demonstrate sequential growth momentum returning to the business. The combination of strong operational profitability and top-line stabilization remains key to unlocking further shareholder value.
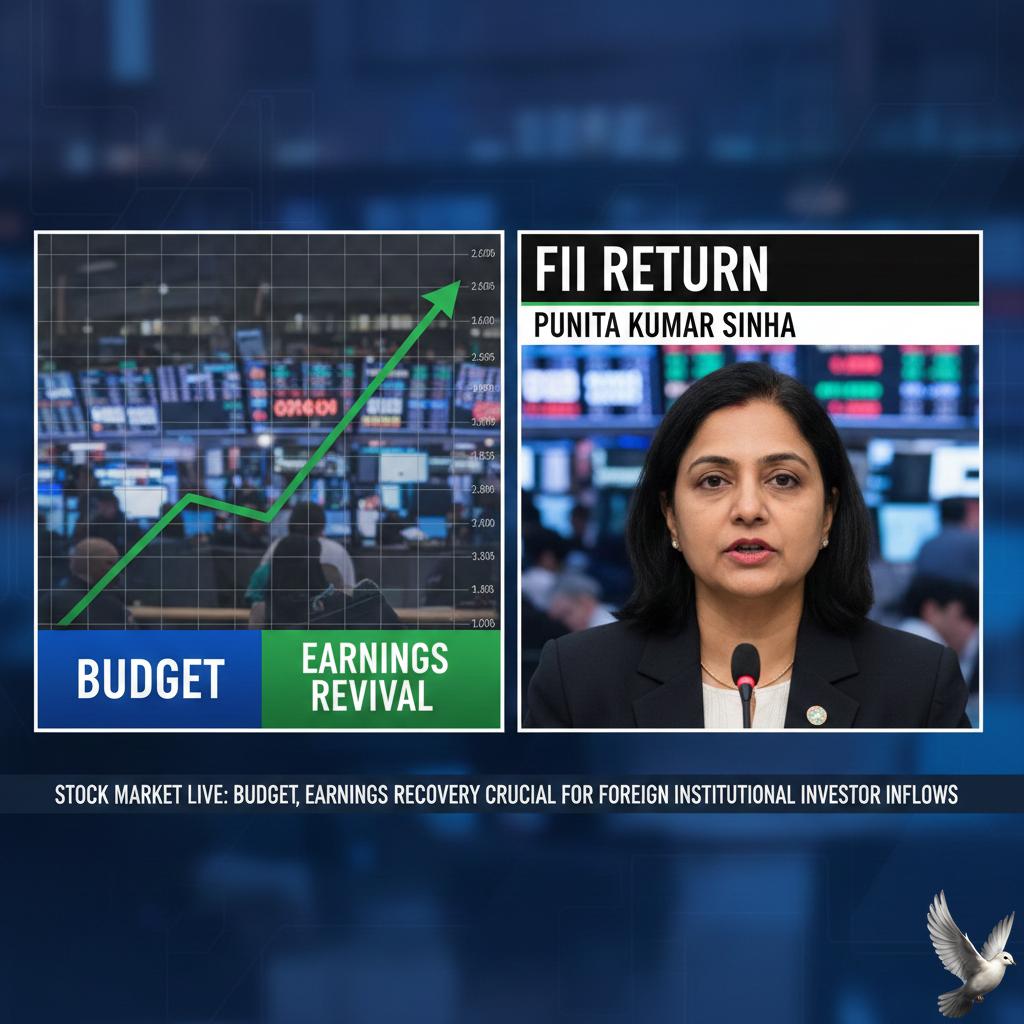
Budget, Earnings Revival Key for FII Return: Punita Kumar Sinha
**Market Brief: Optimism Returns Ahead of Budget Week** **Current Snapshot** Indian markets have snapped their cautious streak, surging in today's trade. The **Sensex** jumped over **600 points** to reclaim the **82,500** level, while the **Nifty 50** rose nearly **200 points** to trade comfortably above **25,370**. **The Catalyst: Historic India-EU Trade Pact** The primary trigger for today's rally is the conclusion of the landmark **India-EU Free Trade Agreement (FTA)**. Dubbed the "mother of all deals," this agreement significantly slashes tariffs on key sectors including automobiles (down from **110%** to **10%**), machinery, and wines. This development has provided the exact positive spark strategists were waiting for. **Institutional Flows** * **FIIs:** Foreign Institutional Investors remain net sellers, offloading approximately **₹3,068 crore** in the previous session. * **DIIs:** Domestic investors continue to stabilize the market, buying heavily with inflows exceeding **₹8,999 crore**. **Strategist View** Market veteran Punita Kumar Sinha’s recent assessment appears validated. She argued that the prevailing pessimism was "overdone" and identified the EU trade deal as a critical valuation trigger. With valuations now looking reasonable and the trade pact secured, sentiment is shifting from caution to selective accumulation. **Earnings & Budget Outlook** * **Q3 Earnings:** The season remains mixed. While manufacturing and industrial stocks (like **Havells** and **CEAT**) are shining, consumption themes face headwinds, with **Asian Paints** dropping nearly **6%** on weak numbers. * **Budget 2026:** As the February 1 Union Budget approaches, expectations are pivoting toward a "Build India" theme, emphasizing capital expenditure in infrastructure and defense over broad consumption stimulus. **Key Watch** Traders will now monitor if the FTA optimism can sustain momentum through the pre-budget volatility, specifically tracking if FII outflows begin to reverse in response to the new structural positives. [Budget, earnings revival crucial to lure FIIs back to India](https://www.youtube.com/watch?v=WVRXoB25w2Q) This video features Punita Kumar Sinha discussing the exact market catalysts mentioned in the brief, including the impact of earnings and policy triggers on FII sentiment. http://googleusercontent.com/youtube_content/0

Shadowfax Technologies Shares Gain 6% After Listing at 9% Discount
**Market Brief: Shadowfax Technologies Listing** **Listing Performance** Shadowfax Technologies shares made a **discounted debut** on the bourses today, listing at **₹113** on the BSE and **₹112.60** on the NSE. This represents a markdown of approximately **9%** against the issue price of **₹124**. Despite the weak opening, the stock witnessed immediate buying interest at lower levels, rebounding **6%** to hit an intraday high of **₹119.55**. As of the latest update, the stock continues to trade below its issue price, reflecting the cautious sentiment in the broader logistics sector. **IPO Subscription & Details** The **₹1,907 crore** public offer saw a relatively muted response, garnering a total subscription of **2.86x**. Demand was primarily driven by Qualified Institutional Buyers (QIBs), who subscribed nearly **4x**, while the Non-Institutional Investor (NII) portion remained undersubscribed at **0.88x**. **Analyst Sentiment & Outlook** Market experts advise caution, citing the discounted listing as a reflection of valuation concerns and competitive pressure from peers like Delhivery and Ecom Express. * **For Allottees:** Analysts recommend a **"Hold"** strategy with a strict stop-loss at **₹105** to protect capital. * **For Fresh Investors:** New entries are discouraged at current levels. Experts suggest waiting for price stability and a decisive breakout above the **₹120–₹124** resistance zone before committing fresh capital. **Financial & Operational Context** Shadowfax, a tech-enabled logistics player covering over **14,000** pin codes, recently signaled a financial turnaround. The company reported a net profit of **₹21.04 crore** for the first half of FY26, reversing earlier losses. The IPO proceeds are earmarked for expanding infrastructure, including new sorting centers and strengthening its hyperlocal delivery network.