Bullish News
Collection
Vietnam Raises $323.8 Million in Government Bond Auction
**VIETNAM G-BOND AUCTION: TREASURY RAISES VND 8.44 TRILLION** **Jan 28, 2026** — The State Treasury of Vietnam successfully raised **VND 8.44 trillion** ($323.8 million) in its latest government bond auction, facing a cooling market compared to the previous week's robust VND 12 trillion uptake. **Market Performance & Yields** The auction highlighted a clear preference for medium-term maturities, while demand for shorter and longer tenors evaporated. * **10-Year Bonds:** Dominated the session, accounting for the bulk of capital raised with a winning coupon of **4.04%**. * **15-Year Bonds:** Saw limited interest, with only 20% of the offering absorbed at a **4.12%** yield. * **5-Year & 30-Year:** Failed to attract buyers, recording zero sales volume. **Liquidity & Trends** Overall absorption dropped to **58%**, down from over 60% in the preceding auction. This pullback reflects a cautious sentiment in the fixed-income market as investors consolidate positions ahead of the Lunar New Year holiday season. **YTD Progress & Fiscal Context** This session brings total government bond sales for 2026 to **VND 24.4 trillion**. The State Treasury continues to lean on these issuances as the primary vehicle for funding Vietnam's critical public investment projects and sustaining economic growth targets for the year.

Sunil Subramaniam: Wait for Budget Before Big Investments
**Market Brief: January 28, 2026** **Wait-and-Watch Mode Despite Historic Trade Deal** Indian equity markets remain in a cautious holding pattern today, with the **Nifty 50** trading near **25,285** and the **Sensex** hovering around **81,800**. While the conclusion of the historic **India-EU Free Trade Agreement (FTA)** yesterday has injected positive sentiment, volatility remains elevated as investors brace for the Union Budget on February 1. **The "Mother of All Deals"** India and the European Union officially concluded negotiations on **January 27, 2026**, ending an 18-year wait. * **Scope:** The deal covers over **90% of EU goods exports** to India, eliminating tariffs on sectors like auto components, wines, and machinery. * **Impact:** Expected to double EU exports to India by **2032** and provide Indian services (IT, professionals) preferential access to European markets. * **Market Reaction:** Sentiment is buoyant, but the immediate market impact is muted as the deal is viewed as a structural, long-term positive rather than a short-term trading trigger. **Pre-Budget Jitters** The headline indices are witnessing a tug-of-war between positive global cues and pre-budget nervousness. The **Nifty** is facing stiff resistance in the **25,200–25,350** zone. * **Volatility:** The market is "range-bound" with a bias for selling on rises. * **Support Levels:** Crucial support lies at **24,900**; a breach below this could trigger a sharper correction. * **FII Flows:** Foreign Institutional Investors (FIIs) remain net sellers, while Domestic Institutional Investors (DIIs) are cushioning the falls. **Expert Strategy: "Delay Big Moves"** Market veteran **Sunil Subramaniam** advises against aggressive buying right now. Despite the trade deal euphoria, the immediate focus is the Union Budget’s fiscal math. * **Verdict:** "Hold off on major moves. The India-EU deal is a long-term booster, but the Budget will dictate the medium-term trend." * **Why wait?** Markets are pricing in a reform-oriented budget with a fiscal deficit target of **4.4%** for FY27. Any deviation or lack of populist measures for the middle class could spark a sell-off. **Sectors in Focus** Subramaniam identifies three key pockets for accumulation *after* the Budget event: **1. Banking & Finance** * **Driver:** Credit growth continues to outpace deposit growth. Asset quality remains pristine with NPA control being a major positive. * **Top Picks:** Private sector banks and select PSUs showing strong loan book expansion. **2. Information Technology (IT)** * **Driver:** The India-EU deal is a massive win for Indian IT services, promising smoother movement of professionals and service exports. * **Outlook:** Guidance remains stable despite global headwinds; valuations are becoming attractive. **3. Consumption** * **Driver:** A potential boost from Budget announcements (tax tweaks) and the upcoming summer season. * **Catalyst:** GST rationalization on consumer durables could be a surprise trigger. **Summary** The market is currently a "trader's trap" with high volatility. The smart money is waiting for the Budget speech to reassess risk-reward ratios. While the India-EU FTA is a landmark achievement, it is not enough to drive a solo rally without Budget support. **Actionable Insight:** Maintain high cash levels. Watch the **25,350** level on Nifty for a breakout, but prefer to deploy fresh capital only after February 1 clarity. ... [Sunil Subramaniam Market Outlook 2026](https://www.youtube.com/watch?v=snZVcHWf8Qk) ... This video features Sunil Subramaniam breaking down his sector-specific outlook for 2026, directly addressing the strategies mentioned in the brief. http://googleusercontent.com/youtube_content/0
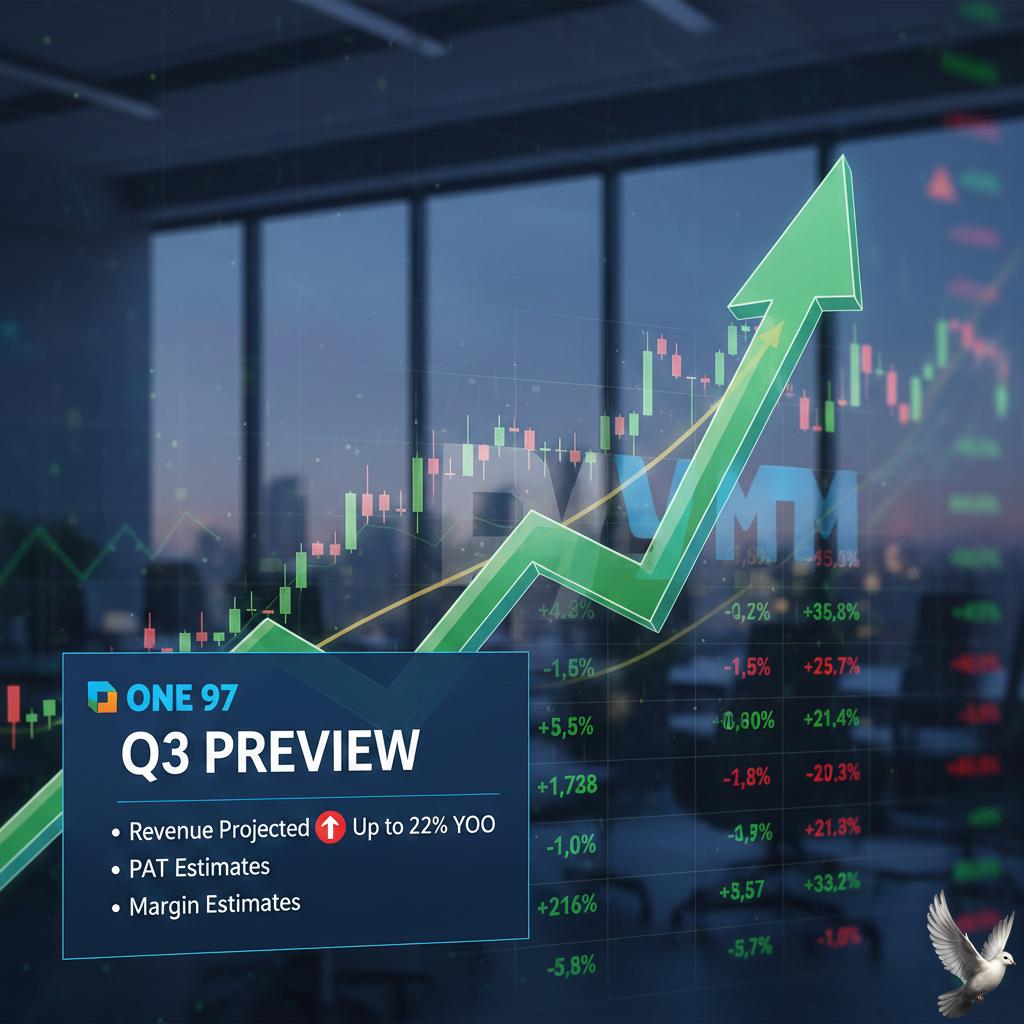
One 97 Communications Q3 Preview: Revenue Projected to Grow Up to 22% YoY, PAT and Margin Estimates
**Market Brief: Paytm (One 97 Communications) Q3 Outlook** **Date:** January 28, 2026 **Subject:** Q3 FY26 Earnings Preview & Market Context **Executive Summary** One 97 Communications is poised to report a strong **Q3 FY26**, with brokerages forecasting a sustained return to profitability. Driven by festive demand and robust merchant payments, the fintech giant is expected to maintain the turnaround momentum established earlier this fiscal year. **Financial Forecasts** Market consensus anticipates a decisive shift from loss to profit for the quarter ending December 2025. * **Revenue:** Projected to rise approximately **19–22%** year-on-year, reaching the **₹2,180–₹2,225 crore** range. Sequential growth is estimated at roughly **6%**. * **Profitability:** Analysts estimate a net profit of approximately **₹210 crore**, a sharp reversal from the massive losses recorded in the same period last year (Q3 FY25). * **Margins:** Operational efficiency continues to improve, with EBITDA margins (before ESOP) expected to expand by over **170 basis points** quarter-on-quarter. **Stock Performance & Trends** Paytm shares are currently trading near **₹1,145**, reflecting a recovery of over **45%** in the last year. However, the stock recently faced volatility, dipping nearly **10%** in late January due to concerns over the expiry of the RBI’s PIDF (Payments Infrastructure Development Fund) scheme on December 31, 2025. The discontinuation of this subsidy is a near-term headwind, though management expects revenue growth to offset the impact. **Key Drivers** * **Merchant Ecosystem:** The core payments business remains resilient, with device subscriptions (Soundbox/POS) driving steady recurring revenue. * **Financial Services:** Loan distribution is seeing a revival, aided by the festive season and stabilized partner relationships. * **Regulatory Status:** Following the major restructuring in 2025, the company has secured necessary approvals (including the Payment Aggregator license) and is operating with a cleaner regulatory slate. **Upcoming Event** The company is scheduled to release its official Q3 FY26 results on **January 29, 2026**. Markets will be watching closely to see if the actual numbers beat the optimistic street estimates.

Oil India Shares: Nearly 10% Jump, Extending Gains for Second Session
Market Brief: Oil India & Global Energy Sector **Date:** January 28, 2026 **Executive Summary** Oil India Ltd shares staged a strong rally on Wednesday, supported by a surge in derivatives open interest and a bullish breakout in the global energy market. Crude oil prices have climbed to a **four-month high**, driven by severe supply disruptions in the United States and escalating geopolitical risks in key production regions. **Global Crude Oil Dynamics** International benchmarks have recorded significant gains, with Brent crude trading above **$67 per barrel** and West Texas Intermediate (WTI) holding near **$62 per barrel**. * **Supply Shock:** A severe winter storm in the US has forced a production cut of approximately **2 million barrels per day** (roughly **15%** of national output), tightening immediate global inventory levels. * **Geopolitical Risk:** Market sentiment remains fragile due to renewed tensions. Traders are monitoring a reported US military buildup in the Middle East amidst friction with Iran. simultaneously, the Russia-Ukraine conflict continues to sustain a risk premium on prices despite intermittent diplomatic discussions. **Oil India Stock Performance & Outlook** Domestic market sentiment for Oil India remains positive, correlating with the rise in underlying commodity prices. * **Technical Setup:** Analysts have flagged a "buy" signal for the stock, citing strong consolidation and a favorable risk-reward ratio. The technical structure suggests potential upside, with some price targets projected around **₹480** in the near term, provided key support levels hold. * **Market Activity:** The stock has witnessed a sharp increase in Open Interest (OI) in the futures and options segment, indicating aggressive long positioning by institutional and retail traders. **Sector Implications** The confluence of the US production freeze and geopolitical instability has created a short-term floor for energy prices. While broader 2026 forecasts from agencies like the EIA still predict a surplus later in the year, the immediate supply tightness is driving capital flows into upstream oil explorers like Oil India.
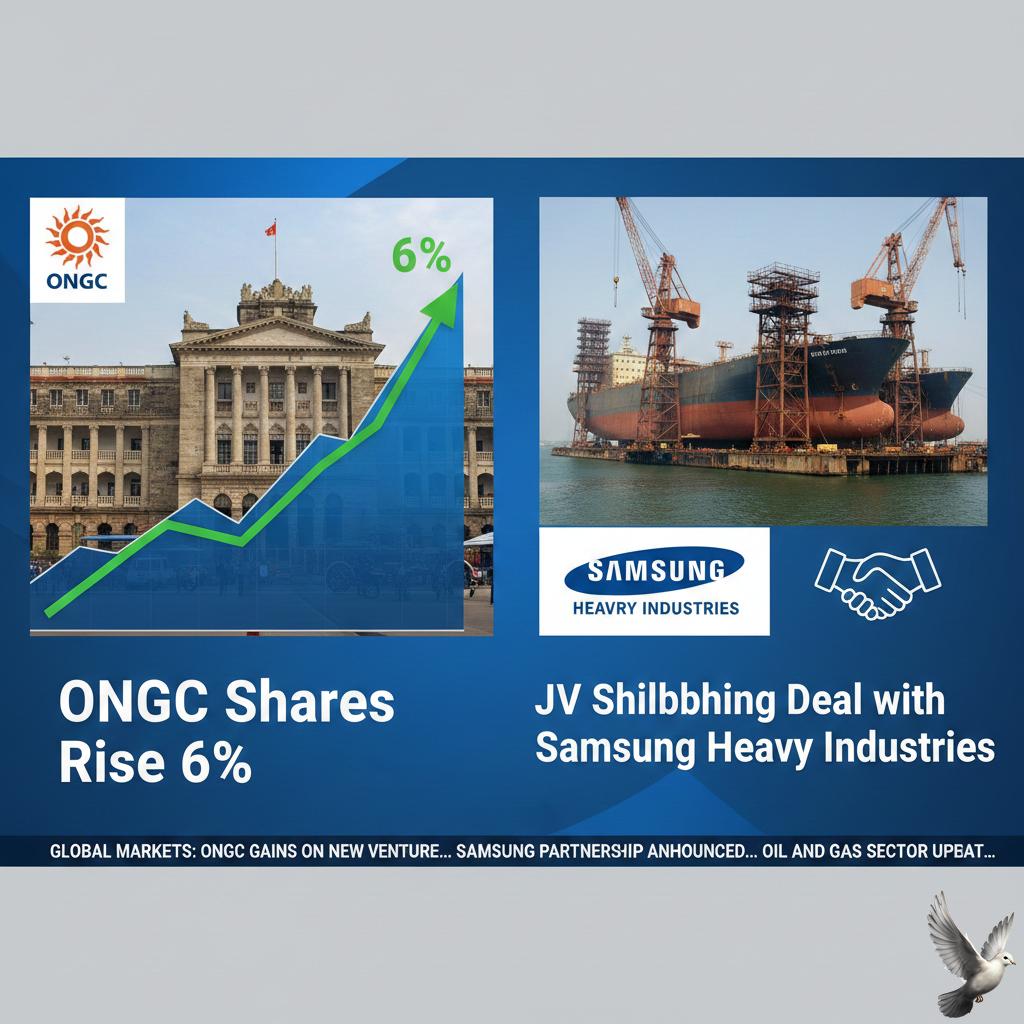
ONGC Shares Rise 6% on JV Shipbuilding Deal with Samsung Heavy Industries
**ONGC Hits Fresh 52-Week High on Strategic Fleet Expansion** **Market Action & Price Surge** Shares of Oil and Natural Gas Corporation (ONGC) witnessed a sharp rally, surging over **6%** to **7.3%** intraday on January 28, 2026. The stock hit a fresh 52-week high of **₹266.20**, breaking past previous resistance levels with significant volume expansion. This bullish momentum propelled the state-owned energy giant’s market capitalization to approximately **₹3.33 trillion**. The buying frenzy was triggered by the company’s decisive move to secure its energy supply chain through a major shipbuilding agreement, reinforcing investor confidence in its long-term strategic roadmap. **Strategic Deal Structure** The core catalyst is a trilateral agreement involving ONGC, Japanese shipping major Mitsui O.S.K. Lines (MOL), and South Korean shipbuilder Samsung Heavy Industries. ONGC’s joint ventures with MOL—**Bharat Ethane One IFSC Pvt Ltd** and **Bharat Ethane Two IFSC Pvt Ltd**—have signed contracts with Samsung Heavy Industries to construct two Very Large Ethane Carriers (VLECs). These entities are incorporated in **GIFT City**, Gujarat, aligning with India’s push to onshore international financial services and maritime operations. **Operational Impact & Logistics** Each of the new VLECs will feature a cargo capacity of **100,000 cubic meters**. Scheduled for delivery in **FY 2028–29**, these vessels are purpose-built to create a dedicated energy corridor between the USA and India. The primary beneficiary of this logistics upgrade is ONGC Petro additions Limited (OPaL). The carriers will transport approximately **600,000 tonnes per annum (KTPA)** of ethane from the US to India. By controlling the fleet, ONGC mitigates exposure to volatile freight rates and ensures a consistent feedstock supply for its downstream petrochemical units, a critical factor for maintaining margins in the competitive petrochemical sector. **Technical & Valuation Indicators** Market participants have reacted positively not just to the news, but to the favorable technical setup it confirmed. * **Moving Averages:** The stock is now trading comfortably above all key Simple Moving Averages (SMAs), including the **50-day**, **100-day**, and **200-day** lines, signaling a robust long-term uptrend. * **Momentum:** The Relative Strength Index (RSI) is hovering around **59.7**, indicating strong bullish momentum without being deeply overbought (which typically occurs above 70). * **Valuation:** Despite the surge, ONGC remains attractive from a value investing perspective. It trades at a Price-to-Earnings (P/E) ratio of approximately **8.5x to 9.0x**, significantly lower than many industry peers. The Price-to-Book ratio sits at **0.83**, suggesting the stock is still trading below its book value. **Broader Economic Implications** This development is viewed as a significant step toward energy self-reliance ("Atmanirbhar Bharat"). By flagging these vessels in India and managing them through domestic JVs, ONGC is fostering local maritime capabilities while securing critical raw materials. Analysts note that this backward integration into logistics reduces operational risks for OPaL and improves the consolidated entity's resilience against global supply chain disruptions. **Investor Outlook** The convergence of a breakout technical chart, a low valuation multiple, and a clear long-term infrastructure investment has generated a "Buy" sentiment among many tracking the sector. The substantial delivery volume accompanying the price rise suggests institutional accumulation, positioning the stock for potential further upside as the company executes its petrochemical expansion strategy.
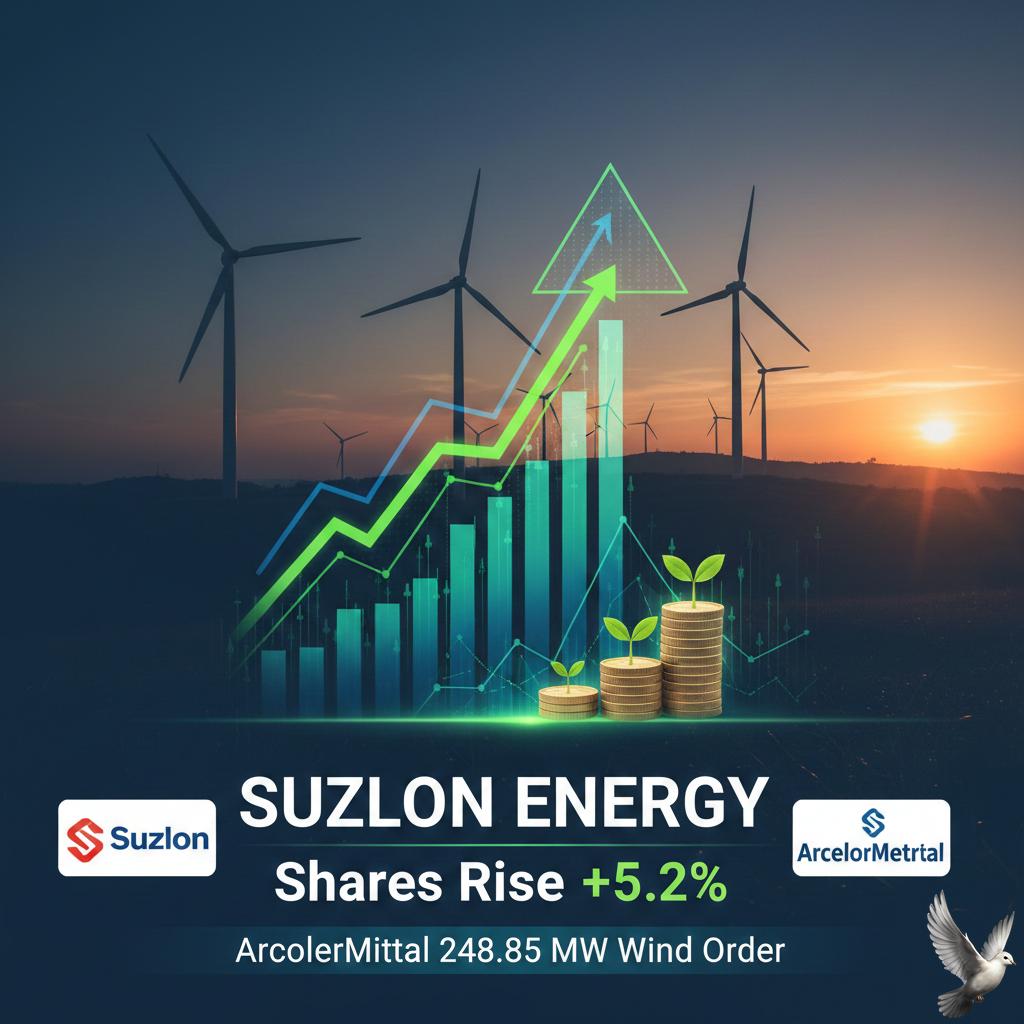
Suzlon Energy Shares Rise on 248.85 MW Wind Order from ArcelorMittal
**MARKET UPDATE: SUZLON ENERGY** **Price Action & Sentiment** **Suzlon Energy** shares surged over **3%** in today’s session, trading near **₹47.15** (up from a close of ₹45.70), following a major order win. The stock has broken a recent consolidation phase, reacting positively to its first-ever partnership with steel giant **ArcelorMittal**. **Order Book & Strategic Wins** The company secured a **248.85 MW** wind power order from ArcelorMittal’s renewable energy arm. This deal is part of a larger **550 MW** hybrid project in **Bachau, Gujarat**. * **Equipment:** Supply of **79** S144 wind turbine generators, each with a rated capacity of **3.15 MW**. * **Green Steel Push:** This marks Suzlon’s **4th** major order targeting the decarbonization of steel production, bringing its total "green steel" portfolio to approximately **1,156 MW**. **Regional Dominance** The project reinforces Suzlon’s leadership in Gujarat, where its installation base has now crossed **4.5 GW**. The power generated will be used for captive consumption by **ArcelorMittal Nippon Steel** facilities, highlighting the growing trend of heavy industries shifting to renewable captive power. **Financial Outlook** While the stock remains below its 52-week high of **₹74.30**, analysts note that fresh order inflows from top-tier clients like ArcelorMittal improve revenue visibility for FY27. Market participants are now awaiting Q3 FY26 results to gauge execution speed and margin expansion. *** ... [Suzlon Q3 Results: Profit Soars 90% (Previous Year Context)](https://www.youtube.com/watch?v=b-9KMPESbLo) ... This video offers historical context on Suzlon's financial turnaround and margin expansion trajectory, which set the foundation for securing major commercial orders like the one announced today. http://googleusercontent.com/youtube_content/0
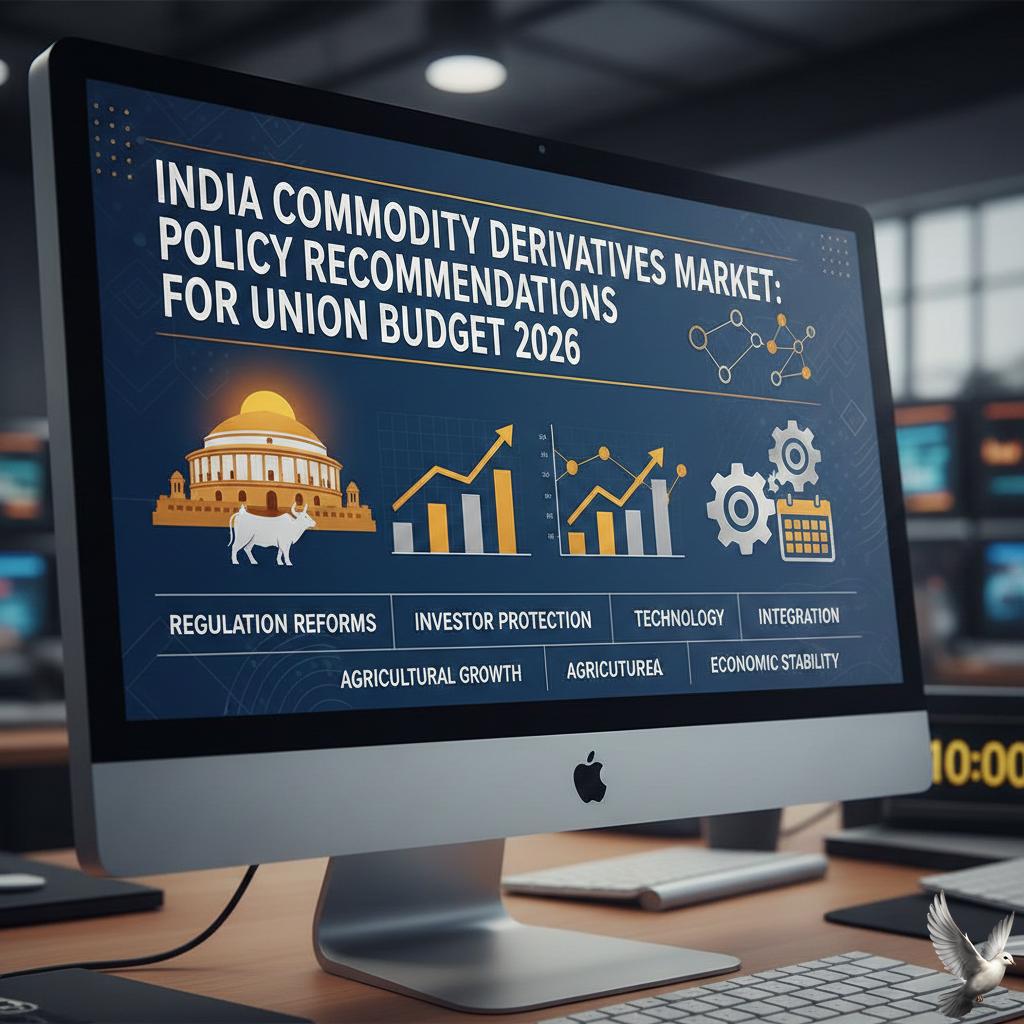
India Commodity Derivatives Market Policy Recommendations for Union Budget 2026
**INDIA COMMODITY MARKET BRIEF | JANUARY 28, 2026** **Market Pulse: Historic Highs & Budget Countdown** India’s commodity derivatives market is witnessing a historic bull run ahead of the Union Budget 2026-27. Geopolitical tensions and safe-haven demand have pushed bullion to record levels, while the street awaits critical fiscal reforms to unlock the next phase of liquidity and institutional participation. **Bullion: Unprecedented Surge** Gold and silver are trading at lifetime highs on the MCX as of January 27–28, 2026. * **Gold:** Futures breached **₹1,58,559 per 10g**, tracking global prices above **$5,100/oz**. * **Silver:** Witnessed a massive breakout, trading near **₹3,54,530 per kg**, driven by a 6% global surge to **$117/oz**. * **Drivers:** Escalating trade tensions (US-EU tariffs) and the "Greenland spark" have triggered aggressive safe-haven buying. **Budget 2026: The Reform Agenda** The upcoming Budget is critical for transforming India into a global risk-management hub. Market participants are eyeing three specific reforms: 1. **CTT Rationalization:** High Commodities Transaction Tax (CTT) remains a friction point. A reduction is essential to lower impact costs for hedgers and align domestic costs with global peers. 2. **Tax Clarity:** Resolution on GST ambiguities for brokerage and derivatives is sought to ease compliance for FPOs and value-chain participants. 3. **Institutional Access:** Expectations are high for policy signals that facilitate deeper participation from banks and mutual funds in non-agri derivatives. **Regulatory & Sector Trends** * **Agri-Derivatives:** A SEBI panel is reportedly considering the removal of trading bans on key commodities like **wheat and paddy**, potentially reviving the agri-futures segment. * **NCDEX Action:** **Jeera** and **Guar** complexes remain active, though **Turmeric** futures saw a **2% correction** recently due to profit booking. * **Volume Growth:** The NSE commodity options segment is showing robust traction, with turnover projections for FY26 indicating strong year-on-year growth. **Outlook** With the Gold/Silver ratio compressing to **~50**, silver is structurally outperforming gold. If Budget 2026 delivers on CTT cuts and physical-derivative market integration, domestic volumes could see a structural shift, bridging the gap between physical hedging needs and financial liquidity.

Bitcoin Trades Near $89,000 as Ethereum Approaches $3,000
The digital asset market remains anchored in a consolidation phase, exhibiting cautious optimism as the two largest cryptocurrencies attempt to breach significant psychological barriers. **Bitcoin (BTC)** is currently holding position near the **$89,000** mark. This reflects a period of subdued volatility as traders await a definitive signal to commit capital. Similarly, **Ethereum (ETH)** is approaching the **$3,000** threshold. Recent data shows ETH trading around **$2,997**, having bounced effectively from its key support zone near **$2,800**. Over the last **24 hours**, price action has been modest. Ethereum posted a rise of approximately **1.97%**, slightly outpacing Bitcoin’s advance of around **0.40%**. This gentle ascent confirms that buyers have re-entered the market, defending critical levels established earlier in the week. The overall cryptocurrency market capitalization stands at roughly **$3.01 trillion**. Despite this substantial figure, market participants are hesitant to push valuations significantly higher, resulting in defined trading ranges. The dominant theme is **macro caution**. The sector’s immediate direction is inextricably tied to the outcome of the Federal Reserve’s upcoming policy meeting. While a decision to keep interest rates steady is widely anticipated, the market is primarily focused on the tone and guidance delivered by the Fed Chair. Any indication of when the central bank might resume rate cuts—or a significant shift in its inflation outlook—will serve as the pivotal **macro trigger** needed to break current consolidation patterns. Until then, major assets are expected to tread water. This environment has led to a notable **divergence** in capital flows. Speculative interest has largely rotated out of digital tokens and into traditional, tangible assets. Commodities are currently stealing the spotlight, benefiting from geopolitical tensions and supply chain disruptions. In sharp contrast to crypto’s range-bound moves, **natural gas** has surged an eye-watering **87.58%** month-to-date. Traditional safe-haven assets are also seeing explosive returns. **Silver** has gained an exceptional **60.38%**, and **gold** is up almost **20%** since the start of the month. This suggests that money currently favors established stores of value over the high-beta risk profile of digital assets. Institutional engagement also points to ongoing sobriety. After a recent stretch of net inflows into US spot Bitcoin Exchange-Traded Funds (ETFs), those products have recently faced net outflows. This suggests institutional allocators are taking a temporary **"wait-and-watch"** approach, pausing exposure rather than aggressively increasing it. While some major altcoins have seen notable pumps—with certain smaller tokens posting gains up to **28%**—these moves are isolated and have not translated into sustained momentum for BTC or ETH. Bitcoin continues to be viewed as a proxy for **risk appetite**, while Ethereum is treated as a leveraged bet on digital activity and innovation. Both assets remain structurally sound, with strong long-term conviction underpinning network usage. However, their short-term fate is now firmly embedded within the global risk spectrum, dictated by central bank liquidity and shifting investor sentiment. Sustained recovery will depend heavily on macro easing and an eventual rotation of institutional capital back into risk-on assets. Until then, **$89,000** and **$3,000** will remain key battlegrounds for the leading digital currencies.
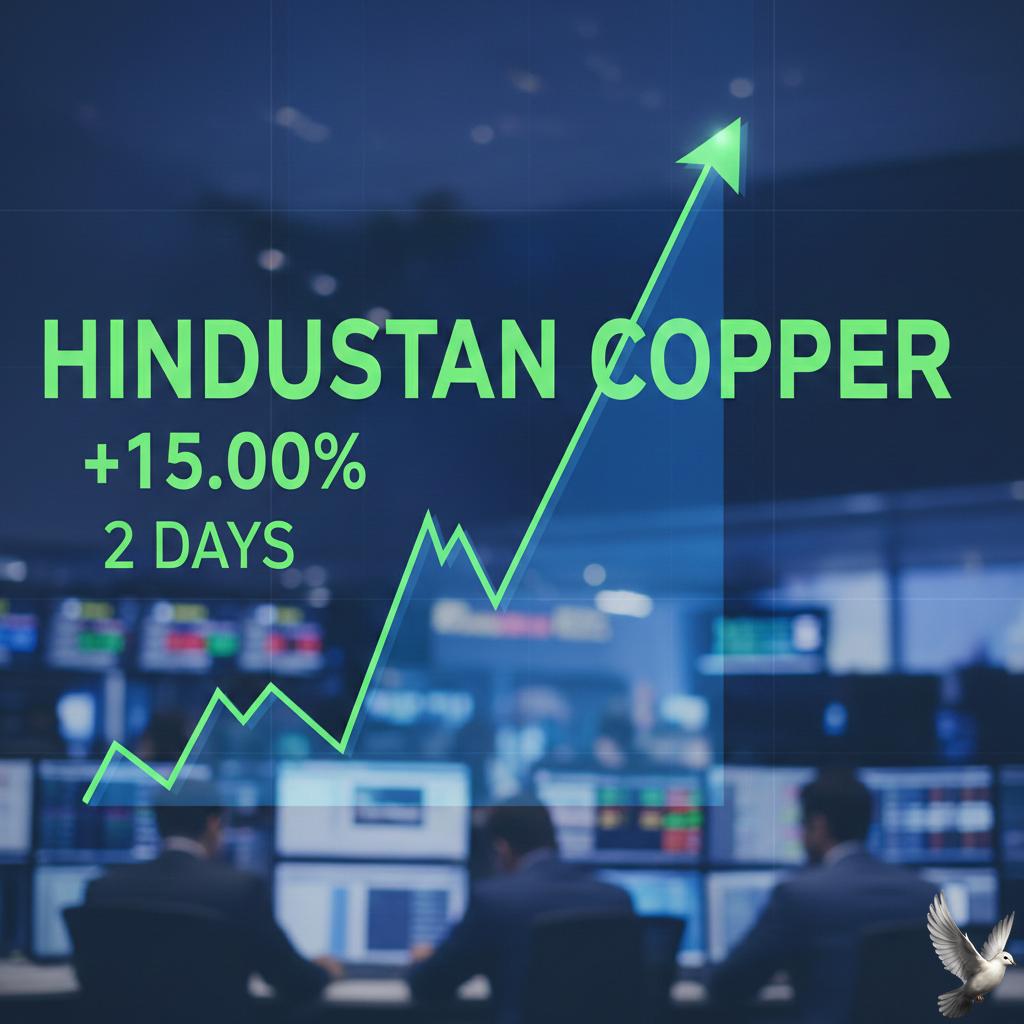
Hindustan Copper Shares Rise 15% in Two Days
**Market Brief: Hindustan Copper Rally** **Price Action & Volatility** Hindustan Copper shares have witnessed a sharp vertical move, surging approximately **15%** over the last two trading sessions. As of **January 28, 2026**, the stock spiked nearly **8.7%** intraday, hitting a fresh **52-week high** of **₹615**. The counter is witnessing heavy volumes, significantly outperforming the broader **BSE Metal Index** and showing strong accumulation patterns. **Primary Catalyst: Strategic Acquisition** The buying frenzy is driven by the state-owned miner emerging as the **preferred bidder** for the **Baghwari-Khirkhori copper block** in Madhya Pradesh. This development—confirmed via exchange filings on January 25—marks a critical expansion for India's only vertically integrated copper producer. The new block aligns with the company's long-term strategy to secure domestic raw material reserves and reduce import dependency. **Global Macro Tailwinds** Domestic sentiment is further amplified by a historic rally in global non-ferrous metals. LME Copper prices have breached psychological resistance, trading above **$13,000 per tonne** in January 2026. Record-high global prices are bolstering valuations for copper miners, with analysts pricing in sustained demand from green energy transitions and AI-infrastructure build-outs. **Technical Setup** The stock is currently trading well above all key moving averages (**5, 20, 50, 100, and 200-DMA**), signaling a decisive bullish breakout. Momentum indicators suggest strong institutional interest, with delivery volumes rising sharply. The breakout above the **₹590-600** zone has opened room for further upside discovery, supported by the dual engines of capacity expansion news and favorable global commodity cycles. *** ... [JPMorgan metals price outlook for Q1 2026](https://www.youtube.com/watch?v=eX_41BvTvhc) This video provides relevant context on the global metals rally and price forecasts that are currently driving sentiment in copper stocks like Hindustan Copper. http://googleusercontent.com/youtube_content/0
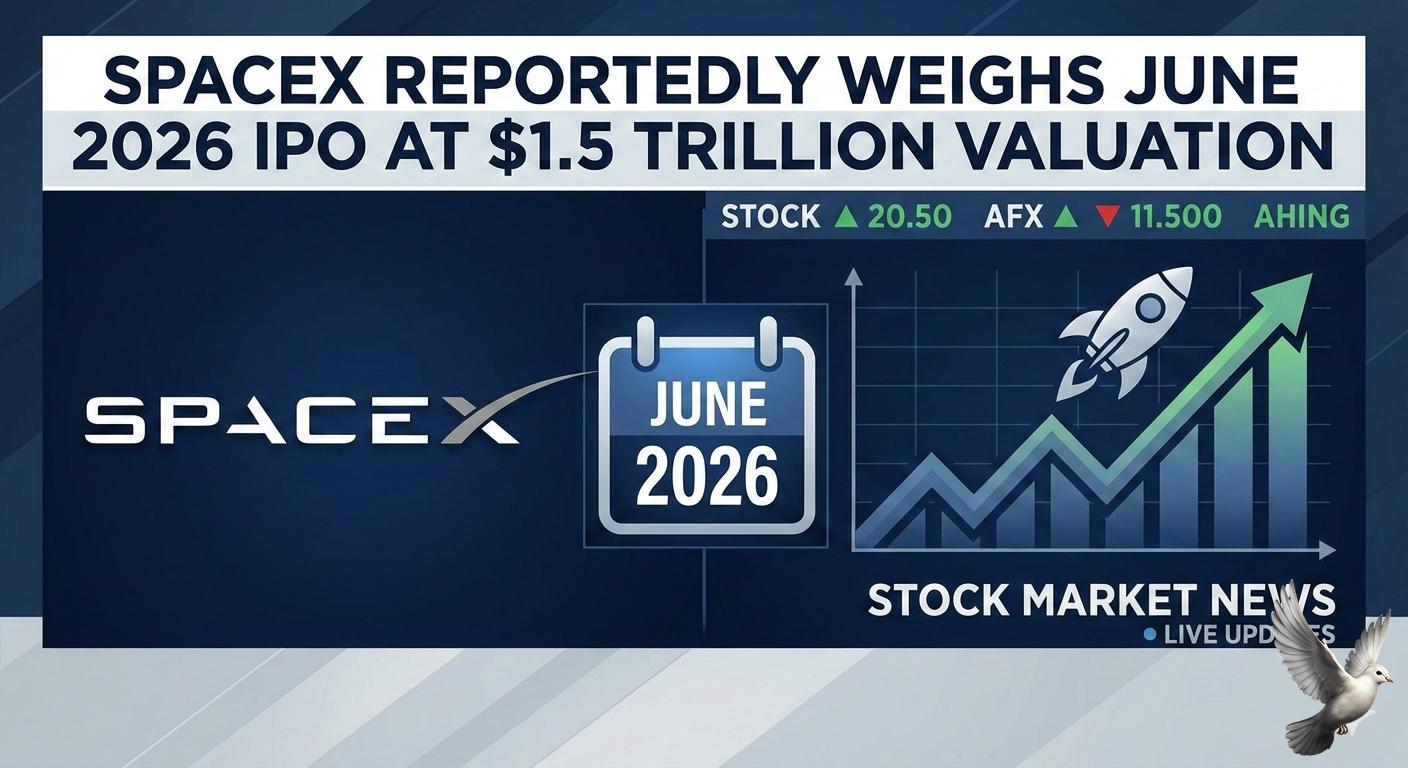
SpaceX Reportedly Weighs June 2026 IPO at $1.5 Trillion Valuation
**SpaceX Eyes Historic $1.5 Trillion Valuation in Potential mid-2026 IPO** **Market Alert | January 28, 2026** **Key Development** SpaceX is reportedly weighing a mid-June 2026 initial public offering (IPO), targeting a record-breaking $1.5 trillion valuation. Preliminary discussions suggest the aerospace giant could raise up to $50 billion, potentially surpassing Saudi Aramco’s 2019 debut as the largest IPO in history. **Financial Context** This valuation target represents a massive leap from recent private market figures. As of late 2025 and early 2026, private share sales had valued the company near $800 billion. The proposed $1.5 trillion figure would position SpaceX among the world's most valuable publicly traded entities immediately upon listing. **Strategic Partners** Talks are reportedly underway with major financial institutions to manage the listing. Bank of America, JPMorgan, Goldman Sachs, and Morgan Stanley have been named as potential lead underwriters for the deal. **Market Reaction & Sector Impact** The news has triggered immediate movement in the aerospace sector. Rocket Lab (RKLB), often viewed as a key sympathy play, surged over 8% in today's trading, reaching approximately $87 per share. Broader markets are also showing resilience today, with the S&P 500 trading near 6,978 (+0.4%) and the Nasdaq Composite pushing to 23,817 (+0.9%), signaling a favorable environment for high-growth tech listings. **Implications** A listing of this magnitude could revitalize the global IPO market, which has seen heightened activity in 2026. Investors are closely monitoring whether this move will unlock further liquidity for the broader space economy and encourage other "hectocorn" (startups valued over $100 billion) listings later this year.
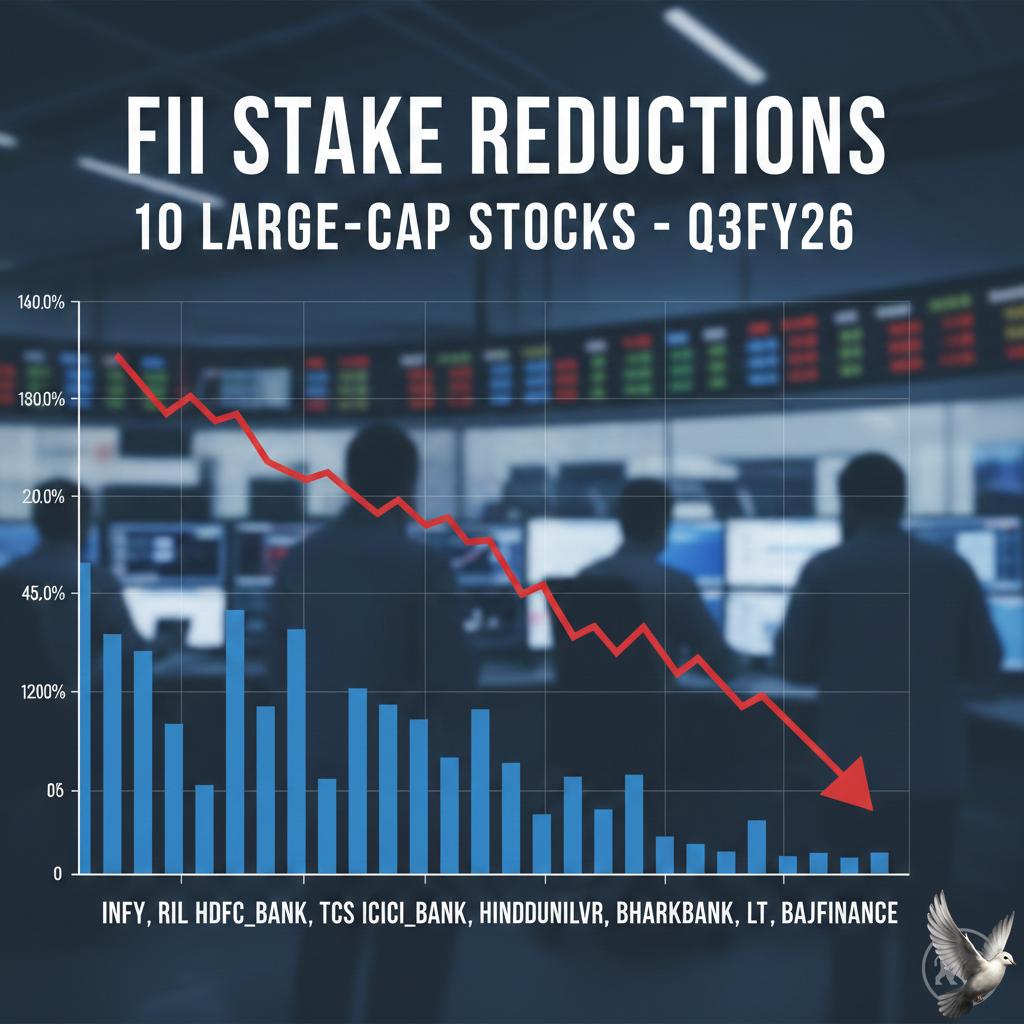
FII Stake Reductions in 10 Large-Cap Stocks in Q3FY26
💰 Global Market Brief: January 27, 2026 The global financial narrative is currently defined by a divergence between resilient economic growth, particularly in Emerging Markets (EM), and cautious, selective trading in Developed Market (DM) equities, all against the backdrop of an ongoing **AI investment supercycle**. 📈 Equity Market Performance and Sectoral Shifts Indian benchmark indices showed a mixed yet cautious picture on January 27, 2026. The Nifty 50 opened near **25,063** and managed to hold in positive territory, indicating underlying stability. Conversely, the Bank Nifty slipped, reflecting persistent pressure and caution around banking stocks, which closed at **58,473.10** on Friday. Sector rotation is a key theme. Technology, or Nifty IT, has shown significant relative strength, acting as a stabilizer for the broader market. This uplift is attributed to expectations of steady global tech spending and mildly favorable rupee weakness. In contrast, the financial sector is grappling with margin pressure and sensitivity to interest rate expectations. On Friday, January 23, the Sensex had closed sharply lower at **81,537.70**, down **0.94%**, with the Nifty 50 settling at **25,048.65**, down **0.95%**. Monday's trading, however, saw a recovery, with the Sensex advancing **0.39%** to **81,857.48** and the Nifty rising **0.51%** to settle at **25,175.40**, driven by strength in banking, metal, and infrastructure stocks. Key stock movements for January 27 saw Adani Enterprises surge nearly **5.3%**, with Axis Bank gaining over **5%** following strong quarterly earnings. Major losers included Mahindra & Mahindra, which fell over **4.25%**, and Asian Paints, down **2.8%**. 🌍 Global Economic and Policy Environment The global economic outlook for **2026** is viewed as resilient, with the IMF projecting global growth at **3.3%**. This stability is supported by fiscal stimulus, accommodative financial conditions, and a massive wave of technology investment. India's economic fundamentals remain robust. Real GDP growth was an impressive **8.2%** in Q2 of FY 2025-26. The country has solidified its position as the world's fourth-largest economy, surpassing Japan in **2025**. Inflation remains a central focus. While global inflation is expected to moderate, it is predicted to remain "sticky," hovering around **3%** in some DM jurisdictions. In India, CPI inflation progressively softened to **0.71%** in November 2025 from **4.26%** at the start of the year, providing a favorable backdrop for consumption. Money markets in India remain liquid, with the weighted average overnight rate recorded at **5.15%** on January 23, 2026. Domestic institutional investors continue to provide support to the equity markets, offsetting cautious flows from foreign institutional investors. 💡 Key Market Drivers and Trends The relentless expansion of **Artificial Intelligence (AI)** is the single most important thematic driver. The AI supercycle is fueling record capital expenditures, with estimates suggesting **\$5 trillion to \$8 trillion** could be required over the next five years for AI infrastructure alone. This investment is prioritizing CapEx over M\&A in the short term, but is expected to accelerate dealmaking over the medium term. Global equity research forecasts double-digit gains for both Developed and Emerging Markets in **2026**, primarily driven by robust earnings growth and the sustained AI theme. While this trend is broadly positive, it is also amplifying market polarization, concentrating gains in a small number of markets and sectors. For traders, the current environment necessitates stock-specific strategies due to persistent intraday volatility and a lack of broad directional signals. Investment is focused on sectors showing relative strength, such as Technology and select Consumption stocks, while the cautious sentiment around financials requires careful positioning.

Nikkei Advances on Yen Weakness, Chip Stock Gains
**Market Brief: Nikkei Snaps Losing Streak on Tech Rally** **Tuesday, January 27, 2026** Japan’s stock market staged a robust recovery on Tuesday, with the Nikkei 225 share average ending significantly higher to break a two-day losing streak. Risk sentiment improved as the yen’s recent rapid appreciation paused, giving exporters and technology heavyweights room to rebound. **Key Figures** The benchmark Nikkei 225 Index closed up **448.29** points (**+0.85%**) at **53,333.54**. The broader Topix Index also advanced, rising **0.31%** to finish at **3,564.00**. **Tech & AI Surge** Technology stocks drove the day's gains, fueled by renewed optimism surrounding artificial intelligence demand. Semiconductor-related shares outperformed the broader market: * **Advantest** surged roughly **5.9%** * **Kioxia Holdings** gained **5.7%** * **Disco Corp** rose **3.7%** * **Tokyo Electron** climbed **2.5%** **Currency Stabilization** The yen stabilized against the dollar, trading in the **153.20–154.30** range during the session. This calm followed a sharp **3%** rally in the previous two sessions sparked by fears of coordinated currency intervention between Tokyo and Washington. The pause in the yen’s climb provided a reprieve for Japan’s export-heavy index. **Sector Laggards** Despite the broader rally, select exporters and financials faced pressure. **Fujitsu** slumped over **7.8%**, while **Toyota Motor** slipped **0.5%** and **Sony Group** declined **1.6%**, limiting the market's overall upside. **Market Context** Investors remain cautious but optimistic, shifting focus to the upcoming lower house snap election. While political uncertainty looms, the immediate stabilized currency backdrop has allowed the "buy-the-dip" momentum in high-value tech stocks to resume.

L&T Q3 Results Preview: Analyst Expectations for Profit and Revenue Growth
Larsen & Toubro: Market Brief and Q3 FY26 Outlook The market is keenly focused on Larsen & Toubro's forthcoming financial update, with the company scheduled to announce its December quarter results (Q3 FY26) on **January 28, 2026**. Brokerage consensus points to another period of powerful execution and robust profit expansion, driven by operational leverage across its extensive Engineering, Procurement, and Construction (EPC) portfolio. Projections indicate that consolidated **Profit After Tax (PAT)** is set for a substantial surge, with forecasts ranging from **33%** to potentially as high as **64%** year-on-year growth. The anticipated net profit figure is estimated between **₹4,346 crore** and **₹4,548 crore**. Revenues for the quarter are expected to see strong double-digit growth, climbing around **15% to 16%** to reach the **₹74,500 crore** to **₹75,100 crore** mark. This momentum reflects successful conversion of the substantial existing project backlog. Operational efficiency is set to shine. **EBITDA** is forecasted to increase by over **20%**, pushing the consolidated margin to approximately **10.3%**. Improving margins, a key theme for the quarter, are being realized through disciplined project management and favorable segment mix, primarily within infrastructure and hydrocarbons. On the capital markets front, L&T stock recently traded around **₹3,755** per share, giving the conglomerate a market capitalization exceeding **₹5.17 lakh crore**. The stock achieved its 52-week high of **₹4,195** earlier in January 2026. While the stock has seen a short-term pullback of around **7%** over the last month, its long-term trajectory remains exceptionally strong, delivering returns of over **181%** in the past five years. The foundational strength of the company lies in its record order book. The consolidated order backlog is currently reported at a staggering **₹5.79 lakh crore**, providing exceptional revenue visibility for the coming years. Order inflows continue to be vigorous. In recent weeks, the company secured a significant order for its Heavy Civil Infrastructure business involving the construction of India’s largest pumped storage project—the **3000 MW Saidongar-1 PSP** in Maharashtra. The Hydrocarbon Onshore Business also bagged a **"Large"** category order in January, reaffirming core segment performance. The primary point of investor caution revolves around international projects. While the total order pipeline is massive, there are recent concerns surrounding the potential cancellation of certain oil and gas tenders in the **Middle East**, particularly in Kuwait, which could involve contracts valued up to **$4.5 billion** where L&T was the lowest bidder. Despite these emerging geopolitical risks, the domestic market tailwinds and the government's continued thrust on infrastructure development ensure L&T remains a primary beneficiary of India's capital expenditure cycle. The focus moving forward will be on management commentary regarding sustained international order wins and disciplined margin performance in the core Engineering & Construction segments.
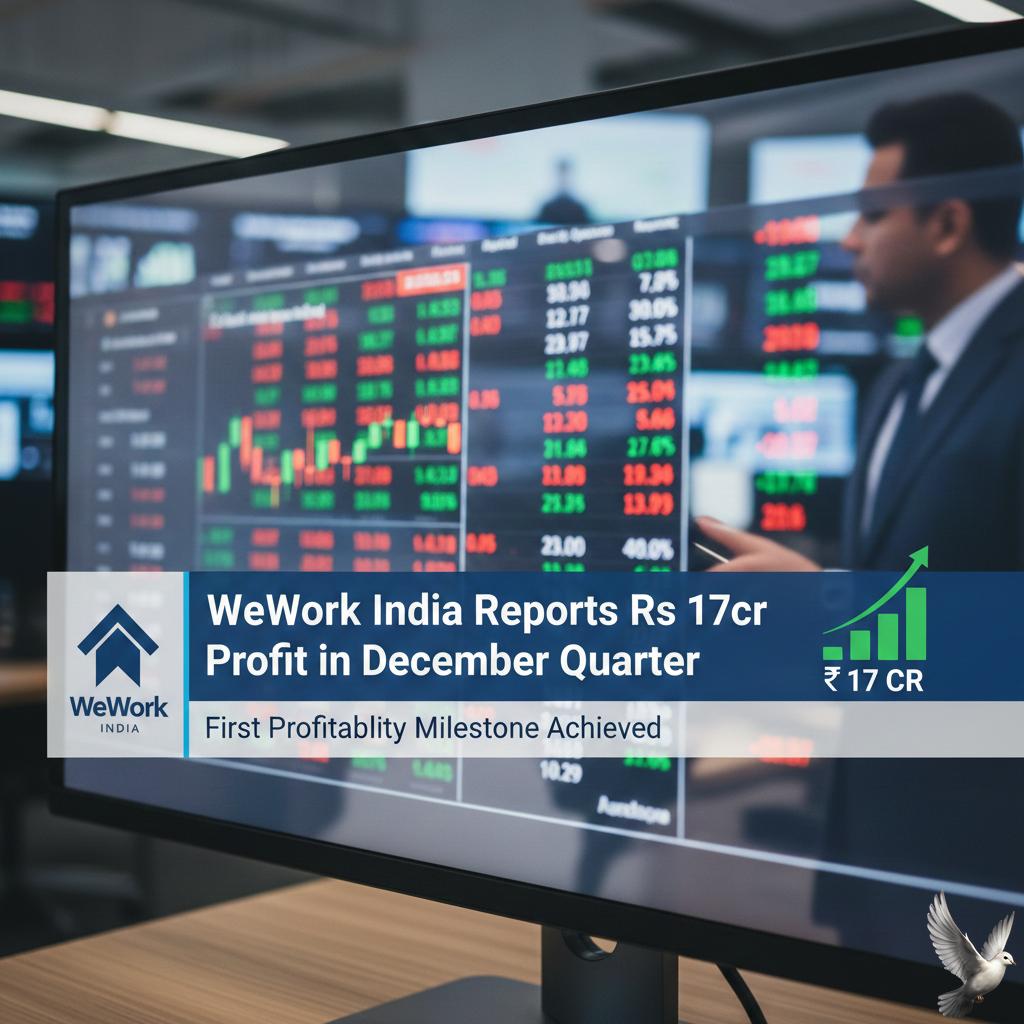
WeWork India Reports Rs 17cr Profit in December Quarter
Realty firm WeWork India has delivered a robust financial turnaround, reporting a consolidated net profit of **₹16.78 crore** in the third quarter of the current fiscal year. This marked a significant recovery compared to the same quarter last year, when the company recorded a substantial net loss of **₹83.11 crore**. The quarter ending December 2025 (Q3 FY26) saw total income surge to **₹643.81 crore**, demonstrating powerful underlying revenue growth. This performance underscores management's successful pivot toward profitable operations and unit economics. Total revenue from operations grew by approximately **29%** year-on-year, driven by increasing demand from large institutional clients and improved utilization across the company’s expansive portfolio. This focus on operational efficiency pushed the Adjusted EBITDA up to **₹134.6 crore**, representing strong growth of nearly **48%** year-on-year. Consequently, EBITDA margins expanded considerably to a healthy **21%** for the period. The full-year performance for the preceding fiscal year (FY25) already established a foundation for sustained profitability, with the company posting a net profit of **₹128.18 crore** on annual revenues exceeding **₹2,024 crore**. Operationally, WeWork India continues to dominate the premium segment of the flexible workspace market. The company operates a network of **73 centers** spanning **8.2 million square feet** across eight major Indian cities, including Mumbai, Bengaluru, and the National Capital Region. A critical success factor is the deep reliance on enterprise customers. Large corporate clients now account for a substantial **74%** of the company’s total revenue, ensuring stable, long-term revenue visibility. Portfolio occupancy rates are strong, averaging approximately **84%**, with mature centers achieving an even higher utilization rate of around **87%**. The company’s expansion strategy remains aggressive yet disciplined. During Q3 alone, WeWork India added approximately **12,000** new desks through sales. Looking ahead, the company has an ambitious supply pipeline, with plans to add between **25,000** and **30,000** new seats in the upcoming fiscal year (FY27). Financially, the balance sheet has significantly strengthened. Free Cash Flow from Operations rose sharply to over **₹200 crore** in the quarter, providing ample internal capital for future growth expenditures. Management is targeting a major financial milestone: achieving **zero net debt** by the end of the current fiscal year (FY26). This reflects a prudent approach to capital deployment and high returns on assets. The company's improving financial health was recently validated by a credit rating upgrade from ICRA to **[ICRA] A (Stable)**. The broader Indian flexible workspace sector is experiencing explosive growth, buoyed by the widespread adoption of hybrid work models and escalating demand from startups and Global Capability Centers (GCCs). The market is projected to surpass **100 million square feet** by the year **2026**. WeWork India is strategically positioned to capture this market expansion, leveraging its scale, premium brand, and focus on profitable growth rather than mere portfolio size. The recent listing on Indian stock exchanges also provides enhanced market visibility and liquidity, solidifying its position as a key leader in India's commercial real estate transformation.

Asian Paints Q3 Results: Consolidated Profit Declines, Revenue Rises
The paint sector giant reported its third quarter results for the 2025-26 fiscal year, revealing a mixed financial picture defined by underlying operational resilience offset by significant one-time expenses. Consolidated net profit for the quarter ending December 2025 fell to **₹1,060 crore**. This represented a year-on-year decline of approximately **4.5%** compared to the ₹1,110 crore recorded in the corresponding period last year. However, revenue from operations showed positive movement, increasing by **3.7%** year-on-year to reach **₹8,867 crore**. The company delivered growth on its top line despite facing subdued demand conditions in the broader market, particularly within the competitive decorative segment. The key driver behind the dip in reported net profit was a substantial exceptional charge. The company booked costs of approximately **₹158 crore** during the quarter. This included expenses related to new Labor Code provisions, specifically an increased gratuity liability, along with an impairment loss booked against intangible assets recognized during the acquisition of Obgenix Software Private Limited, known as White Teak. Excluding these one-time exceptional items, the company’s underlying profitability and operating efficiency showed distinct improvement. Profit before depreciation, interest, tax, other income, and exceptional items, or PBDIT, registered a healthy growth of **8.8%**, climbing to **₹1,781 crore**. This operational discipline was reflected in margin expansion. The PBDIT margin as a percentage of net sales improved by almost **100 basis points**, expanding to **20.1%** for the quarter, up from 19.2% a year ago. This margin recovery signals successful cost management and the beneficial impact of tailwinds from softening raw material costs. Volume growth remained robust in the core business. The India Decorative business delivered solid volume growth of **7.9%** during the quarter, demonstrating sustained demand capture through a wide distribution network and intensified brand-building initiatives. Segment performance across the portfolio was varied. The International business segment provided strong growth, with sales increasing by **6.3%** year-on-year to approximately **₹870 crore**, led by key markets in Sri Lanka, the UAE, and Ethiopia. Meanwhile, the industrial coatings segments also registered double-digit growth. The recently diversified Home Décor segment exhibited contrasting results. The Kitchen business saw a moderate sales increase of **2.6%**, while the Bath Fittings vertical witnessed a decline in net sales of **4.1%** for the period. Market context is critical to interpreting these results. The Indian paint sector is currently navigating an intense competitive phase, often referred to as the "Paint War." The entry of major conglomerates, particularly the aggressive expansion by Birla Opus, has reshaped the landscape, forcing incumbents to increase brand investments and defend market share. The company retains its dominant position, though its market share has reportedly settled closer to **50%** amidst the surging competition. This competitive intensity is expected to persist, keeping volume growth a primary focus, even if it pressures near-term pricing. The overall Indian paints and coatings market, however, remains poised for significant expansion, forecasted to grow at a Compound Annual Growth Rate of approximately **9.38%** through 2030, driven by infrastructure development and rising disposable incomes. Following the announcement, the company’s stock reacted negatively to the reported profit decline, falling by as much as **5%** in intraday trade before closing approximately **2.8%** lower, reflecting investor caution regarding the exceptional charges and sustained competitive headwinds. The company’s market capitalization remains over **₹2.5 lakh crore**, confirming its continued status as the market leader.

Global Risks Drive 'Stock Picker' Mode in Markets: Anand Shah
The Indian equity landscape is defined by volatility, with benchmark indices recently navigating a crucial period of global uncertainty and mixed corporate performance. While the foundational view persists that the market faces pressure from international risk aversion and sector rotations—partially driven by global shifts toward **Artificial Intelligence** themes—the latest data suggests underlying domestic resilience. *** Current Market Dynamics and Flows The headline indices recently staged a modest recovery, yet the trading environment remains highly selective and cautious. As of January 27, 2026, the Nifty 50 closed marginally higher at **25,175**, while the BSE Sensex settled at **81,857**. This recovery followed a period where the market showed downside pressure, with Nifty dipping near the critical **24,900** support zone. A primary drag on sentiment remains the sustained selling pressure from **Foreign Institutional Investors (FIIs)**. In the first half of January 2026 alone, FPIs registered significant net outflows totaling approximately **₹26,500 crore**. This capital withdrawal, linked to global factors, is being counterbalanced by robust buying from **Domestic Institutional Investors (DIIs)**, who continue to provide a floor to the market structure. *** Q3 Earnings and Sectoral Strength Contrary to earlier expectations of uniformly muted earnings growth, the initial phase of the third-quarter (Q3 FY26) results has delivered a mixed but resilient picture. Nifty 50 companies are signaling resilience, with overall operating profit growth pegged higher than sales growth in many pockets. The strength is particularly concentrated in key cyclicals and defensive segments, validating the focus on specific sectors. **Financials** are demonstrating outperformance. The Nifty Bank index surged significantly, reflecting renewed institutional confidence. **Axis Bank**, for instance, saw a strong jump, closing over **4.5%** higher following a surprise rise in its quarterly profit. Other large private sector banks also posted healthy Q3 numbers, with core profit growth remaining stable. The **Metals** sector is also confirming a strong up-cycle. Shares of companies like **JSW Steel** rallied after reporting a nearly triple jump in net profit for the December quarter. This momentum in metals is further buoyed by a global tailwind, including silver prices reaching record levels. Conversely, sectors like IT, Auto, and FMCG are experiencing continued pressure, with IT results largely in line with seasonal, patchy demand expectations. *** The Path to a Stock-Picker’s Market The convergence of divergent sectoral performance, highly selective earnings outcomes, and persistent FII volatility strongly reinforces the view that **2026** will transition into a genuine **stock-picker’s market**. The phase of generalized index gains, driven broadly by liquidity or passive flows, is receding. Instead, wealth creation will increasingly rely on bottom-up fundamental analysis and disciplined asset allocation. The widening disparity in performance—such as the recent sharp gains in cement and logistics stocks post-results contrasting with pressure in other sectors—demands that investors prioritize: 1. **Valuation Discipline:** Buying at the right price is paramount, especially as volatility increases ahead of key events like the upcoming Union Budget. 2. **Asset Allocation:** Strategically shifting capital based on the relative strength and valuations across market capitalizations and sectors will be crucial to safeguarding returns and capturing alpha in this highly fragmented market structure. The current environment, marked by high institutional divergence, necessitates a meticulous, active investment approach focused on quality earnings and growth potential within preferred, defensive cyclicals.
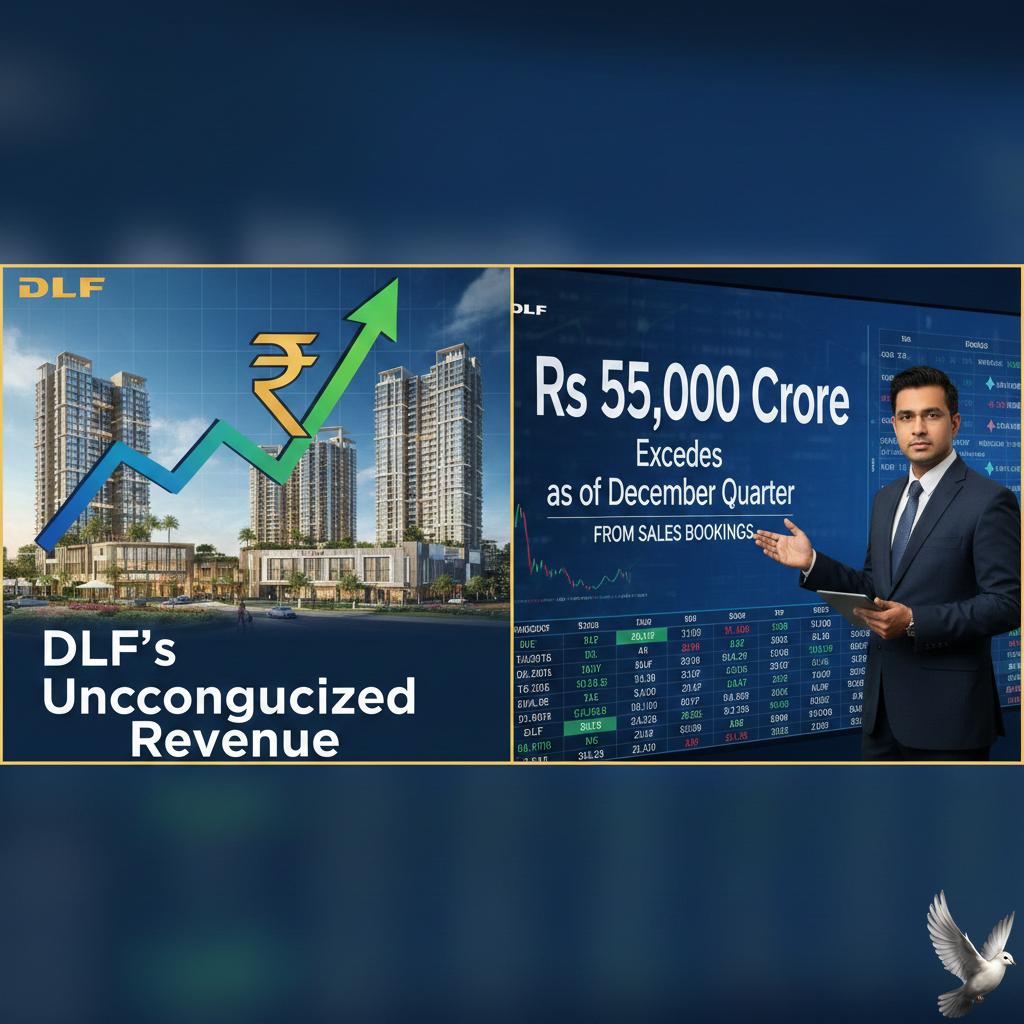
DLF's Unrecognized Revenue from Sales Bookings Exceeds Rs 55,000 Crore as of December Quarter
**DLF Market Brief: Unrecognized Revenue and Q3 Financial Strength** Realty giant DLF Limited remains fundamentally strong, underscored by a massive reservoir of future income. As of the end of the December quarter (Q3 FY26), the company is yet to formally recognize over **₹55,425 crore** in revenue from its total sales bookings. This figure, which the company confirmed in its latest presentation, represents the portion of sold properties—primarily housing—that has not yet flowed through the profit and loss account. This is standard in real estate, where revenue is recognized based on construction completion or the percentage-of-completion method. The total sales booked across existing projects currently stand at **₹79,885 crore**, of which **₹24,460 crore** has already been recognized. *** **Cash Flows and Financial Milestones** DLF's third quarter of fiscal year 2026 was defined by exceptional financial discipline and record cash generation. The company reported gross collections of approximately **₹5,100 crore** in Q3, marking the highest collections ever recorded by the firm. This robust inflow drove a substantial operating cash surplus of **₹3,876 crore** for the quarter. Significantly, this performance enabled DLF to achieve the strategic goal of attaining **zero gross debt** in its development business, well ahead of its estimated timeline. The balance sheet now boasts a gross cash position of around **₹11,660 crore**. For the first nine months of the fiscal year, net surplus cash generation reached **₹6,432 crore**, surpassing the total cash generated during the entire previous fiscal year. *** **Operational Results and Sales Momentum** DLF posted healthy growth in core financial metrics despite muted sales bookings in the quarter. Consolidated revenue for Q3 FY26 surged **32%** year-on-year to **₹2,020 crore**. Consolidated net profit for the quarter increased by **13.66%** to **₹1,203.36 crore**. Profit after tax before exceptional items grew **29%** year-on-year to **₹1,252 crore**. Quarterly new sales bookings, however, saw a sharp decline to **₹419 crore** from a very high base of **₹12,093 crore** in the year-ago period. This reduction was primarily due to a conscious pause in new bookings for the ultra-luxury residential project, 'The Dahlias,' to implement design modifications. Cumulatively, sales bookings for the first nine months of the fiscal year stood at **₹16,176 crore**, down **16%** from **₹19,187 crore** in the prior year period. Management remains confident in achieving its full-year sales guidance of **₹20,000–22,000 crore**, banking on resumed sales at 'The Dahlias' and upcoming project launches in Q4. *** **Annuity Business and Sector Outlook** The annuity portfolio, held under DLF Cyber City Developers Limited (DCCDL), continues to provide predictable growth. DCCDL's rental income grew by **18%** year-on-year to **₹1,412 crore** in Q3, with its EBITDA also rising **18%** to **₹1,464 crore**. The operational portfolio remains extensive at approximately **49 million square feet**, maintaining high occupancy levels of over **94%**. DLF is also strategically expanding, recently announcing plans to launch a senior living housing project in Gurugram this quarter, targeting a potential revenue of around **₹2,000 crore**. In the broader market, the Indian real estate sector is poised for sustained growth in 2026, driven by strong residential demand, rising incomes, and robust institutional investment, estimated to be between **USD 5–7 billion** annually. High-end and luxury housing segments, DLF’s focus areas, are leading this trend. DLF's strong financial position, including zero gross debt and a large land bank, has led to improved credit ratings and analyst confidence, with many brokerages maintaining a 'Buy' rating on the stock.
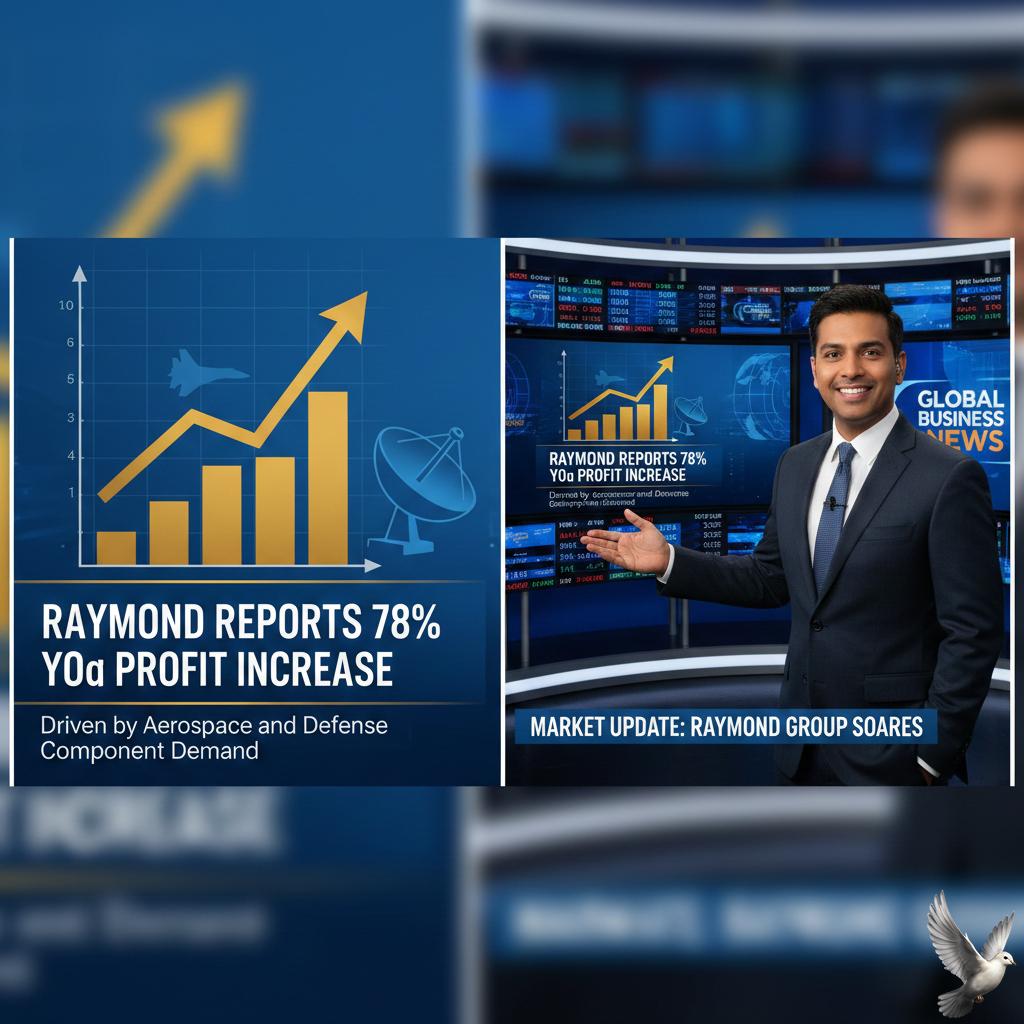
Raymond Reports $78\%$ YoY Profit Increase Driven by Aerospace and Defense Component Demand
Raymond, the diversified Indian conglomerate, delivered a strong operational performance in the third quarter of Fiscal Year 2026, largely powered by exceptional demand for its specialized engineering divisions. The company's operational strength translated to a substantial surge in core profitability. Consolidated revenue for Q3 FY26 reached **₹580 crore**, marking an **18%** increase year-on-year. This top-line momentum was mirrored in operating profit, with EBITDA climbing **27%** to **₹83 crore**. This success led to a **100 basis point** expansion in EBITDA margins, signaling improved operational efficiencies. While net profit figures showed complexity due to one-time charges, the underlying business momentum confirmed the firm's strong trajectory. Earlier reports highlighted a profit rise of approximately **78%** for the period, driven purely by the industrial segments. *** The standout performer remains the **Aerospace & Defense** segment. This highly strategic division posted a spectacular **49%** year-on-year revenue surge, generating **₹105 crore** in the quarter. This rapid growth is fueled by production ramp-ups for key aerospace Original Equipment Manufacturers and the commercial launch of newly developed, complex precision components. The segment is aggressively capitalizing on the sustained trend of domestic vendors moving toward high-value subsystems. The broader **Precision Technology and Auto Components** business also demonstrated robust health. This division recorded a **15%** revenue growth, achieving **₹417 crore** in Q3 FY26, with margins expanding significantly by over **300 basis points**. This highlights a successful shift towards high-demand hybrid products and specialized components, securing a robust pipeline for both domestic and export partners. *** The company’s growth narrative is tightly interwoven with India’s ambitious defense indigenization drive. The Indian government’s **'Atmanirbhar Bharat'** (Self-Reliant India) policy is creating powerful tailwinds for private sector firms like Raymond. The Ministry of Defence’s latest budget allocation stands at over **₹6.81 lakh crore** for FY 2025–26, the highest among all ministries. Furthermore, three-fourths of the modernization budget, approximately **₹1.11 lakh crore**, is strictly earmarked for domestic procurement. This focus on local sourcing ensures long-term visibility for Indian manufacturers of advanced aerospace and defense parts. India is currently set to spend a staggering **$130 billion** on fleet modernization over the next five to seven years. The estimated order pipeline for Defence Public Sector Undertakings is already a substantial **₹10 lakh crore**. This macro environment provides an exceptionally favorable backdrop for Raymond's engineering capabilities. *** Despite strong operational numbers, Raymond’s stock performance on the day of the earnings announcement (January 27, 2026) showed significant intraday volatility. The stock touched an intraday low of **₹361.6**, reflecting broader market pressure and historical concerns. Despite the company’s strong quarter, the stock has trended lower, lagging behind broader market indices like the Sensex over the past year. However, the company continues to maintain a structurally strong balance sheet. Raymond remains a net debt-free entity, reporting a healthy cash surplus of **₹214 crore** at the quarter's end. This financial prudence provides a stable foundation for the firm to continue strategic investments into its high-growth defense and aerospace verticals. The management is focused on sustained momentum across its key divisions, ensuring the company is well-positioned to leverage India's strategic push to become a global defense manufacturing and export hub.
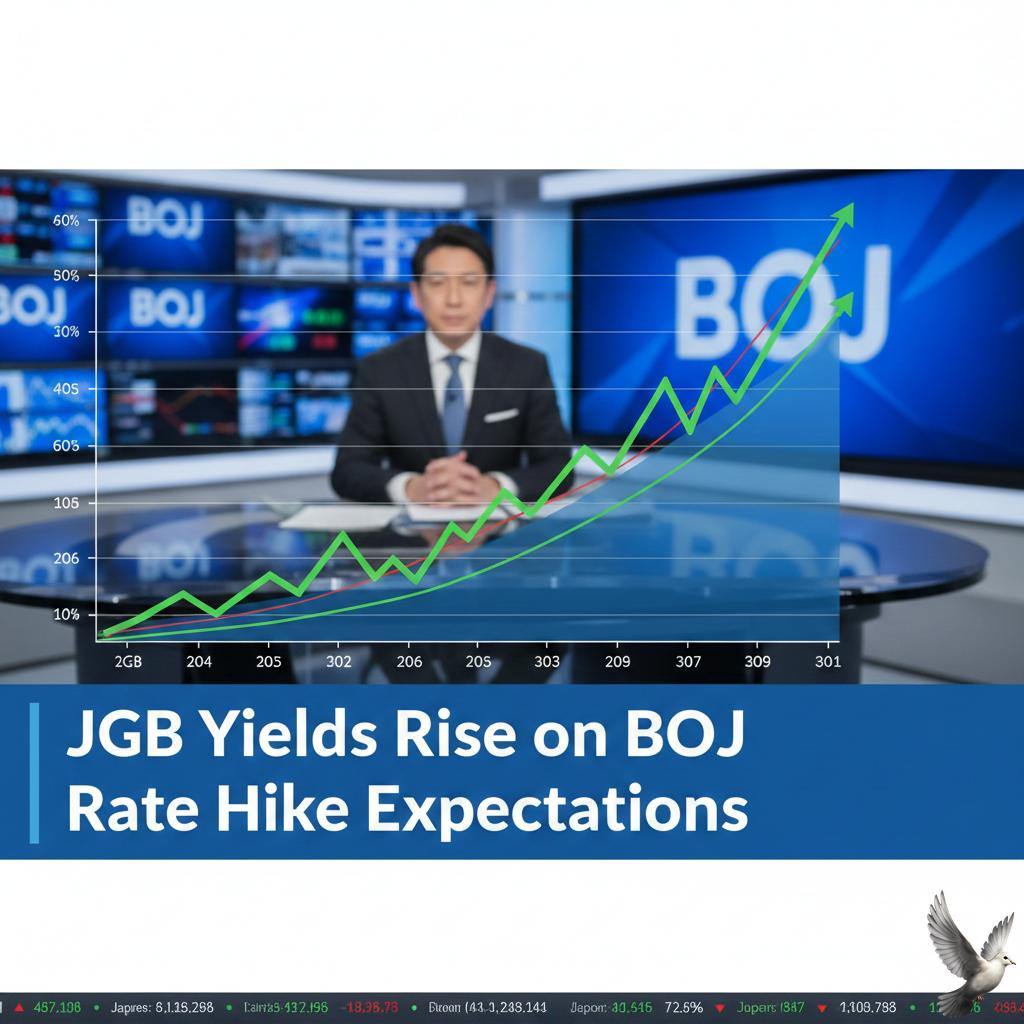
JGB Yields Rise on BOJ Rate Hike Expectations
**Market Brief: JGB Yields & Yen Volatility** **Bond Yields Test Multi-Decade Highs** Japanese Government Bond (JGB) yields remain elevated, with the benchmark 10-year yield trading around **2.25%** as of late January 2026. This follows a surge earlier in the month where yields temporarily touched **2.37%**, marking a fresh **27-year high**. Market sentiment is heavily influenced by expectations of further monetary tightening. Despite the Bank of Japan (BOJ) holding its key short-term interest rate steady at **0.75%** during the January 23 meeting, policymakers upgraded GDP and inflation forecasts for fiscal years 2025 and 2026. This hawkish outlook has reinforced investor bets on additional rate hikes later this year. **Yen Strengthens on Policy Signals** The Japanese yen has gained ground, trading near **153.73** against the US dollar, recovering from weaker levels near **159.00** seen earlier in the month. The currency's recent appreciation reflects growing caution over potential government intervention and the BOJ's signal that it will continue to normalize policy if economic targets are met. **Political & Fiscal Headwinds** Volatility is further amplified by domestic political uncertainty ahead of the **February 8 snap election**. Prime Minister Takaichi’s proposed fiscal expansion and tax cuts have sparked concerns over Japan's fiscal health, contributing to the upward pressure on long-term bond yields. **Key Figures at a Glance** * **10-Year JGB Yield:** ~2.25% (Recent peak: 2.37%) * **USD/JPY:** ~153.73 * **BOJ Policy Rate:** 0.75% (Unchanged in Jan) * **Core Inflation (Dec):** 2.1%

Saudi Aramco $\$4$ Billion Global Debt Market Bond Issue
**Market Brief: Saudi Aramco Debt Issuance & Market Sentiment** **Date:** January 27, 2026 **Topic:** Saudi Aramco $4 Billion Bond Issuance **Executive Summary** Saudi Aramco has successfully priced a **$4 billion** multi-tranche international bond, marking its first global debt market transaction of **2026**. The issuance generated significant investor interest, with the order book exceeding **$21 billion**—more than **5x** oversubscribed—allowing the energy giant to significantly tighten pricing across all maturities. **Bond Structure & Pricing Details** The offering was split into four tranches with spreads narrowing sharply from initial guidance due to robust demand: * **3-Year