Bearish News
Collection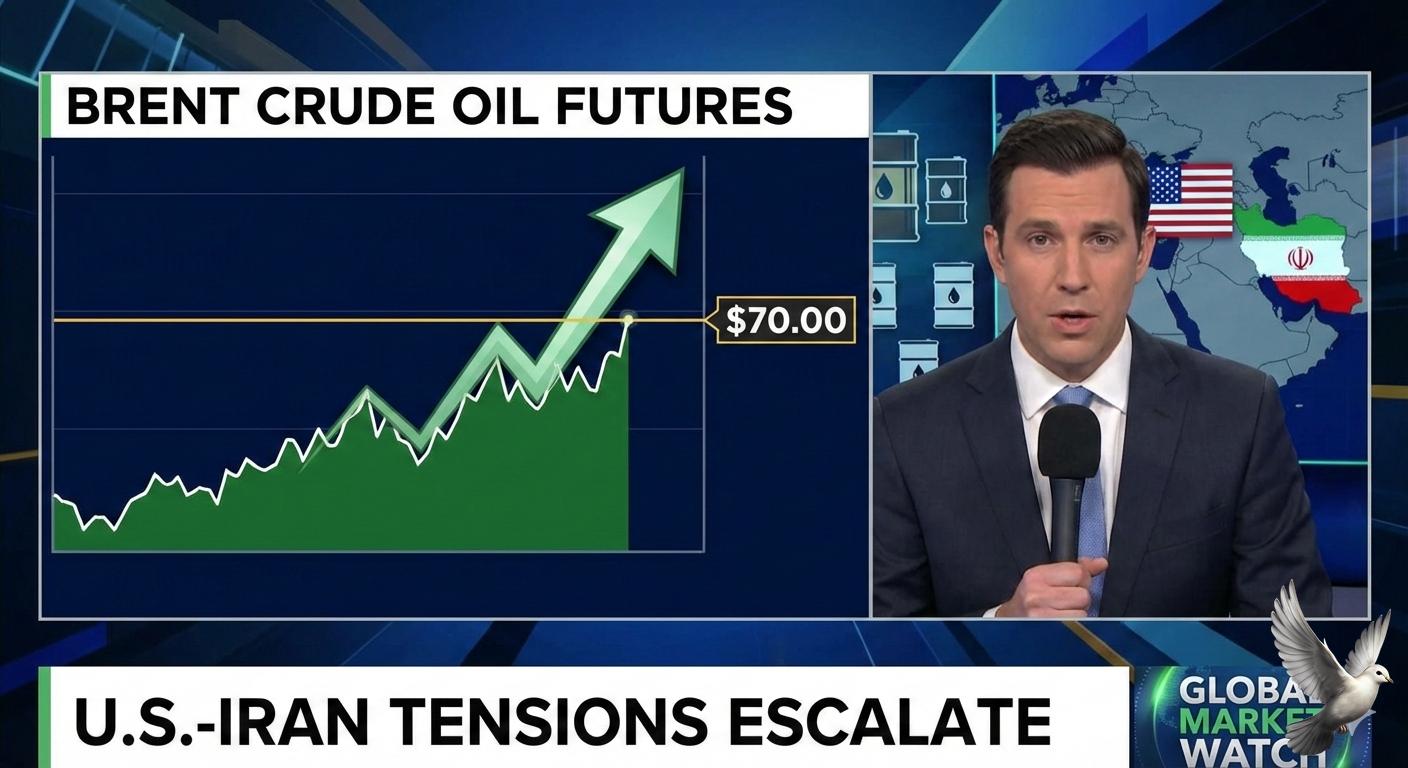
Brent Crude Oil Futures Cross $\$70$ Amid U.S.-Iran Tensions
**Global Energy Markets: Brent Breaches $70 on US-Iran Escalation** **Executive Summary** Oil markets witnessed a sharp rally late this week, with Brent Crude reclaiming the **$70 per barrel** psychological threshold for the first time in months. The surge is driven primarily by renewed geopolitical risk premiums following aggressive rhetoric from the US administration regarding Iran. **Key Market Data (As of Jan 30, 2026)** * **Brent Crude:** **$70.65** (+3.3% intraday) * **WTI Crude:** **$65.46** (+3.6%) * **Natural Gas:** **$3.88** (+3.9%) **The Catalyst: Geopolitical Tensions** Prices spiked after US President Donald Trump issued a strict ultimatum to Tehran: agree to a new nuclear deal or face military strikes. * **Naval Buildup:** Reports indicate a significant concentration of US naval forces in the Middle East, including carrier strike groups. * **Strait of Hormuz:** Anxiety has deepened following reports that Iran plans live-fire drills in this critical shipping lane, through which **20%** of the world's oil passes. * **Market Reaction:** Traders are rapidly pricing in a "war premium," estimated by analysts to add **$3–$4** per barrel to current prices. **Broader Context** * **Reversal of Trend:** The rally contradicts recent bearish sentiment driven by projected oversupply and rising US inventories. * **Supply Risks:** Beyond Iran, markets are monitoring disruptions in Kazakhstan and uncertainty surrounding Venezuelan exports, further tightening the supply outlook. * **Technical Outlook:** With Brent clearing the **$70** resistance level, technical analysts suggest the next major resistance zone lies near **$80**, provided geopolitical pressure remains high. **Market Sentiment** Bearish fundamentals (inventory builds) are currently being overridden by the immediate threat of supply disruption. Volatility is expected to remain elevated as markets await Tehran's official response and monitor US naval maneuvers. **Next Step for You:**

European Equities Advance Led by Mining and Energy Stocks
**European Market Brief: Commodities Rally Counters Earnings Pressure** **Thursday Market Recap** European equity markets staged a resilient rebound on Thursday, January 29, defying a heavy drag from the luxury and technology sectors. The recovery was fueled primarily by a surge in commodity-linked stocks, as intensifying geopolitical tensions drove investors toward safe-haven assets and energy plays. **Sector Performance & Drivers** * **Commodities Surge:** The mining and energy sectors outperformed, lifting the broader indices. Precious metals hit historic levels, with **Gold** and **Silver** prices reaching new peaks amid safe-haven inflows. Oil prices also climbed, with **Brent Crude** touching a four-month high as traders priced in escalating supply risks from the Middle East. * **Luxury Under Pressure:** Sentiment in the consumer discretionary space remained fragile following disappointing earnings. **LVMH** shares tumbled approximately **7.3%**, weighing heavily on the sector. Peers including **Kering** and **Hermès** tracked lower, as the industry grapples with softening global demand. * **Tech Volatility:** Technology stocks faced significant headwinds. Europe’s largest software company, **SAP**, plunged over **11%** after its fourth-quarter revenue missed market estimates, casting a shadow over the sector's growth outlook. **Key Indices & Data** While the **STOXX 600** managed to trade in positive territory for much of the session—rising **0.2%** in early trading—gains were capped by the steep losses in heavyweight constituents. The index ultimately faced resistance near the close as investors digested the mixed corporate scorecard against a backdrop of macroeconomic uncertainty. **Market Outlook** Heading into the week's close, attention remains fixed on geopolitical developments and the remaining slate of corporate earnings. The divergent performance between defensive commodity stocks and cyclical consumer sectors highlights a market currently driven by risk-off sentiment and selective rotation.

Economic Survey: Rupee Faces Global Headwinds Despite Strong Fundamentals
**MARKET BRIEF: RUPEE AT RECORD LOW VS. ECONOMIC FUNDAMENTALS** **Date:** January 30, 2026 **Topic:** INR Performance & Economic Survey 2025–26 Insights **Current Status: Rupee Hits 92.00** The Indian Rupee (INR) has breached a historic psychological barrier, touching a record low of **92.00** against the US Dollar as of January 29, 2026. This depreciation comes despite a backdrop of robust domestic stability. The newly tabled **Economic Survey 2025–26** explicitly states that the currency is now “punching below its weight,” highlighting a sharp divergence between India’s macroeconomic strength and its currency valuation. **The Valuation Paradox** The Survey underscores a critical disconnect. While the rupee has weakened, India’s core economic indicators remain stellar: * **GDP Growth:** Projects a healthy **6.8%–7.2%** expansion for FY27. * **Inflation:** Remains contained within the RBI's target band. * **Balance Sheets:** Corporate and banking sector health is at its strongest in years. Officials argue that the current exchange rate does not accurately reflect these fundamentals. Instead, the currency is being battered by external headwinds rather than internal weakness. **Market Drivers: The Sell-Off** The primary force dragging the rupee down is aggressive capital flight. * **FPI Outflows:** Foreign Portfolio Investors have pulled out approximately **₹41,280 crore** from Indian equities in January 2026 alone. * **Record Exits:** This marks the highest monthly outflow since January 2025. Global cues are intensifying the pressure. The **US Federal Reserve** recently opted to keep interest rates unchanged, keeping the dollar index strong and US bond yields elevated. This has reduced the appeal of emerging market assets, triggering a “risk-off” sentiment globally. **Strategic Implications: Tariffs & Trade** The Survey offers a nuanced view on the depreciation, noting it might not be entirely detrimental in the short term. * **Export Cushion:** An undervalued rupee helps offset the impact of steeper **US tariffs** recently imposed on Indian merchandise. * **Import Costs:** With Brent crude trading relatively soft around **$69–$70** per barrel, the inflationary risk from a weaker currency is currently manageable. However, the government warned that while a cheaper currency aids competitiveness, prolonged volatility is causing hesitation among global investors. The document calls for an examination of this "investor reluctance" to commit capital despite India's growth story. **Geopolitics & The "Power Gap"** In a candid assessment, the Survey references the **Lowy Institute’s Power Gap Index**, noting India is operating with a negative score of **-4.0**—the lowest in Asia outside of sanctioned states. This suggests that while India’s economic engine is powerful, its strategic insulation against global financial shocks remains a work in progress. The rupee is effectively becoming a casualty of shifting global alliances and trade fragmentation. **Summary Outlook** * **Currency:** Trading at **92.00** (Record Low). * **Sentiment:** Bearish due to global cues; bullish on domestic fundamentals. * **Policy Stance:** Authorities view the dip as a global realignment rather than a local failure, though "investor pause" remains a key concern to address in the upcoming Union Budget.
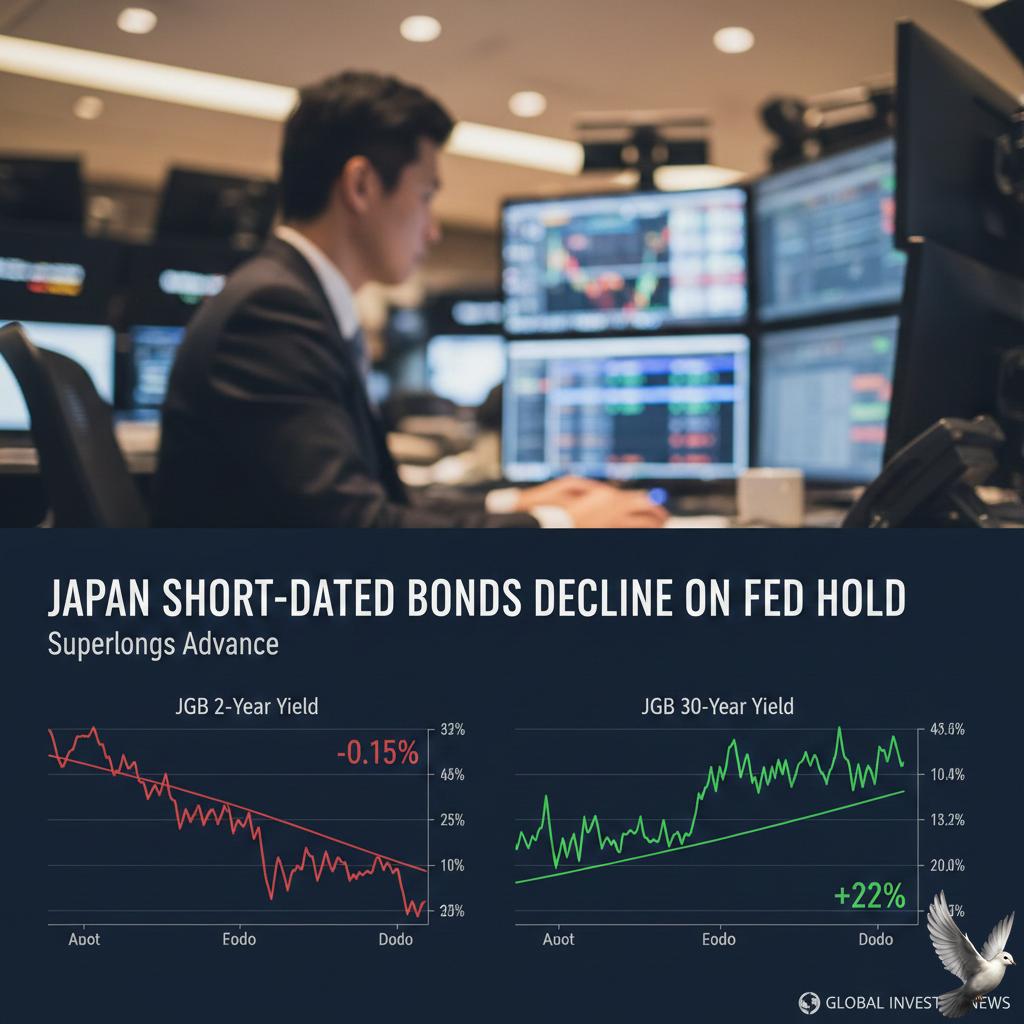
Japan Short-Dated Bonds Decline on Fed Hold as Superlongs Advance
**MARKET BRIEF: JAPAN SOVEREIGN DEBT** **Thursday, January 29, 2026** **Session Overview** Japanese Government Bonds (JGBs) displayed mixed performance on Thursday. While shorter-dated notes faced selling pressure—tracking weakness in U.S. Treasuries—the super-long end found much-needed stability. **Auction Relief** Sentiment in the long end was buoyed by the successful execution of Wednesday’s **40-year JGB auction**. Despite fears of a demand vacuum, the sale attracted robust interest with a bid-to-cover ratio of **2.76x**, the strongest since March 2025. This demand helped pull the 40-year yield down to approximately **3.9%**, retreating from an all-time high of **4.205%** touched earlier in the week. **Yield Landscape** Benchmark yields remain at multi-decade highs but have softened from peak panic levels: * **10-Year:** Hovering near **2.25%**, down slightly from the 27-year high of 2.38%. * **30-Year:** Trading above **3.6%**. * **Policy Rate:** The Bank of Japan is holding steady at **0.75%**, with markets now eyeing June for the next potential hike. **Political Headwinds** Investors remain on high alert ahead of the **February 8 snap election**. Prime Minister Sanae Takaichi’s pledge for significant fiscal stimulus—specifically a suspension of the food sales tax—has stoked concerns over fiscal deterioration, drawing comparisons to the UK's 2022 "mini-budget" crisis. This political uncertainty continues to cap any significant rally in bond prices. [Japan Bond Meltdown Sends Yields to Record High](https://www.youtube.com/watch?v=maeAgCeMwdQ) This video provides relevant context on the recent surge in JGB yields and the political factors driving the "meltdown" mentioned in the brief. http://googleusercontent.com/youtube_content/0
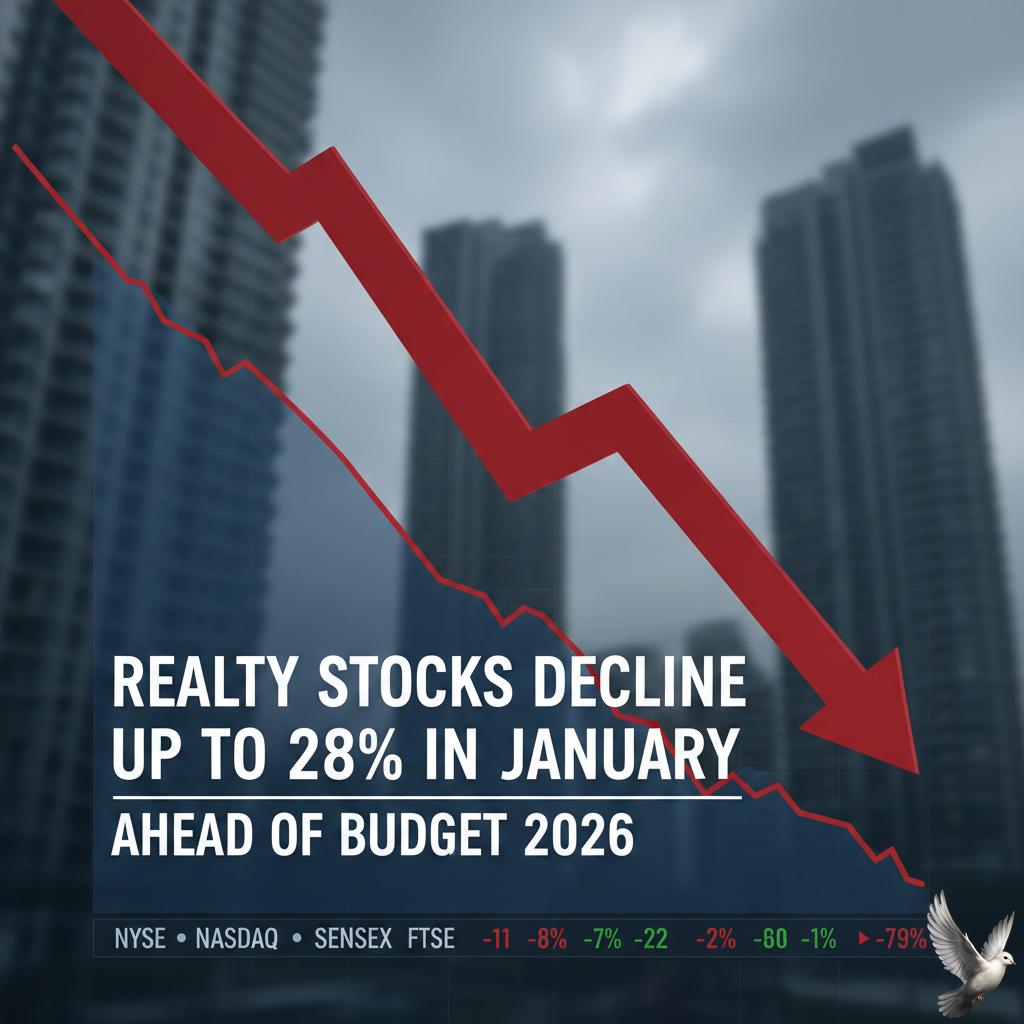
Realty Stocks Decline Up to 28% in January Ahead of Budget 2026
**Market Brief: Realty Sector Under Pressure** **Current Snapshot: January 2026 Slump** The Indian real estate sector faces renewed volatility as the Nifty Realty index records a sharp correction of approximately **12.3%** in January 2026. As of late January, the index hovers near **776**, erasing gains from late 2025. This downturn marks the index's tenth consecutive session of losses, dragging it down roughly **23%** from its recent 52-week highs. **Historical Context: A Recurring Seasonal Weakness** This year's performance mirrors a historical trend of sluggish starts for the sector. January 2026 now rivals January 2025, which previously held the record for the steepest monthly decline at **12.45%**. Data from the past six years highlights this recurring January weakness: * **2026:** Down ~12.3% (Current) * **2025:** Down 12.45% * **2024:** Up >9% (The lone outlier) * **2023:** Down 4.69% * **2022:** Down 0.81% * **2021:** Down 2.61% **Key Drivers & Stock Movements** Market sentiment remains dampened by pre-budget caution and concerns over sustainable demand. Major constituents like **DLF**, **Godrej Properties**, and **Lodha Developers** have witnessed significant corrections, trading near or at their 52-week lows. Newly listed players such as **Signature Global** have also seen steep declines, shedding over **20%** year-to-date. Investors are currently adopting a wait-and-watch approach, looking to the upcoming Union Budget for potential relief measures, particularly regarding affordable housing definitions and tax deductions on home loans.
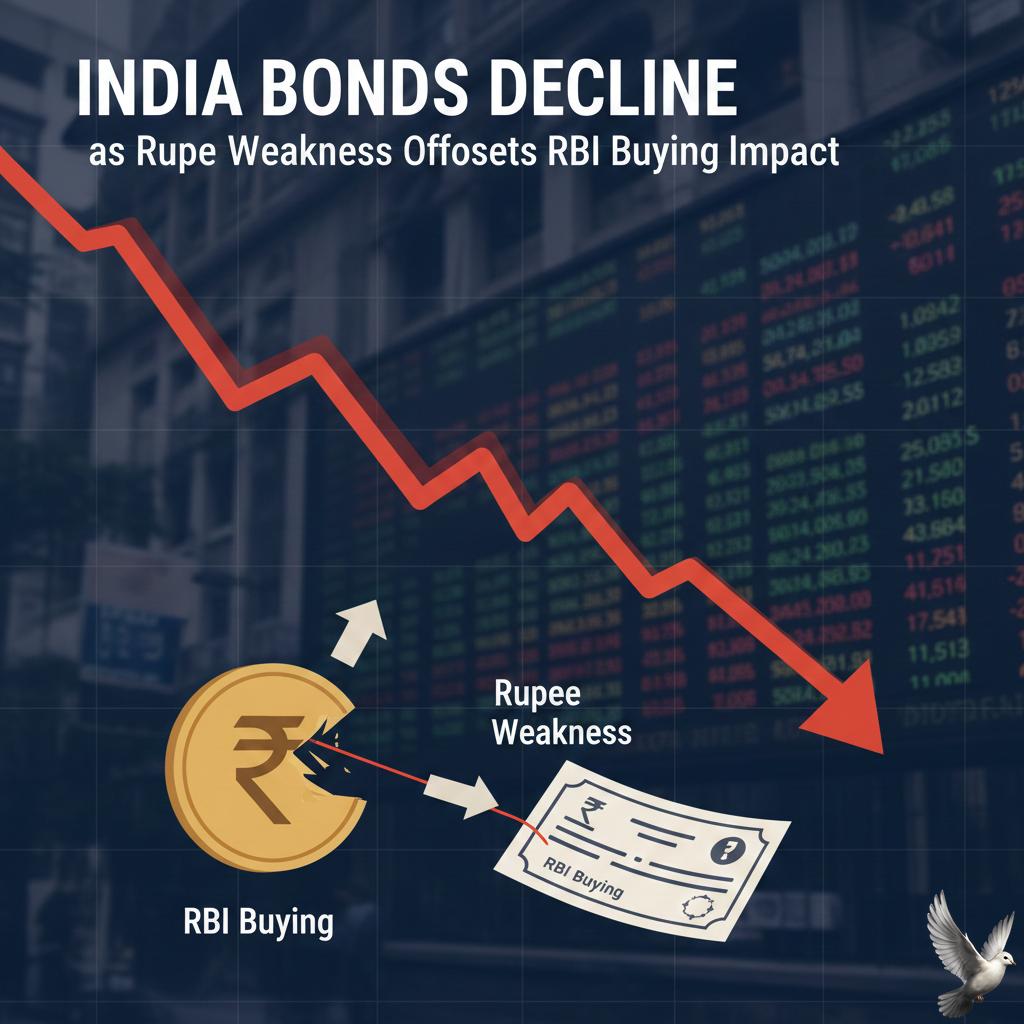
India Bonds Decline as Rupee Weakness Offsets RBI Buying Impact
**Market Brief: Rupee Hits Record Lows Amidst Bond Yield Surge** **Rupee Under Pressure** The Indian rupee has depreciated to a historic low, breaching the **92.00** mark against the US dollar in late January 2026. Persistent demand for the greenback, driven by month-end importer hedging and elevated US bond yields, has intensified pressure on the domestic currency. Despite India’s resilient economic growth, the rupee is facing headwinds from sustained foreign portfolio outflows and broad strength in the dollar index. **Bond Markets & Yields** Indian government bonds are witnessing a downturn, with the benchmark 10-year yield climbing to approximately **6.7%**, a 10-month high. Traders remain cautious ahead of the upcoming Union Budget, where government borrowing for FY27 is projected to reach record levels of **₹16–17.5 trillion**. The surge in state government bond issuance has further strained market appetite, adding supply-side pressure that is outweighing immediate support from domestic institutions. **RBI's Balancing Act** The Reserve Bank of India (RBI) is navigating a complex liquidity landscape. While the central bank defends the rupee through dollar sales—which drains rupee liquidity—it has simultaneously announced a massive **₹3 trillion** infusion plan. This includes Open Market Operations (OMOs), Variable Rate Repos (VRR), and a forex swap to ensure the banking system remains liquid. However, markets remain concerned that the liquidity drained by forex interventions could partially negate the impact of these injection measures. **Foreign Flows & Sentiment** Investor sentiment is dampened by weak foreign inflows, with Foreign Portfolio Investors (FPIs) remaining net sellers in January 2026. Global capital is currently pivoting toward US markets and AI-centric hubs, leaving emerging market debt under pressure. Traders are now keenly awaiting the February 1 budget announcements to gauge the government's fiscal consolidation path and borrowing calendar.

Gold Gains 9% in One Day, Outperforming Silver
**MARKET BRIEF: PRECIOUS METALS GO PARABOLIC** **GOLD & SILVER SHATTER RECORDS | JANUARY 29, 2026** The precious metals complex has entered a historic phase of repricing. Gold prices on the MCX have skyrocketed over **9%** in a blistering rally, crushing previous resistance levels as global capital flees paper assets for tangible security. This surge is not merely a fluctuation but a structural shift driven by a perfect storm of monetary distrust, geopolitical escalation, and fears over Federal Reserve independence. **Price Action: Uncharted Territory** The numbers are staggering. Gold futures on the MCX have surged to touch a new peak near **₹1,80,000** per 10 grams, extending a rally that has seen prices jump over **28%** in January alone. In the international spot market, the yellow metal has breached the psychological **$5,600** per ounce mark, driven by relentless buying momentum. Silver has delivered even more explosive performance. Often termed "gold on steroids," the white metal has outperformed its peer, crossing the massive **₹4,00,000** per kg milestone on the MCX. Internationally, spot silver is trading near **$119** per ounce, fueled by a dual engine of industrial shortages and monetary demand. The gold-silver ratio is shifting, but both metals are clearly in a breakout mode that defies traditional overbought signals. **The Drivers: Why The Panic Buying?** The narrative has shifted from simple inflation hedging to a deeper crisis of confidence. **1. The "Trust" Crisis & Fed Independence** Investors are aggressively dumping fiat currency exposure. Concerns regarding the U.S. Federal Reserve’s independence under the current administration have triggered a flight to safety. With the **US Dollar Index (DXY)** plunging to multi-year lows and U.S. debt levels spiraling, the market is pricing in a potential debasement of the dollar. The "risk-free" status of U.S. Treasuries is being questioned, pushing institutional capital into the only asset with no counterparty risk: Gold. **2. Geopolitical Firestorm** Tensions have escalated dramatically. Reports of potential new U.S. strikes on Iran and stalled nuclear negotiations have injected a massive war premium into the market. Simultaneously, renewed trade war rhetoric—specifically aggressive tariff threats from the U.S. administration—is fracturing global supply chains. This geopolitical fragmentation is accelerating the move away from a U.S.-centric trade model, benefiting non-sovereign assets. **3. Relentless Central Bank Accumulation** While retail investors chase the rally, Central Banks have been building a floor under the market for months. Emerging market central banks, particularly in Asia, are diversifying reserves at a record pace. This official sector buying has created a supply squeeze, absorbing available physical inventory even at these elevated price levels. **Market Sentiment: The Shift to Hard Assets** The psychology of the market has fundamentally changed. We are witnessing a capitulation of the "paper trade" as investors rush toward hard assets. The 9% surge on the MCX reflects not just speculation, but a scramble for physical delivery. The traditional inverse relationship between rates and gold has broken down; gold is rising regardless of yield movements, signaling that **fear of currency failure** is now the dominant driver. With silver joining the party and breaking the **₹4 Lakh** barrier, the momentum suggests this is a broad-based exit from the fiat system rather than a temporary spike. Volatility will likely remain extreme. As prices test these stratospheric levels, intraday swings of **₹2,000–₹5,000** are becoming the new normal. However, the underlying trend remains powerfully bullish, supported by a global loss of faith in traditional financial architecture.

Dollar Stabilizes as US Pushes Back on Currency Intervention
**Global Markets: Dollar Rebounds as US Rejects Yen Intervention** **Executive Summary** The US Treasury has firmly dismissed speculation of joint currency intervention to support the Japanese yen. Treasury Secretary Scott Bessent’s explicit rejection of market interference catalyzed a sharp recovery in the greenback, reversing its slide to four-year lows. **Key Developments** * **Bessent’s Stance:** In a decisive CNBC interview, Secretary Bessent stated the US is **"absolutely not"** intervening in the dollar-yen market. He clarified that the administration’s "strong dollar policy" focuses on economic fundamentals rather than exchange rate manipulation. * **Yen Weakens:** The comments effectively removed the immediate threat of coordinated selling, causing the Japanese yen to surrender recent gains. * **Fed Decision:** The Federal Reserve held interest rates steady on Wednesday, further stabilizing the currency outlook as Chair Powell signaled a pause on immediate rate cuts. **Market Reaction** * **Dollar Index (DXY):** Surged approximately **0.5%** to trade near **96.40**, bouncing off a multi-year low of 95.86 hit earlier in the week. * **USD/JPY:** The pair rallied over **1.1%**, reclaiming the **153.80** level as traders unwound bets on government intervention. * **Euro (EUR/USD):** Slid roughly **1.1%** to **1.1910**, retreating from highs seen earlier in the session. * **Commodities:** Despite the stronger dollar, Gold (XAU/USD) remained resilient, trading above **$5,300/oz** on sustained safe-haven demand. **Context & Outlook** The volatility follows President Trump’s earlier remarks brushing off the dollar’s weakness, which markets initially interpreted as a green light for depreciation. Bessent’s clarification has temporarily calmed fears of a policy shift, refocusing investor attention on the divergence between the US and Japanese economies. With the Fed holding firm, the path of least resistance for the dollar appears steadier, though fiscal concerns and trade dynamics remain long-term headwinds.

Tech Valuations Pressured by Heavy AI Spending and Slower Growth
**Market Brief: Big Tech Earnings & AI CapEx (January 2026)** **The Headline:** Investors face a new reality as of **January 29, 2026**. The "growth at any cost" era for AI has shifted to "show me the returns." While Big Tech revenue remains robust, the staggering price tag of building AI infrastructure is triggering volatility. **Microsoft: Beating Numbers, Failing Sentiment** Despite delivering a strong **Fiscal Q2 2026** report yesterday, Microsoft stock slid **>6%** in after-hours trading. * **Revenue:** **$81.3 billion** (+17% YoY), beating estimates. * **Cloud Strength:** Azure revenue grew **39%**, signaling re-acceleration driven by AI demand. * **The Problem:** Capital expenditures (CapEx) ballooned to **$37.5 billion** in a single quarter (+66% YoY). * **Takeaway:** Investors are spooked by the sheer scale of spending (primarily on GPUs and data centers) despite management’s assurance that we are only in the "beginning phase of AI diffusion." **Meta: Ad Revenue Funds the Future** Meta’s Q4 2025 report offered a different narrative, with shares holding steady/rising slightly (+0.38%) post-market. * **Revenue:** **$59.9 billion** (+24% YoY), driven by unexpected ad strength. * **Profitability:** EPS hit **$8.88** (+11% YoY). * **The AI Bet:** Meta stunned the market with a massive 2026 CapEx forecast of **$115–$135 billion**. * **Reaction:** unlike Microsoft, Meta’s core advertising engine is generating enough immediate cash to pacify investors nervous about the long-term AI bill. **Industry Trend: The $600 Billion Question** The broader market is grappling with a projected **$600 billion** in combined Big Tech infrastructure spending for 2026. * **Alphabet (Google)** reports on **February 4**, with analysts watching closely to see if their Q3 cloud momentum (34% growth) sustains against rising costs. * **The Shift:** The narrative has moved from "who is buying GPUs?" to "who can monetize them fast enough?" Microsoft’s dip suggests the market’s patience for CapEx without immediate margin expansion is running low. **Summary** Strong fundamentals are currently battling "sticker shock" on infrastructure costs. Volatility will likely persist as the market digests the gap between record spending and the timeline for AI profitability.
Ten Small-Cap Stocks Decline Up to 40% in January 2026
**Market Brief: India Smallcap Correction (January 2026)** **Sector Overview: Sharp Downturn** The Indian smallcap segment is witnessing a severe correction in early 2026. Over **600** smallcap stocks have recorded double-digit losses within the first month of the year alone. The **Nifty Smallcap 100** and **BSE Smallcap** indices have shed between **6%** and **9%** in January, significantly underperforming broader benchmarks like the Nifty 50. **Key Drivers** This decline follows a period of aggressive valuation expansion. Analysts attribute the current sell-off to three primary factors: * **Valuation Fatigue:** Prices had detached from earnings growth in 2024–2025. * **Weak Earnings:** Q3 FY26 results for many smaller firms have missed estimates. * **Global Headwinds:** Geopolitical tensions and foreign institutional selling (FII outflows) have dampened sentiment. **Stock-Specific Action** Several prominent names have eroded significant shareholder wealth in weeks: * **Systematix Corporate Services:** The stock has plummeted approximately **38%** in January, trading near **₹87**. * **Tejas Networks:** Down roughly **28%**, hitting 52-week lows amid widening losses. * **Other Laggards:** Stocks like Kiri Industries and Godfrey Phillips have seen corrections exceeding **25%**. **Spotlight: Balu Forge Industries** Balu Forge Industries emerged as one of the worst performers initially, crashing over **40%** in January to hit a 52-week low of **₹348**. However, the stock witnessed a dramatic turnaround on **January 29, 2026**. Prices surged **10%** to hit the upper circuit at **₹392** after the company announced its formal induction into the **NATO supply chain**. This mandate to supply critical defense components acted as a major trigger, snapping a nine-day losing streak despite the broader market weakness. **Market Outlook** While the correction has cooled overheated valuations, experts note that smallcap multiples remain above long-term historical averages. The volatility is expected to persist until the March quarter earnings provide clearer visibility on growth recovery.

Silver Crosses Rs 4 Lakh, Gold Rises Rs 10,000 as Fed Holds Rates: Investment Strategy
**Precious Metals Market Brief | January 29, 2026** **Record-Breaking Rally** Gold and silver futures have shattered previous records on the MCX, driven by intense buying momentum and global cues. * **Silver Futures:** Crossed the historic **₹4,00,000 per kg** mark, trading near **₹4,07,456** to **₹4,10,000**. * **Gold Futures:** Surged past **₹1,80,000 per 10 grams**, with 24-carat spot rates hovering around **₹1,78,850**. **Global Market Correlation** International markets mirror this volatility. Gold futures on Comex breached **$5,600 per ounce**, while silver futures climbed to a fresh peak of **$119.51 per ounce**. The divergence between the two metals has narrowed, though silver has outperformed gold in percentage gains this month due to aggressive industrial demand from the AI and solar energy sectors. **Key Drivers** **1. Federal Reserve Stance:** The U.S. Federal Reserve held interest rates steady at **3.50%–3.75%** in its first meeting of 2026. This decision to pause cuts, despite political pressure, has kept the U.S. dollar weak, further fueling the rally in non-yielding assets like bullion. **2. Geopolitical Instability:** Escalating tensions, specifically recent threats involving the U.S. and Iran, have accelerated safe-haven inflows. Institutional distrust and currency volatility are prompting investors to hedge heavily with physical assets. **3. Industrial Squeeze:** Silver's parabolic rise is compounded by a physical supply deficit. Buying from electronics and renewable energy manufacturers is colliding with investment demand, creating a sharp upward pressure on prices. **Market Sentiment** Traders remain bullish as liquidity flows into commodities. The current price action indicates a structural shift where dips are being aggressively bought, signaling sustained momentum for both metals in the near term.

Eicher Motors Share Price
Global Market Brief: January 29, 2026 **Equities: India Slides on Budget Jitters, Wall Street Mixed** Indian markets faced significant selling pressure today as caution prevailed ahead of the upcoming Union Budget. The **Nifty50** breached the psychological **25,200** mark, trading down **160 points** (-0.63%), while the **Sensex** plunged over **560 points** to **81,780**. Bearish sentiment was driven by foreign outflows and a lack of fresh triggers, despite optimism surrounding the India-EU free trade agreement talks. In the US, major indices closed mixed following the Federal Reserve’s decision to leave interest rates unchanged. The **Nasdaq** edged higher on tech strength, but the **S&P 500** remained flat. The Fed offered little clarity on future rate cuts, citing elevated inflation, which dampened investor enthusiasm. **Commodities: Precious Metals Hit Historic Highs** Gold and silver continued their record-breaking rally, driven by safe-haven demand and a weakening US dollar. **Gold** prices surged past **$5,500 per ounce**, aiming for the **$5,600** level, as geopolitical tensions and economic uncertainty fueled buying. **Silver** also saw massive gains, crossing the **$116** threshold and approaching **$120** globally. In India, silver futures smashed past **₹4 lakh** per kg for the first time. **Crude oil** prices remained volatile but firm, with Brent trading around **$68.80** and WTI near **$63.80**. Prices are being supported by escalating US-Iran tensions and production disruptions from US winter storms. **Crypto: Bitcoin Consolidates Below $90k** The cryptocurrency market remains rangebound as investors digest the Fed's latest policy stance. **Bitcoin** is trading around **$88,000**, struggling to reclaim the **$90,000** resistance level. **Ethereum** slipped nearly **1.7%** to trade near **$2,950**, while broader market volumes dipped. **Key Economic Drivers** * **Fed Policy**: The US Federal Reserve held rates steady at **3.50%–3.75%**, signaling a "higher for longer" approach until inflation cools further. * **India Budget**: Domestic markets are bracing for Sunday's Union Budget, with high volatility expected in the near term. * **Geopolitics**: Renewed US warnings regarding Iran and a softer dollar (trading near four-year lows) are accelerating the flight to hard assets like gold. ***

Power Grid Stock Beta Signals Consistent Market Behavior
**GLOBAL MARKET BRIEF: JANUARY 29, 2026** **Fed Holds Steady, S&P 500 Flirts with 7,000** Markets are digesting a pivotal 24 hours driven by the Federal Reserve's latest policy decision and a mixed bag of mega-cap earnings. The **Federal Open Market Committee (FOMC)** voted 10-2 to keep interest rates unchanged at **3.50%–3.75%**. Chair Jerome Powell signaled that while labor/inflation tension has eased, economic uncertainty remains "elevated," defying political pressure for deeper cuts. **Indices & Sentiment** Wall Street is pausing for breath after a historic session where the **S&P 500** briefly crossed the **7,000** threshold for the first time before closing fractionally lower. The tech-heavy **Nasdaq** outperformed, adding **0.3%**, while the **Dow Jones Industrial Average** finished flat, edging up just **0.08%**. Volatility is simmering under the surface. The **CBOE Volatility Index (VIX)** ticked up to **16.38**, reflecting trader caution as they re-price risk following the Fed’s "higher for longer" stance. **Tech Earnings: The "Mag 7" Divergence** The earnings spotlight produced a sharp divide in Big Tech fortunes post-market: * **Meta Platforms** surged **~7%** in after-hours trading. The social giant delivered a blowout quarter with revenue hitting **$59.9 billion** (+24% YoY) and EPS of **$8.88**, crushing the $8.23 estimate. * **Tesla** defied skeptics, jumping **3-4%**. Elon Musk’s EV maker posted Q4 revenue of **$24.9 billion** and EPS of **$0.50**, comfortably beating the $0.40 forecast despite broader auto sector headwinds. * **Microsoft** stumbled, falling **~7%**. Despite beating top-line estimates with **$81.3 billion** in revenue, investors punished the stock over decelerating growth in its Azure cloud division, signaling potential fatigue in the AI infrastructure trade. **Commodities & Crypto Surge** Safe-haven assets are rallying aggressively. **Gold** futures shattered records, climbing over **6%** to surpass **$5,300** per ounce. **Silver** staged a massive breakout, surging over **10%** to trade near **$117**. Energy markets remain firm, with **WTI Crude** up **1.5%** to **$63.35** per barrel. In the digital asset space, **Bitcoin** continues to hold high ground, trading steadily around **$89,400**. **Corporate Moves** Beyond earnings, **Amazon** announced a fresh round of cuts, eliminating **16,000** roles to streamline operations. Meanwhile, **UnitedHealth** led the Dow gainers (+4%), contrasting with **Amgen**, which slipped **2.6%**. **Summary of Key Levels** * **S&P 500:** ~6,971 * **Nasdaq:** ~23,806 * **Dow Jones:** ~49,042 * **10-Year Yield:** 4.25% * **Bitcoin:** ~$89,400 * **Gold:** ~$5,385

Oil Prices Rise for Third Day Amid Iran Tensions
**Market Brief: Oil Prices Surge on Geopolitical Risk** **Price Action** Oil markets have rallied for a third consecutive day, driven by intensifying geopolitical friction and tightening supply fundamentals. * **Brent Crude:** Climbed to **~$69.00** per barrel. * **WTI Crude:** Advanced to **$63.79**, reaching levels not seen since late September. **Geopolitical Drivers** Traders are pricing in a heightened risk premium following reports of a potential U.S. military strike on Iran. * **Tensions Escalating:** Speculation is mounting over U.S. strategic maneuvers, with a naval group arriving in the region and renewed "maximum pressure" rhetoric from Washington. * **Supply Concerns:** Market participants fear disruptions to regional output, particularly from Iran, which produces approximately **3.2 million barrels per day**. **Inventory & Supply Data** Fundamentals are tighter than expected, compounding the geopolitical rally. * **U.S. Stockpiles:** The Energy Information Administration (EIA) reported a surprise **draw of 2.3 million barrels**, defying analyst expectations for a build. * **Production Constraints:** Lingering effects from recent winter storms in the U.S. have also temporarily curbed domestic output, further squeezing short-term availability. **Analyst Outlook** Market watchers warn that continued escalation could sustain upward momentum. * **Risk Premium:** Citi analysts estimate the current geopolitical risk has added **$3–$4** per barrel to prices. * **Price Targets:** If tensions worsen, Brent is projected to test the **$72** threshold in the near term.

Titan Company Reports Six-Month Beta of 0.746
**Global Market Snapshot: Thursday, Jan 29, 2026** **US Markets & Fed Policy** Wall Street closed mixed Wednesday as the Federal Reserve held interest rates steady at **3.50%–3.75%**. Chairman Powell signaled no immediate rush to cut, citing resilient employment data. * **S&P 500:** Flat at 6,978. * **Nasdaq:** Up **0.3%** to 23,857. * **Dow Jones:** Flat at 49,015. **Tech Earnings Volatility** "Magnificent Seven" earnings are driving sharp divergence: * **Meta:** Surged **7%** post-market on strong revenue outlook. * **Microsoft:** Slid **7%** as rising AI infrastructure costs weighed on sentiment. * **Tesla:** Edged higher after beating earnings estimates. **Asian & Indian Markets** Asian equities are trading cautiously today (Thursday). The **Nikkei 225** and **Hang Seng** both dipped ~0.2% in early trade. * **India:** Nifty and Sensex opened **0.5% lower**, snapping a two-day rally. * **Key Driver:** Investors are bracing for the **Economic Survey 2025-26** (tabled today at 11:00 AM IST) and the upcoming Union Budget on Sunday, Feb 1. **Commodities: Gold & Oil Surge** Geopolitical tensions involving Iran and a softer US dollar have triggered a massive flight to safety. * **Gold:** Hitting historic highs, breaching **$5,300/oz** globally (approx. ₹1.67 Lakh/10g in India). * **Oil:** Brent Crude climbing toward **$69/barrel**; WTI near $64 amid fears of supply disruption in the Middle East. **Crypto & Currency** * **Bitcoin:** Holding steady around **$89,400** as the US administration pushes its "crypto capital" agenda. * **Currency:** The US Dollar Index (DXY) remains under pressure, hovering near four-year lows. **Events to Watch Today** * **India:** Economic Survey presentation. * **US:** Initial Jobless Claims data (8:30 AM ET).

RBI Debt Buying Lifts India Bonds After Sell-Off
**Market Brief: Indian Sovereign Bond Update** **Date:** January 28, 2026 **Bond Yields & Market Movement** Indian sovereign bonds are witnessing heightened volatility as the benchmark 10-year yield holds steady around **6.70%**, recently touching an 11-month high. Traders have pared back some bearish bets following the Reserve Bank of India’s strategic move to front-load liquidity operations. **Central Bank Action** The RBI has advanced its open market operations (OMO), targeting a **₹1 trillion** bond purchase program. The central bank rescheduled auctions to **January 29** and **February 5**, bringing them forward from original mid-February dates. This proactive step aims to infuse durable liquidity and stabilize yields amid tightening systemic cash conditions. **Supply & Borrowing Concerns** Despite central bank support, upside momentum in bond prices remains capped by heavy supply pressures. * **State Debt:** State government borrowings are surging, with gross issuances projected at **₹12.5 trillion** for the fiscal year, creating competition for investor capital. * **Fiscal Outlook:** Nervousness precedes the Union Budget 2026-27. Market participants are bracing for potentially elevated gross market borrowing targets, estimated between **₹16.3 trillion** and **₹28.9 trillion** (Centre + States) for FY27. **Key Drivers** * **Liquidity:** Banking system liquidity remains in deficit, necessitating the RBI's accelerated intervention. * **Global Cues:** Firming US Treasury yields continue to exert pressure on emerging market debt. * **Inflation:** Domestic inflation remains benign at approximately **1.3%–1.8%**, offering the RBI some policy headroom despite the currency seeing recent lows against the dollar.

Impact of Union Budget 2026 on Corporate Bond Yields and Investor Returns
**Market Brief: Fixed Income & Fiscal Outlook (Feb 2026)** **Union Budget 2026-27** is set for presentation on **February 1, 2026**, acting as a critical pivot for India’s bond markets. The fiscal roadmap will directly dictate borrowing pressure, yield curve trajectory, and liquidity dynamics for the coming fiscal year. **Fiscal Consolidation & Borrowing Targets** * **Deficit Projections:** Analysts peg the **FY27 fiscal deficit at 4.3% of GDP**, down marginally from the **4.4%** estimate for FY26. * **Borrowing Volume:** Gross market borrowing is projected to rise **15–16%** to approximately **₹16.9 lakh crore** in FY27, driven largely by higher redemptions. * **Risks:** While the government aims for consolidation, expenditure pressures on welfare and infrastructure could push the actual deficit closer to **4.6%**, potentially straining bond supply. **Bond Market Metrics (As of Jan 2026)** * **10-Year G-Sec Yields:** Currently trading in the **6.60% – 6.70%** range. Yields softened significantly throughout 2025, aided by **125 bps** in cumulative rate cuts. * **Near-Term Outlook:** Yields are expected to remain range-bound between **6.65% and 6.90%**, with upward pressure limited by central bank support and benign inflation (CPI forecast at **4.2%** for FY26). **Monetary Policy & Corporate Spreads** * **RBI Stance:** Markets have priced in a final **25 bps rate cut** in February 2026, potentially bringing the repo rate to **5.00%**. * **Corporate Bonds:** Spreads remain compressed. Yields on **AAA-rated corporate papers** fell by **~13 bps** in late 2025, outperforming G-Secs. This tight spread environment continues to favor issuers while offering stable, albeit lower, yields for platform-based investors. **Summary:** The overarching strategy remains focused on fiscal discipline despite rising redemption pressures. With the rate-cut cycle nearing its end and yields anchoring near **6.6%**, the environment favors stability for long-term debt investors.

Japanese Bonds Rally on Resilient 40-Year Auction Demand
**Market Brief: JGB Auction Relief & Yield Pullback** **Super-Long Sector Stabilizes** Japanese government bonds (JGBs) staged a relief rally today following a highly anticipated **40-year debt auction**. The sale attracted robust demand, calming investors after a period of historic volatility. * The **40-year yield** fell **3.5 basis points** to **3.90%**, retreating from a record high of **4.215%** touched just last week. * The bid-to-cover ratio—a key measure of demand—rose to **2.76**, significantly stronger than the previous **2.58**, signalling that investors see value at these elevated yield levels. **Broader Market Context** The successful auction alleviated immediate fears of a demand collapse, pulling the benchmark **10-year JGB yield** down to approximately **2.28%**. Despite the daily dip, yields remain near **27-year highs** (recently peaking around **2.38%**). The market has been under immense pressure due to concerns over aggressive fiscal expansion and rising sovereign debt levels. **Political Risk & Stimulus** Volatility is driven by the upcoming **February 8 snap election** and Prime Minister Sanae Takaichi’s pledge to cut taxes—specifically removing the consumption tax on food. * Markets worry these "debt-funded stimulus" measures could worsen Japan's fiscal health. * The Bank of Japan (BOJ) maintained its policy rate at **0.75%** in its January meeting, opting to wait out the political uncertainty before considering further hikes. **Outlook** While today's auction provided breathing room, strategists warn that volatility in the super-long sector will likely persist until the election concludes. Investors are now shifting focus to next week's **10-year** and **30-year** auctions to gauge if this appetite for Japanese debt is sustainable. *** **Next Step:**

Budget 2026: **Impact on Affordable Housing and Digital Real Estate**, According to Anuj Puri
**Market Brief: The Widening Rift in Indian Housing** **The K-Shaped Reality** As of January 2026, the Indian residential market presents a stark contradiction: soaring values amid shrinking volumes. While total sales value climbed **6–14%** in 2025 driven by premium inventory, actual unit sales contracted by **14%** year-on-year. The market has effectively decoupled—wealthy buyers are driving a luxury boom, while the middle class has been priced out. **Affordable Supply Collapse** The "affordable" segment (units priced under ₹40–45 Lakh) is in freefall. Once constituting over **50%** of the market in 2018, its share has plummeted to just **16–21%** as of late 2025. Developers have pivoted aggressively to high-margin luxury projects (>₹1.5 Cr), which now command nearly **38%** of new supply. This structural shift has left a massive void for entry-level homebuyers, with affordable segment sales dropping **17%** annually. **Price Shocks & EMI Burden** Property prices have surged despite falling transaction numbers. Pan-India prices rose **9%** year-on-year in Q3 2025, with specific markets like NCR witnessing a staggering **24%** jump. Combined with elevated interest rates, this has pushed EMI-to-income ratios in metros like Mumbai to unsustainable levels (approx. **48%**), forcing end-users to delay purchase decisions. **Critical Expectations: Budget 2026** With the Union Budget imminent (February 1), industry consensus demands immediate policy intervention to prevent a permanent lock-out of the middle class: * **Redefining Affordability:** The current price cap of **₹45 Lakh** for affordable housing benefits is obsolete. Stakeholders are urging an increase to **₹75–85 Lakh** for metros and **₹60–65 Lakh** for non-metros to reflect on-ground inflation. * **Tax Relief:** A primary demand is raising the Section 24(b) home loan interest deduction limit from the stagnated ₹2 Lakh to **₹5 Lakh** to offset surging EMIs. * **Supply Incentives:** Restoration of 100% tax holidays for affordable housing developers and deeper subsidies under PMAY 2.0 are viewed as essential to bring supply back to the sub-₹50 Lakh segment. **Market Outlook** Without these corrective measures, 2026 risks cementing a "luxury-only" market structure. The current inventory of approximately **5.6 lakh units** remains stable only because new launches have slowed, but the disconnect between income levels and property prices threatens the long-term health of the residential sector. [Real Estate 2026: Trouble Ahead Or Recovery Already Underway?](https://www.youtube.com/watch?v=EZmqUXVYypE) This video provides a detailed breakdown of the 2025-2026 real estate trends, explaining the disparity between the luxury boom and the affordability crisis discussed in the brief. http://googleusercontent.com/youtube_content/0

Gurmeet Chadha Advises Long-Term View Amid Emerging Cross-Segment Opportunities
**Market Brief: Volatility & Valuation Reset** **Date:** January 27, 2026 **The Big Picture** Indian equity markets are navigating a period of intense volatility and correction. While the **Sensex** managed a modest recovery to close near **81,664**, the broader sentiment remains cautious. The **Nifty 50** is trading under pressure, hovering near **3-month lows** around the **25,000** mark, weighed down by weak global cues and disappointing Q3 earnings from heavyweights like Reliance Industries and select IT majors. **Sector Split: Safety in Size?** A sharp divergence has emerged between large-caps and the broader market: * **Large-Caps:** Showing relative resilience. Investors are flocking to "blue-chip safety" amid global uncertainty. * **Mid & Small-Caps:** Witnessing a severe correction. The **Nifty Smallcap 100** has tanked approximately **7%** in January 2026 alone, while the **Midcap index** is down roughly **4%**. * **Valuations:** despite the fall, small-cap valuations hover around **25-26x** trailing earnings—still at a premium to long-term averages. **Key Triggers** * **Global Headwinds:** Escalating trade tensions, specifically renewed tariff threats from the US administration, have triggered a "risk-off" sentiment globally. * **FII Exodus:** Foreign Institutional Investors (FIIs) have been aggressive sellers, offloading over **₹32,000 crore** in the cash segment this month. * **Currency Pressure:** The Indian Rupee hit a record low, breaching the **91 per USD** mark, further impacting foreign investor confidence. **Expert Take: Focus on Fundamentals** Amidst the noise, market veteran **Gurmeet Chadha** (Complete Circle Consultants) advises against panic. * **Strategy:** Shift focus from "market capitalization" to "fundamental strength." * **Opportunity:** The correction is bringing quality stocks back to reasonable valuations. He points to banking majors (like HDFC Bank) and conglomerates trading at attractive forward multiples. * **Outlook:** Investors should adopt a **medium-to-long-term view** (3-5 years). The goal is to accumulate "compounding machines" rather than chasing quick multi-bagger gains in the current volatile environment. **Bottom Line** The market is currently punishing high-valuation stocks lacking earnings support. While the short-term trend is weak due to FII selling and global friction, the correction offers a gradual accumulation window for patient investors focusing on quality businesses. ... [Gurmeet Chadha market analysis](https://www.youtube.com/watch?v=Rdst1w2XhCo) ... The video provides specific insights from Gurmeet Chadha on navigating the current market volatility and identifying high-earning stocks. http://googleusercontent.com/youtube_content/0