Bearish News
Collection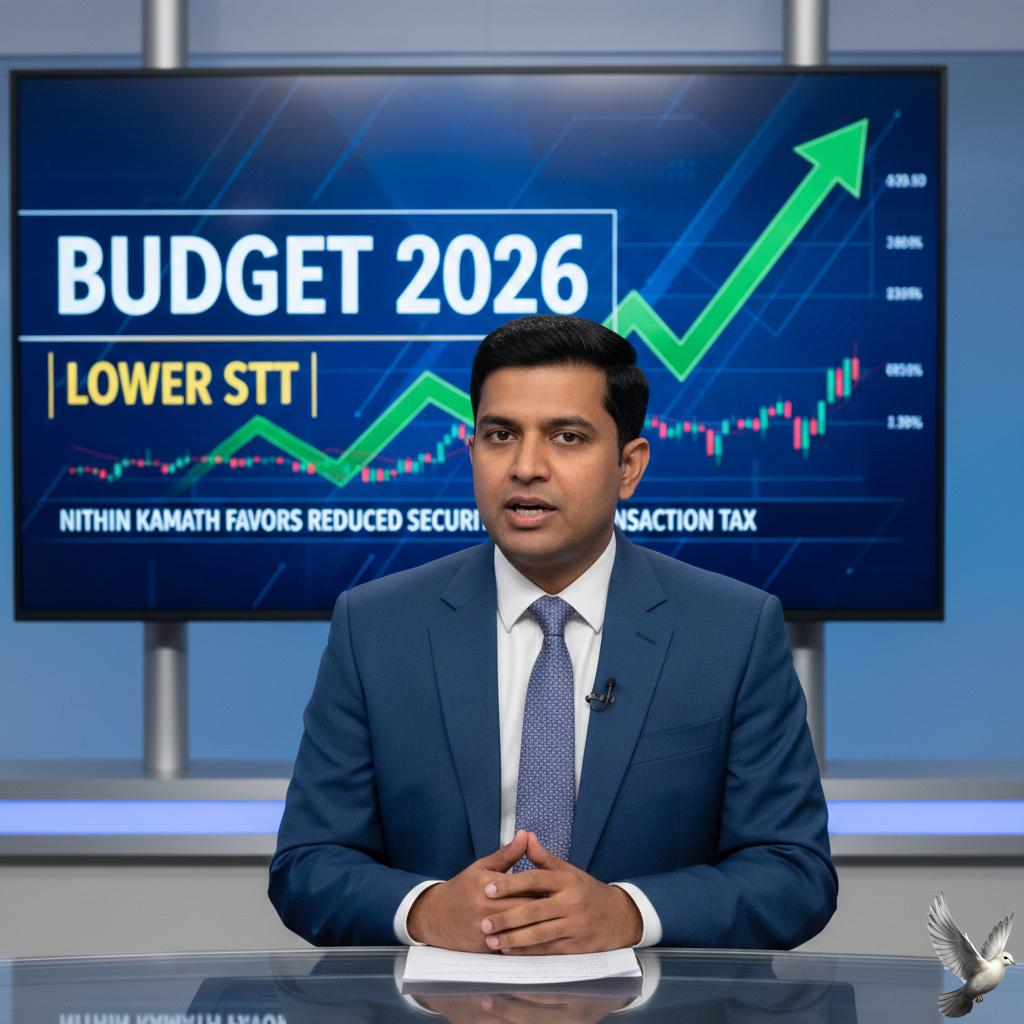
Nithin Kamath Favors Lower STT Ahead of Budget 2026
**Market Brief: STT Hikes & Revenue Shortfall (January 2026)** **Executive Summary** Zerodha co-founder Nithin Kamath has flagged a significant disconnect between government tax projections and actual market reality. His recent comments highlight that the steep Securities Transaction Tax (STT) hikes implemented in October 2024 are now visibly hurting both trading volumes and the government's own revenue targets. **The Trigger: October 2024 Tax Hike** The central government raised STT on futures from **0.0125%** to **0.02%** and on options from **0.0625%** to **0.1%**—an approximate **60%** increase. While the immediate impact was masked by a strong bull market in late 2024, the subsequent market cooling has exposed the structural damage to participation. **Impact on Volumes & Industry** Trading activity has contracted sharply as transaction costs heavily eat into trader margins. * **Volume Collapse:** Monthly options contracts plummeted from **397 million** in October 2024 to approximately **68 million** by early 2025. * **Brokerage Revenues:** Major discount brokers, including Zerodha, reported revenue drops of nearly **40%** for the quarter ending June 2025, marking a first-time "degrowth" in over a decade. * **Retail Exit:** High costs combined with regulatory tightening have forced a significant portion of retail liquidity out of the derivatives segment. **Revenue Reality Check (FY26)** Contrary to the government's expectation that higher rates would yield higher returns, collections are trailing estimates—a classic example of the Laffer curve effect. * **Target:** The Budget estimated FY26 STT collections at **₹78,000 crore**. * **Actuals:** Collections up to January 11, 2026, stand at roughly **₹45,000 crore**. * **Projected Shortfall:** Estimates suggest total FY26 receipts may reach only **₹57,000 crore**, a deficit of nearly **25%** against the target. **Market Sentiment** Kamath argues that the aggressive taxation has been counterproductive. By significantly raising the cost of entry and survival for traders, the tax base (turnover) has shrunk faster than the rate hike could compensate. With the Union Budget 2026 approaching, industry proponents are signaling that high transaction costs in a sideways market are unsustainable for liquidity, though expectations for an immediate rate reversal remain low.
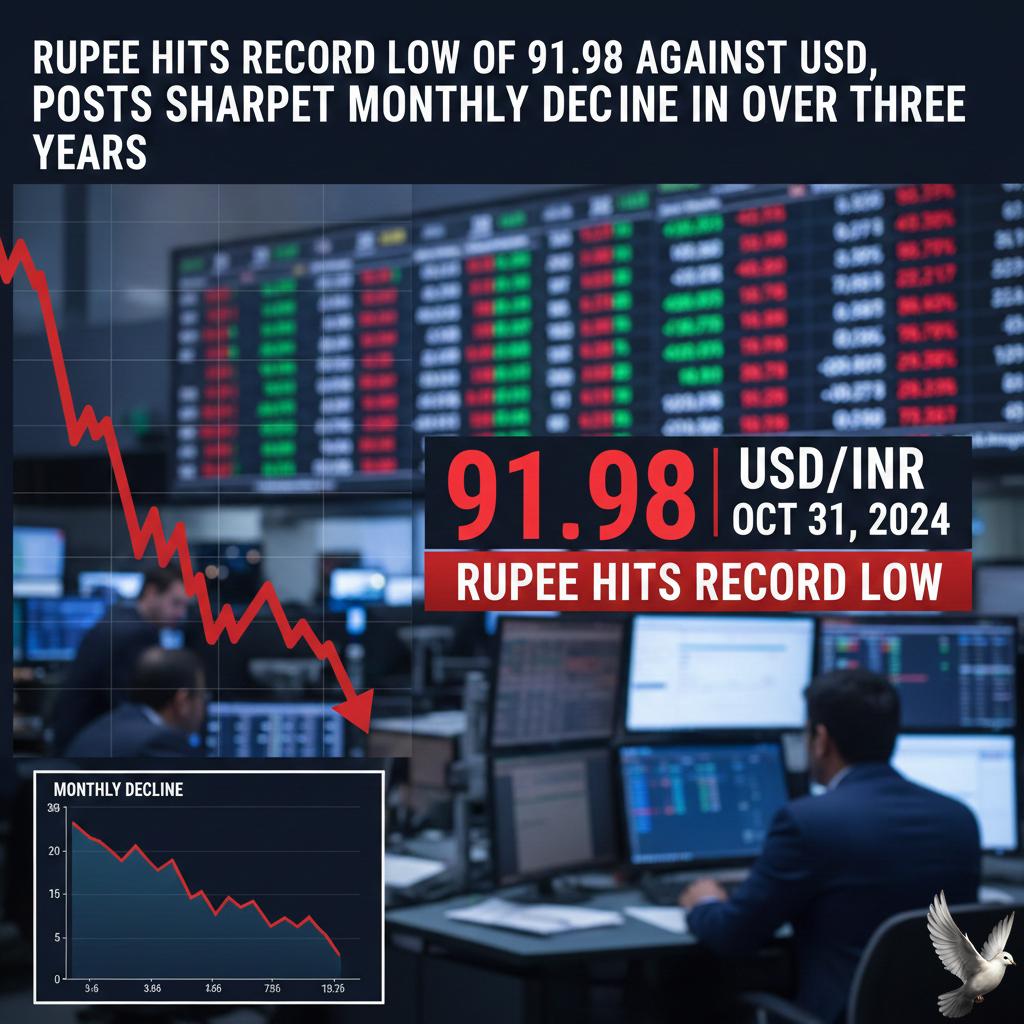
Rupee Hits Record Low of 91.98 Against USD, Posts Sharpest Monthly Decline in Over Three Years
**MARKET BRIEF: RUPEE AT HISTORIC LOW** **Currency Performance** The Indian rupee (INR) concluded January 2026 on a fragile note, hitting a historic low of **91.99** against the US dollar during Friday’s session. The local unit eventually settled at **91.98**, marking its worst monthly performance since **September 2022**. **Key Drivers** The depreciation was primarily fueled by relentless foreign capital outflows, with foreign investors selling approximately **$4 billion** in Indian equities throughout January. This selling pressure was compounded by strong month-end corporate demand for dollars and heightened global risk aversion, despite a recent dip in Brent crude oil prices to roughly **$69.62** per barrel. **Central Bank Action** The Reserve Bank of India (RBI) actively intervened in the foreign exchange market to prevent the currency from breaching the psychologically critical **92** mark. Dealers report that state-run banks were selling dollars likely on behalf of the central bank to curb volatility and cap the rupee's decline. **US Federal Reserve Update** In a significant global development, US President Donald Trump announced the nomination of **Kevin Warsh** as the next Chairman of the Federal Reserve on Friday, January 30. This follows the Federal Open Market Committee's (FOMC) decision earlier in the week to keep benchmark interest rates unchanged at **3.50–3.75%**. **Outlook: Union Budget** Market focus now shifts entirely to the Union Budget 2026-27, scheduled for presentation on **February 1**. Investors are awaiting fiscal signals that could influence capital flows and offer support to the domestic currency. ***
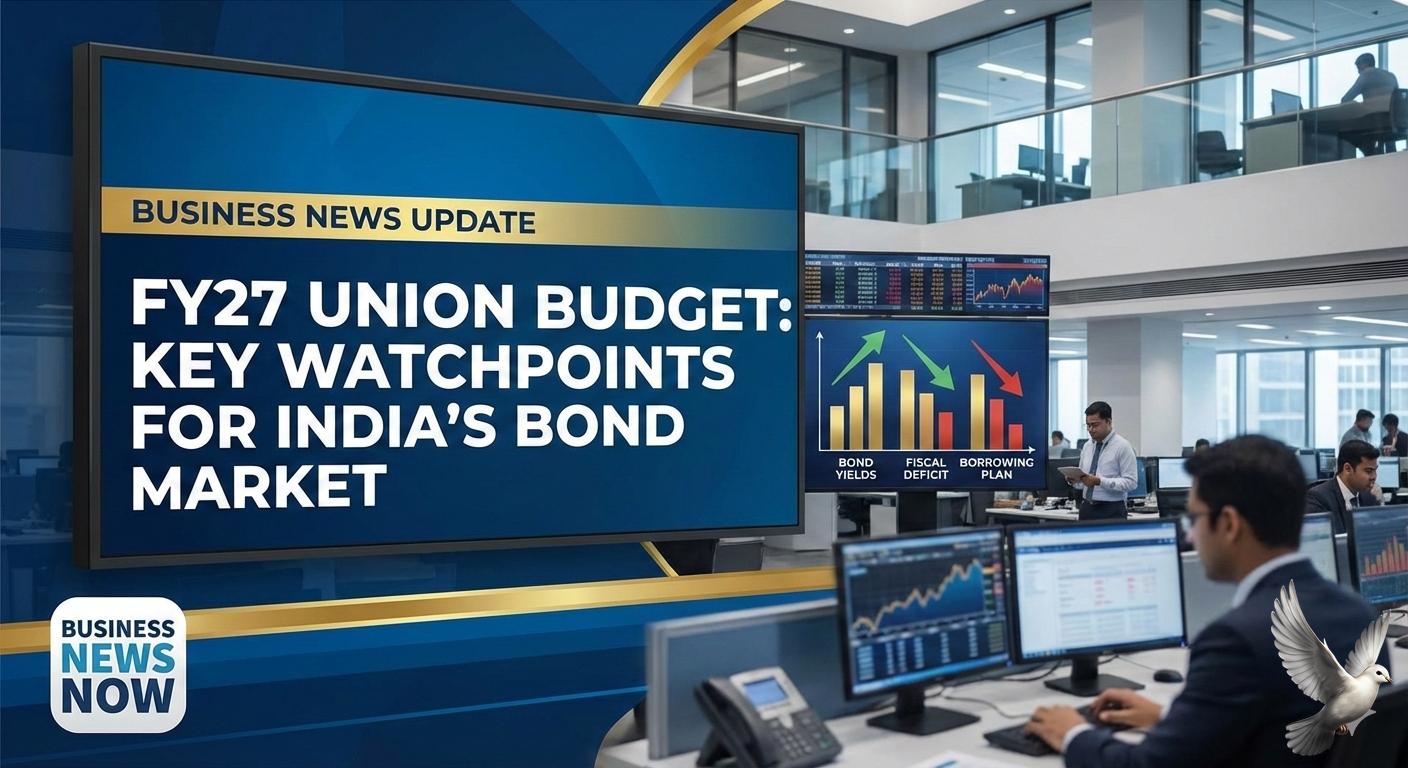
FY27 Union Budget: Key Watchpoints for India’s Bond Market
**Bond Market Brief: Pre-Budget FY27 Outlook** **Fiscal Consolidation & Deficit Targets** Markets are pricing in a credible fiscal glide path as the government targets a fiscal deficit of **4.2% of GDP** for FY27, down from the revised **4.4%** in FY26. This consolidation strategy aligns with the medium-term goal of reducing the debt-to-GDP ratio, reinforcing investor confidence in macro stability. **Borrowing Dynamics & Supply** Gross market borrowing for FY27 is estimated between **₹16.0 trillion and ₹17.5 trillion**, with net borrowing likely stabilizing around **₹11.6–11.8 trillion**. While headline gross numbers remain elevated due to redemption pressures, the stable net issuance suggests the supply shock may be manageable. State-level borrowings, however, add a layer of caution, keeping total public sector supply high. **Yield Trends & Market Sentiment** The benchmark 10-year G-Sec yield is currently trading near **6.70%**, reflecting recent pre-budget volatility and supply jitters. Despite short-term pressure, the consensus leans toward cautious optimism. Investors anticipate that a fiscally prudent budget—devoid of excessive populist spending—will cap yield spikes, keeping the 10-year range-bound post-announcement. **Key Monitoring Points** * **Capex Growth:** Expected moderation to **~10%** growth (vs. aggressive hikes in prior years) to balance fiscal math. * **Demand Anchors:** Continued support from long-term investors (insurance, pension funds) is critical to absorbing the heavy supply. * **Global Cues:** Currency volatility and global crude prices remain external risk factors influencing domestic yields.

Bullion ETFs Slide Following Vertical Run
**MARKET BRIEF: PRECIOUS METALS CRASH** **Date:** January 31, 2026 **EXECUTIVE SUMMARY** The blistering rally in precious metals has come to a violent halt. Following weeks of vertical gains, both gold and silver witnessed a massive selloff on Friday, January 30, triggered by profit-taking and major Federal Reserve news. **KEY DEVELOPMENTS** * **Historic Intraday Crash** Silver prices collapsed **~15-17%** in a single session—the worst daily decline since 2011. After hitting a record high near **$121 per ounce**, global spot prices plunged below the psychological **$100** mark. Gold followed suit, dropping **~5-7%** (its steepest fall since 2013) to trade near **$5,100-$5,300**, retreating from its peak of over **$5,600**. * **The "Warsh" Effect** The selloff accelerated after President Trump announced the nomination of **Kevin Warsh** as the next Federal Reserve Chair (replacing Jerome Powell in May). Markets reacted sharply to Warsh’s reputation as an "inflation hawk" and advocate for a smaller Fed balance sheet. This triggered a rapid rebound in the US Dollar, putting immediate pressure on dollar-denominated bullion. * **Extreme Profit Booking** The correction validates recent warnings that the market’s "near-vertical rise" was unsustainable. Before the crash, silver had surged nearly **60-70%** in January alone. Investors moved aggressively to book profits after one of the strongest monthly performances in decades. **DOMESTIC IMPACT (INDIA)** * **MCX Carnage:** Domestic futures mirrored global chaos. Silver crashed by approx. **₹68,000 per kg** in a single day, falling from a peak of **₹4.20 lakh** to below **₹3.35 lakh**. * **Gold Slide:** Gold prices corrected sharply, shedding roughly **₹11,000–₹20,000 per 10g** from record highs. **MARKET OUTLOOK** While the long-term bullish drivers (geopolitical tension, debt concerns) remain, the immediate "euphoria" phase has broken. Volatility is expected to remain extreme as the market digests the new Fed leadership path and unwinds over-leveraged long positions. **Next:** If you are holding positions, check your stop-losses immediately; would you like me to analyze the technical support levels for Silver following this drop?
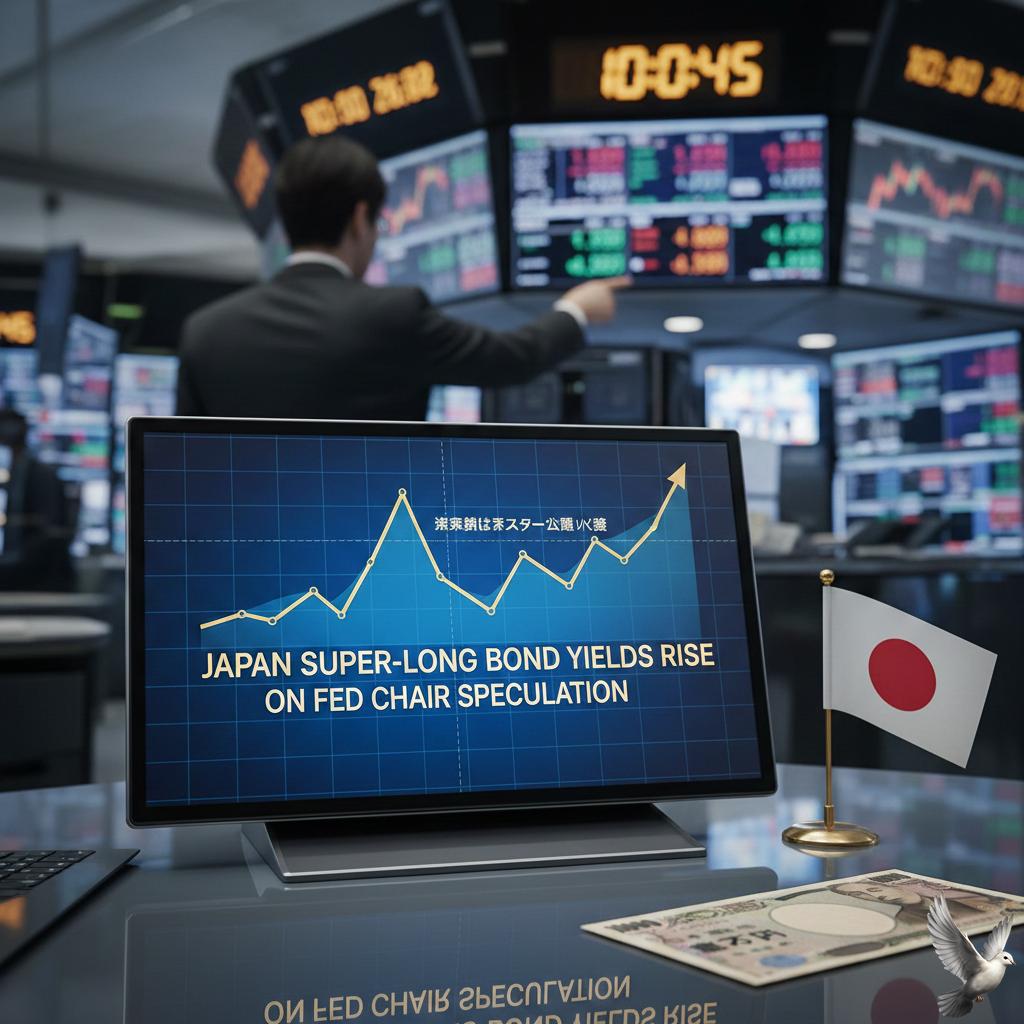
Japan Super-Long Bond Yields Rise on Fed Chair Speculation
Market Brief: JGBs & US Fed Outlook **Date:** Saturday, January 31, 2026 **Executive Summary** Japanese government bond (JGB) yields diverged on Friday, with super-long maturities climbing sharply. The move was driven by the convergence of domestic fiscal anxieties and the now-confirmed reports that **President Donald Trump** has selected **Kevin Warsh** as the next Federal Reserve Chair. While the 10-year benchmark saw a reprieve, the longer end of the curve repriced the risk of a hawkish shift in US monetary policy. **Key Market Movements (Jan 30 Close)** * **20-Year JGB Yield:** Rose to **3.18%** (up ~1.2 bps), reflecting heightened sensitivity to global rate expectations. * **10-Year JGB Yield:** Dipped slightly to **2.25%** (-0.7 bps) as investors covered short positions after the yield recently breached the **2.33%** level earlier this year. * **30-Year JGB Yield:** Climbed to **3.64%**, nearing multi-decade highs. * **USD/JPY:** Trading around **154.57**, with the yen remaining under pressure despite recent stabilization efforts. **Drivers & Analysis** * **US Fed Nomination:** Speculation solidified into news on Friday that **Kevin Warsh** is Trump's pick to succeed Jerome Powell in **May 2026**. Markets perceive Warsh as a potential disruptor who may favor a stricter monetary regime, sparking a sell-off in long-duration global assets, including Japanese super-longs. * **Domestic Fiscal Fears:** The JGB market remains fragile due to Prime Minister **Sanae Takaichi’s** expansionary fiscal pledges. With Japan's inflation holding above **3.0%** and the Bank of Japan’s policy rate now at **0.75%**, investors are demanding higher premiums for holding long-term government debt. * **Curve Steeper:** The divergence—shorter yields holding steady while super-longs rise—indicates a steepening yield curve. Investors are sheltering in shorter maturities (2-year yields at **1.25%**) while dumping longer-dated bonds vulnerable to inflation and aggressive US policy shifts. **Outlook** Market volatility is expected to persist as the Senate confirmation process for Warsh begins and Japan approaches its snap election on **February 8**. Traders will be closely watching for any coordinated "rate checks" by the Ministry of Finance if the yen weakens further past the **155** handle.
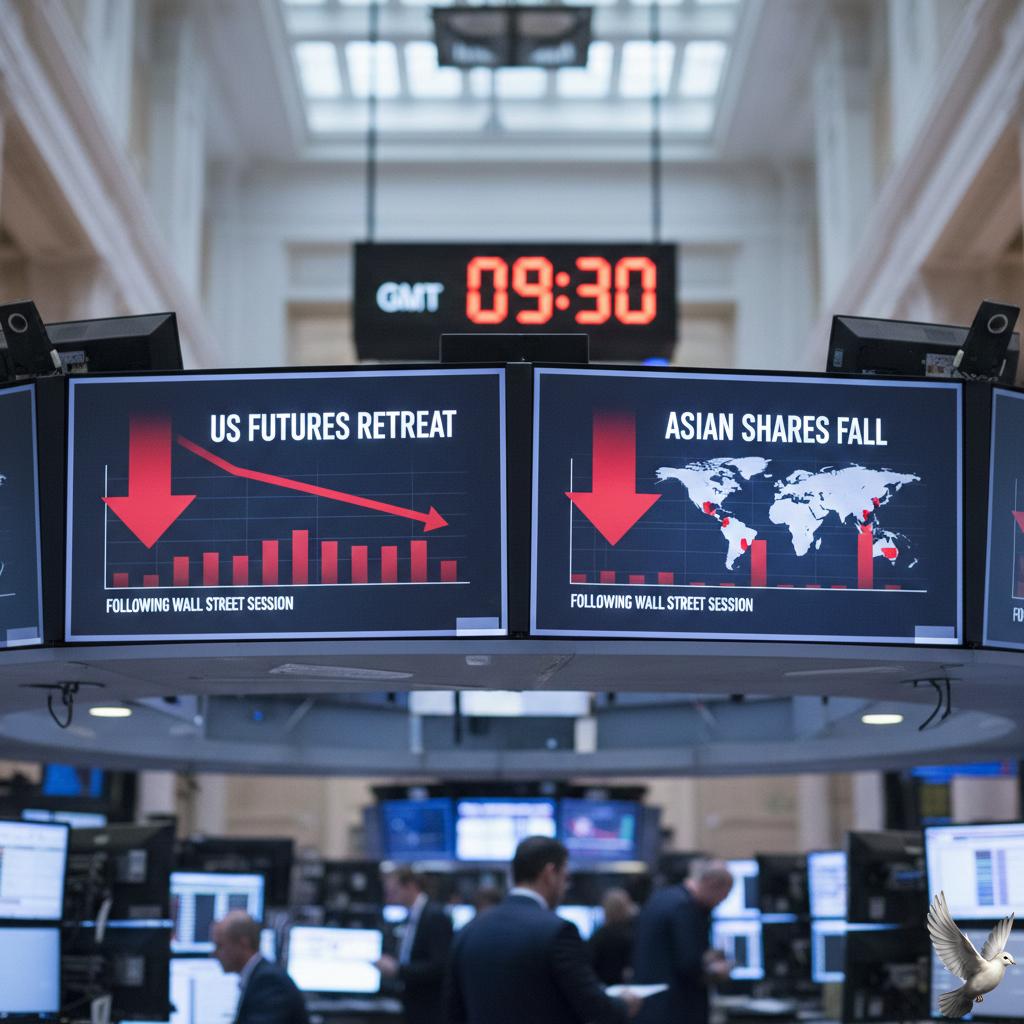
US Futures and Asian Shares Retreat Following Wall Street Session
**Global Market Brief: Volatility Sweeps Asia & US** **Asian Markets Slide on Global Cues** Asian equities closed lower Friday, January 30, directly tracking a volatile session on Wall Street. Regional sentiment was battered by a sharp sell-off in technology stocks and renewed geopolitical anxieties. Chinese indices dropped between **0.85%** and **1.40%**, while Australia’s market shed **1.1%**. Japan’s Nikkei traded flat, struggling to find direction amidst the broader risk-off mood. **Tech Sector Hit by Microsoft Plunge** The downturn was triggered by a massive slump in Microsoft shares, which plummeted roughly **10-12%** despite beating earnings expectations. Investors reacted negatively to the company's record capital expenditure of **$37.5 billion**, fueling fears that AI infrastructure costs are outpacing near-term returns. This sentiment dragged down the broader tech sector, heavily influencing Asian supply chain partners. **Commodities Retreat** Safe-haven assets and energy markets faced significant pressure. * **Gold** suffered a sharp correction, falling nearly **4-5%** to trade around **$5,100–$5,300** per ounce as profit-taking set in and the US dollar strengthened. * **Oil** prices dipped approximately **2%**, weighed down by reduced risk appetite and mixed global demand signals. **Indonesia Market Rout & Leadership Exit** The Indonesian Stock Exchange (IDX) took center stage in regional turmoil. The exchange's CEO, Iman Rachman, resigned Friday following a devastating **$80 billion** loss in market value over two days. The rout was sparked by fears of an MSCI downgrade to "frontier" status, amplifying investor concerns regarding governance and market transparency. **Trade Tensions Fuel Uncertainty** Global jitters were further stoked by escalating trade friction. The US administration recently hiked tariffs on South Korean goods to **25%**, citing delayed trade deal ratifications. Simultaneously, reports of a "historic trade surplus" for China have renewed friction with Western partners, keeping investors on high alert for further protectionist measures.

Bitcoin Falls Below $82,000 to Two-Month Low Amid Fed Chair Speculation
**Market Brief: Crypto Liquidation Flush & Macro Reset** **Bitcoin & Broad Market** Bitcoin plunged to a **two-month low**, briefly touching **$81,000** today (Jan 30, 2026). The sharp sell-off was driven by a "mechanical breakdown" in market structure, exacerbated by escalating US-EU trade tariff threats and a risk-off shift in US equities. * **Sentiment:** The Crypto Fear & Greed Index plummeted to **16** (Extreme Fear). * **Liquidations:** Over **$1.68 billion** in leveraged positions were wiped out in 24 hours. * **Long Squeeze:** **93%** of liquidations were long positions, with Bitcoin alone accounting for nearly **$780 million** and Ethereum losing over **$400 million**. **Macro Triggers** The crash correlates with broader macro anxiety. Renewed geopolitical posturing and tariff risks from the US administration pushed global markets into defensive modes. Institutional exposure was cut rapidly, removing critical liquidity during the dip. **Outlier: Hyperliquid (HYPE)** Bucking the bearish trend, **Hyperliquid** demonstrated significant resilience. The platform saw a surge in activity driven by non-crypto perpetuals (Silver and Gold), causing the **HYPE** token to outperform the broader market correction. Analysts credit this decoupling to the platform's utility in commodities trading and reduced team token unlocks. **Outlook** Market structure has reset. Support at **$84,000** failed to hold, and traders are now eyeing the **$75,000–$78,000** zone for potential stabilization. A recovery depends heavily on the cooling of macro trade tensions and the holding of these lower support levels.

Indian Bonds Decline on Supply Concerns Ahead of Federal Budget
**Market Brief: Indian Sovereign Bond Update** **Current Status** Indian sovereign bonds ended the week under continued pressure, with the benchmark 10-year yield hardening to **6.72%** as of Friday, January 30. The market remains nervous ahead of the Union Budget on February 1, driven by fears of a record government borrowing program for the next fiscal year. **Supply Side Pressures** Sentiment has weakened due to a supply glut. State governments raised nearly **₹39,800 crore** in bond sales this week, reinforcing concerns that debt issuance is outpacing demand. Traders are bracing for the federal budget announcement, where gross borrowing for FY27 is projected to hit a record **₹16–17.5 trillion**. This heavy supply pipeline is the primary weight on bond prices right now. **RBI Intervention** To counter the spike in yields and alleviate tight liquidity, the Reserve Bank of India has actively stepped in. The central bank advanced its Open Market Operations (OMO), committing to bond repurchases and announcing a **$10 billion** forex swap to inject durable liquidity. Despite these support measures, the "supply fear" narrative continues to dominate trading desks. **Global Headwinds** External factors are adding to the bearish tone. U.S. Treasury yields have ticked up, with the 10-year note trading around **4.26%**, influenced by speculation regarding future Federal Reserve leadership. This rise in global rates is reducing the appetite for emerging market debt and keeping the Indian rupee under pressure near the **92** per dollar mark. **Week Ahead** Volatility is expected to remain high. Market focus is entirely locked on two critical events: the fiscal mathematics in Sunday's Budget and the RBI Monetary Policy Committee meeting scheduled for **February 4–6**. While a recent rate cut to **5.25%** provided some relief, investors are now waiting to see if the central bank will pause or continue easing in the face of these fiscal challenges. *** To help you visualize the current technical setup before the Budget, I can generate a chart showing the 10-year yield's resistance levels over the last month.

Jefferies' Chris Wood Reduces India Weightage in Portfolio
**Market Brief: Jefferies Cuts India Weight Amid North Asian AI Rally** **Strategy Update** Jefferies strategist Christopher Wood has further trimmed India’s exposure in his Asia Pacific ex-Japan portfolio. The move reflects a tactical pivot as global capital aggressively chases the "AI picks and shovels" trade, favoring semiconductor-heavy markets in North Asia over India’s consumption-driven economy. **Key Portfolio Changes** * **India:** Recommended weight cut by **2 percentage points** to **15%**. * **China:** Reduced by **1 percentage point**. * **South Korea:** Raised by **2 percentage points** to **15%**. * **Taiwan:** Increased by **1 percentage point** to **16%**. **The AI Squeeze** The relentless rally in tech stocks has skewed the MSCI Emerging Markets (EM) index. As semiconductor giants surge, the combined benchmark weight of Taiwan (**21.3%**) and Korea (**15.4%**) has expanded significantly. Consequently, India’s weight in the index has compressed to **13.1%** — its lowest level since March 2023. **Capital Flow Reversal** The shift is not just theoretical. Recent data signals a rotation of funds, with Foreign Portfolio Investors (FPIs) pulling approximately **$3.9 billion** from Indian equities by December 2025. These outflows are largely being redirected toward AI-centric markets in the U.S., Taiwan, and South Korea, leaving India underperforming its regional peers despite strong domestic GDP projections of **7–8%** for FY26. **Strategic Outlook** Wood characterizes the current environment as "AI fever" but maintains a structural overweight stance on India (relative to a benchmark of 13.2%). He notes that while the AI trade is currently dominant, a future unwind of this "overinvestment" could act as the catalyst for funds to rotate back into Indian markets. [Jefferies' Chris Wood decodes Rupee fall](https://www.youtube.com/watch?v=ec1MDiRO2E4) This video provides additional context on Christopher Wood's broader views on the Indian market and currency, helping to explain the macroeconomic factors influencing his recent portfolio adjustments. http://googleusercontent.com/youtube_content/0
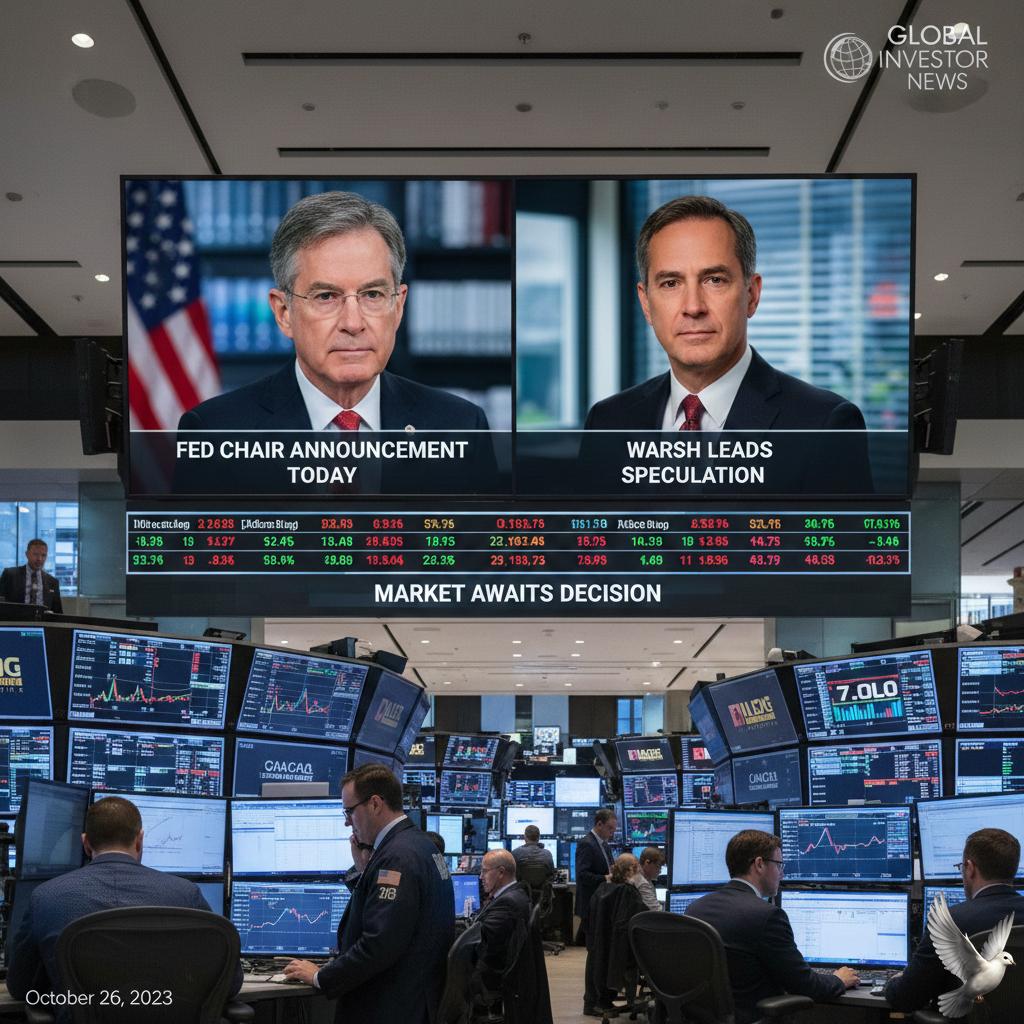
Fed Chair Pick Announcement Expected Today; Warsh Leads Speculation
**Market Brief: Trump Taps Kevin Warsh for Fed Chair** **The Headline** President Donald Trump has moved to nominate **Kevin Warsh** as the next Chairman of the Federal Reserve, cementing a pivot in U.S. monetary leadership. The announcement, confirmed by multiple sources on **Friday, January 30, 2026**, ends months of speculation and signals a potential regime change at the central bank. **Market Reaction: Immediate Volatility** Markets wobbled instantly as traders digested the news, balancing Warsh’s pro-growth rhetoric against his history of hawkish discipline. * **Equities:** S&P 500 and Nasdaq futures slid approximately **0.4%** to **0.5%**, extending losses driven by a broader tech slump (led by Microsoft). * **Bond Yields:** The 10-year Treasury yield climbed roughly **5 basis points** to trade around **4.27%**. Investors are pricing in the risk that Warsh’s preference for a "smaller balance sheet" could tighten liquidity, even if official rates fall. * **Currency:** The U.S. Dollar Index (DXY) strengthened **0.3%** to nearly **96.5**, reversing recent weakness. * **Commodities & Crypto:** Gold plunged **3%**, and Bitcoin fell **2%**, reacting to the stronger dollar and the prospect of tighter real monetary conditions. **The Strategy: "Lower Rates, Smaller Balance Sheet"** Warsh, a former Fed Governor (2006–2011), is viewed as a hybrid pick. While he aligns with President Trump’s demand for **interest rate cuts**, he simultaneously advocates for aggressively shrinking the Fed’s bloated balance sheet. This dual stance—easing rates while tightening money supply—is creating a complex outlook for risk assets. The market views him as less of a "safe dove" than other contenders, fearing that his focus on financial discipline could cap the upside for speculative assets. **What to Watch** * **Senate Confirmation:** Warsh is expected to face scrutiny but ultimately pass; however, any delay could spike volatility. * **Powell’s Exit:** Current Chair Jerome Powell’s term ends in May, but attention now shifts to whether he will resign early or stay on the Board of Governors until 2028, potentially complicating Warsh’s influence. ... [Analysis of Kevin Warsh's potential impact on the Fed](https://www.youtube.com/watch?v=D4roSFzE3Ww) ... This video provides a recent breakdown (Jan 2026) of what Kevin Warsh's leadership would specifically mean for market volatility and Fed policy tools. http://googleusercontent.com/youtube_content/0
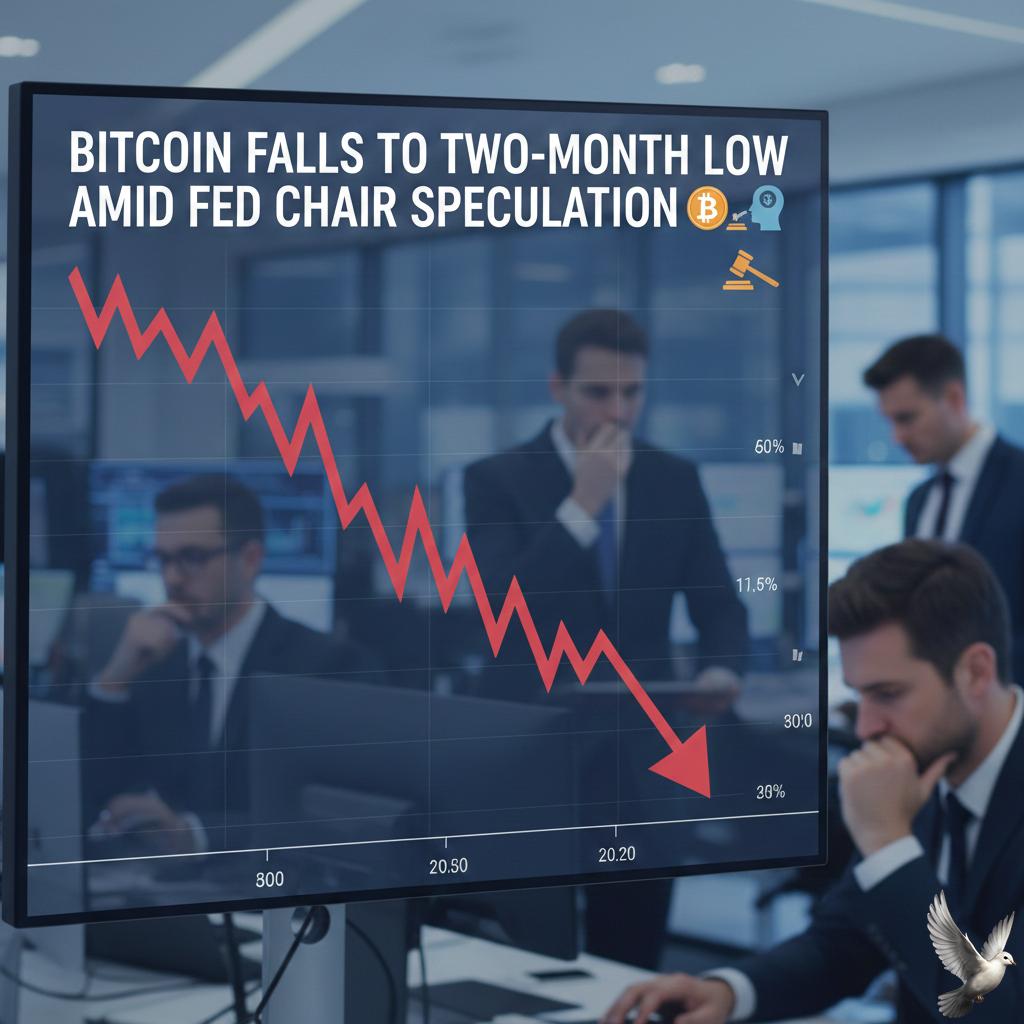
Bitcoin Falls to Two-Month Low Amid Fed Chair Speculation
**Market Brief: Crypto Liquidity Crunch & Tech Correction** **Friday, January 30, 2026** Bitcoin has extended its steep decline, plummeting to a two-month low of **$81,311** in early trading. The leading cryptocurrency has now shed approximately **30%** of its value since hitting record highs in October 2025. **Market Drivers** * **Fed Chair Anxiety:** Risk assets are reeling from intensifying speculation that President Trump will nominate **Kevin Warsh** as the next Federal Reserve Chair. Markets are pricing in Warsh as a hawkish pick, sparking fears of tighter monetary policy, reduced balance sheets, and a liquidity drain that traditionally punishes speculative assets. * **AI Sector Tremors:** A broader "risk-off" wave is being fueled by a tech equity selloff. High-profile jitters around Artificial Intelligence spending—highlighted by **Microsoft's** massive market cap loss and a **2.5%** intraday drop in the Nasdaq—are spilling over into digital markets. Investors are questioning the sustainability of the AI boom, deepening the correlation between tech stocks and crypto. **Key Figures** * **Bitcoin (BTC):** Trading near **$82,100**, down roughly **6%** in the last 24 hours. * **Ethereum (ETH):** Slid sharply to **$2,730**, recording a nearly **7%** daily loss. * **Liquidations:** The volatility triggered a massive flush-out, with over **$1.7 billion** in leveraged positions liquidated across the board. * **Sentiment:** The Crypto Fear & Greed Index has collapsed to **16**, signaling "Extreme Fear" among traders. **Outlook** Volatility remains elevated as **$8.8 billion** in monthly options expire today. Traders are actively deleveraging, moving to the sidelines while awaiting official confirmation on the Fed leadership and stabilization in the tech sector.
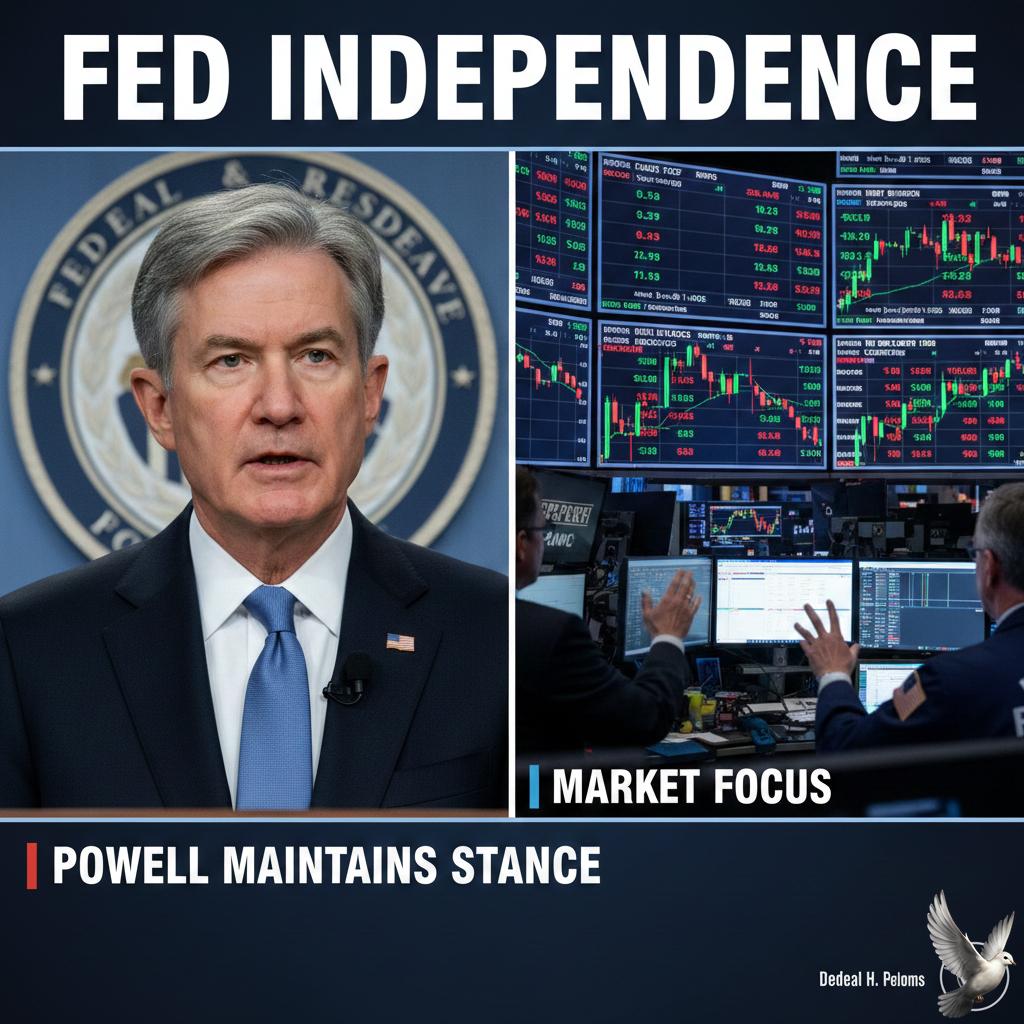
Powell Maintains Stance Amid Market Focus on Fed Independence
The Federal Reserve's most recent policy meeting has amplified market fears regarding the central bank's strained independence, set against the immediate backdrop of a looming leadership change. Fed Chair Jerome Powell, whose term as chair concludes in **May 2026**, defiantly held the line against unprecedented White House interference following the FOMC meeting this week. The committee voted to hold the benchmark Federal Funds Rate steady in the range of **3.5% to 3.75%**, pausing a rate-cutting cycle that began late last year. This decision was made despite relentless political pressure demanding further rate cuts, leading President Donald Trump to renew his verbal attacks on Powell. *** The political tensions are peaking as President Trump prepares to announce his nominee for the next Fed Chair as early as next week. The market views this nomination process as a critical test of future monetary policy autonomy. The key concern is the selection of a candidate inclined toward aggressive, politically motivated easing. Leading contenders include former Fed Governor **Kevin Warsh**, viewed by some as potentially more hawkish, and current Governor **Christopher Waller**, who along with one other member, dissented at the recent meeting, favoring an immediate **25 basis point** rate cut. The outgoing Chair warned the independence of the Fed is paramount, cautioning that policy must be set by economic evidence, not political preference, a crucial statement underscored by the President's personal attacks and the shadow of an ongoing criminal investigation related to the central bank's operations. *** The fixed income market is reacting to this uncertainty with increased caution. The yield on the benchmark **10-Year US Treasury Note** has risen significantly, recently trading around **4.27%**. This upward trend pushes yields near a five-month high, fueled by speculation that the next chair might pursue policies that exacerbate fiscal risks, or by broader concerns over the US government’s growing deficit. However, a key measure of bond market volatility, the MOVE Index, suggests that while nervous, the fixed income sector is **not** yet signalling a full-blown crisis of confidence in the Fed's long-term institutional structure. *** Currency markets show distinct pressure. The **US Dollar Index (DXY)** has weakened, trading recently around **96.14**, near multi-month lows. This softening reflects market expectations that, regardless of the current pause, the Fed's easing cycle will resume in 2026. Policy divergence, with other central banks remaining comparatively tighter, is capping the dollar's ability to sustain any meaningful rally. Meanwhile, the equity market performance remains mixed, navigating corporate earnings results and policy uncertainty. The **S&P 500 Index** closed near **6,969.01** this week. The index absorbed a sharp drop in key technology stocks due to investor fears over heavy capital expenditure for artificial intelligence and slightly disappointing growth forecasts. *** Underneath the market volatility, the economic picture is complicated. Inflation continues to moderate, with the December Consumer Price Index (CPI) showing a year-over-year increase of **2.7%**, edging closer to the Fed's **2%** target. The labor market remains resilient, yet the Federal Reserve emphasized that the current rate range of **3.5% to 3.75%** is not perceived as significantly restrictive given the solid underlying economic activity. This suggests the central bank is positioned to wait for more conclusive data before committing to the next policy step, a posture likely to be severely tested once a new political appointee is confirmed.

UltraTech Cement Share Price and Performance Overview
Market Brief: Global & Domestic Overview — January 30, 2026 **Global Equities: Tech Earnings Drive Divergence** Global markets are closing the week on a mixed note as investors digest a volatile corporate earnings season and prepare for major fiscal updates. In the United States, the S&P 500 hovered near **6,978**, while the Dow Jones Industrial Average held steady around **49,015**. The tech-heavy Nasdaq Composite traded near **23,857**, reflecting a sharp divergence in major technology stocks. Microsoft shares faced significant pressure, dropping approximately **10%** despite beating revenue estimates, as concerns over slowing cloud growth weighed on sentiment. In contrast, Meta Platforms surged **10%** following strong quarterly results, highlighting the uneven impact of AI monetization strategies across the "Magnificent Seven." Tesla also struggled, dipping more than **3%**, while software stocks like Salesforce and Adobe saw corrections between **2%** and **6%**. **Asian & Indian Markets: Pre-Budget Nerves** In Asia, Indian equity benchmarks witnessed a sharp bout of profit-taking ahead of the Union Budget scheduled for this Sunday. The Nifty 50 slipped below the **25,300** mark, trading around **25,275**, down nearly **0.6%**. The Sensex shed over **400 points** to trade near **82,145**. Investors in the region are turning defensive, with significant selling observed in metal and banking sectors. Heavyweights like Vedanta and Hindalco dropped between **4%** and **5%**, while banking majors like HDFC Bank and ICICI Bank traded flat to negative. Conversely, select FMCG stocks like Britannia and Nestle provided some cushion, rising approximately **2%**. **Commodities: Gold Volatility & Oil Prices** The commodities market is witnessing heightened volatility. Gold, recently a preferred safe-haven asset reaching highs near **$5,600**, experienced a sharp correction. Prices dipped significantly, with some indices showing a decline of nearly **4%** to **10%** depending on the contract, trading around the **$5,200** to **$5,400** per ounce range. Silver followed suit, dropping nearly **4%** to trade near **$110**. Oil prices remained relatively soft but volatile. WTI Crude traded around **$64.30** per barrel, while Brent Crude hovered near **$70.70**. Market participants are closely watching geopolitical developments, particularly tensions involving Iran, which continue to underpin a risk premium despite demand-side concerns. **Cryptocurrency: Bitcoin Under Pressure** The cryptocurrency market is struggling to regain momentum. Bitcoin (BTC) has failed to hold the critical **$88,000** level, currently trading under pressure as institutional outflows from ETFs intensify. The digital asset has shed roughly **30%** of its value since its October peaks, with investors seemingly shifting preference back toward traditional safe havens or cash amid the high-interest-rate environment. **Economic Outlook & Policy** On the macro front, the Federal Reserve has maintained interest rates in the **3.00%** to **3.75%** range, citing "elevated" economic uncertainty. Inflation remains a key watchpoint, with recent data showing US inflation around **2.7%**. The dollar index (DXY) has strengthened slightly to **96.55**, putting pressure on emerging market currencies. Looking ahead, the immediate focus shifts to the Indian Union Budget on Sunday, which is expected to drive near-term sentiment in South Asian markets, while global investors await further clarity on US trade policies and the next Federal Reserve Chair announcement.
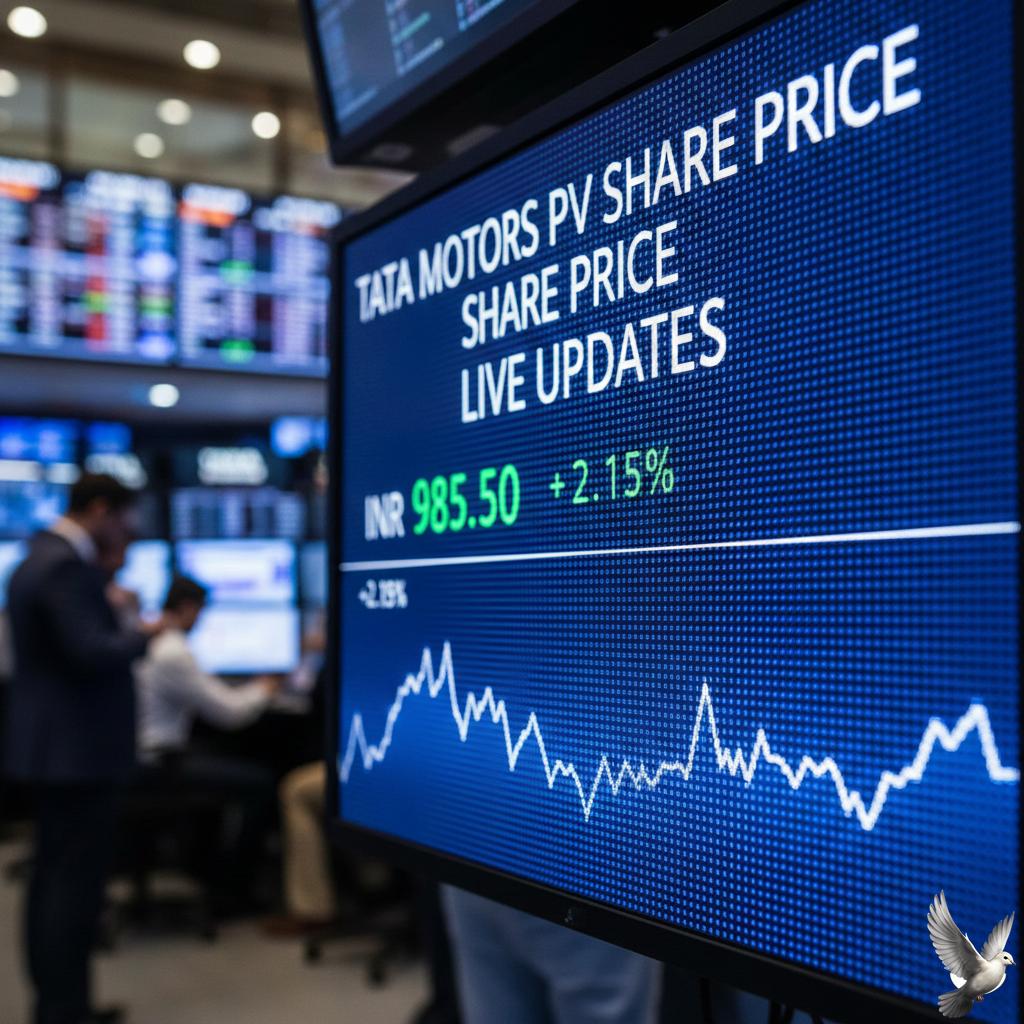
Tata Motors PV Share Price: Live Updates
**Global Market Brief: January 30, 2026** **Equities: Tech Volatility & Healthcare Sell-Off** Global stock markets are ending the week on uncertain footing as investors digest mixed corporate earnings and rising geopolitical tensions. In the US, the **Dow Jones Industrial Average** slipped toward **49,000**, dragged down by a sharp decline in the healthcare sector. Major insurers like **UnitedHealth** and **CVS** plummeted following disappointing Medicare Advantage payment proposals. The **S&P 500** hovers near **6,970**, struggling for direction, while the **Nasdaq Composite** shows resilience around **23,700**. Tech performance remains deeply divided: **Meta** shares rallied on strong earnings, acting as a counterweight to **Microsoft**, which tumbled **10%** amid concerns over massive AI capital rapid spending. In Asia and Europe, sentiment is cautious. Japan’s **Nikkei 225** managed a slight gain to **53,400**, supported by a weaker yen, while the **Hang Seng Index** in Hong Kong dropped nearly **2%** to **27,400**. Germany’s **DAX** also faced pressure, falling over **2%** to trade near **24,300**. **Commodities: Safe-Haven Rush** Geopolitical risks are driving a historic rally in precious metals. **Gold** prices have surged past **$5,500** per ounce, hitting fresh record highs as traders hedge against escalating tensions between the US and Iran. **Silver** followed suit, breaking above **$116** per ounce. Oil markets are reacting to the same geopolitical triggers. **WTI Crude** jumped to the **$65–$70** range after threats of military action in the Middle East raised fears of supply disruptions. **Crypto: Bitcoin Retracts** Digital assets are decoupling from the safe-haven rally seen in gold. **Bitcoin** faced heavy selling pressure, dropping over **5%** to trade around **$84,400**. The broader crypto market is seeing liquidations as investors rotate capital into traditional defensive assets, pushing the total crypto market cap down to **$1.68 trillion**. **Economic Outlook** The Federal Reserve’s recent policy stance remains a "non-event" for markets, shifting the focus entirely to earnings execution and geopolitical developments. Investors are closely monitoring the geopolitical situation in the Middle East, which has become the primary driver for energy and precious metal prices this week.
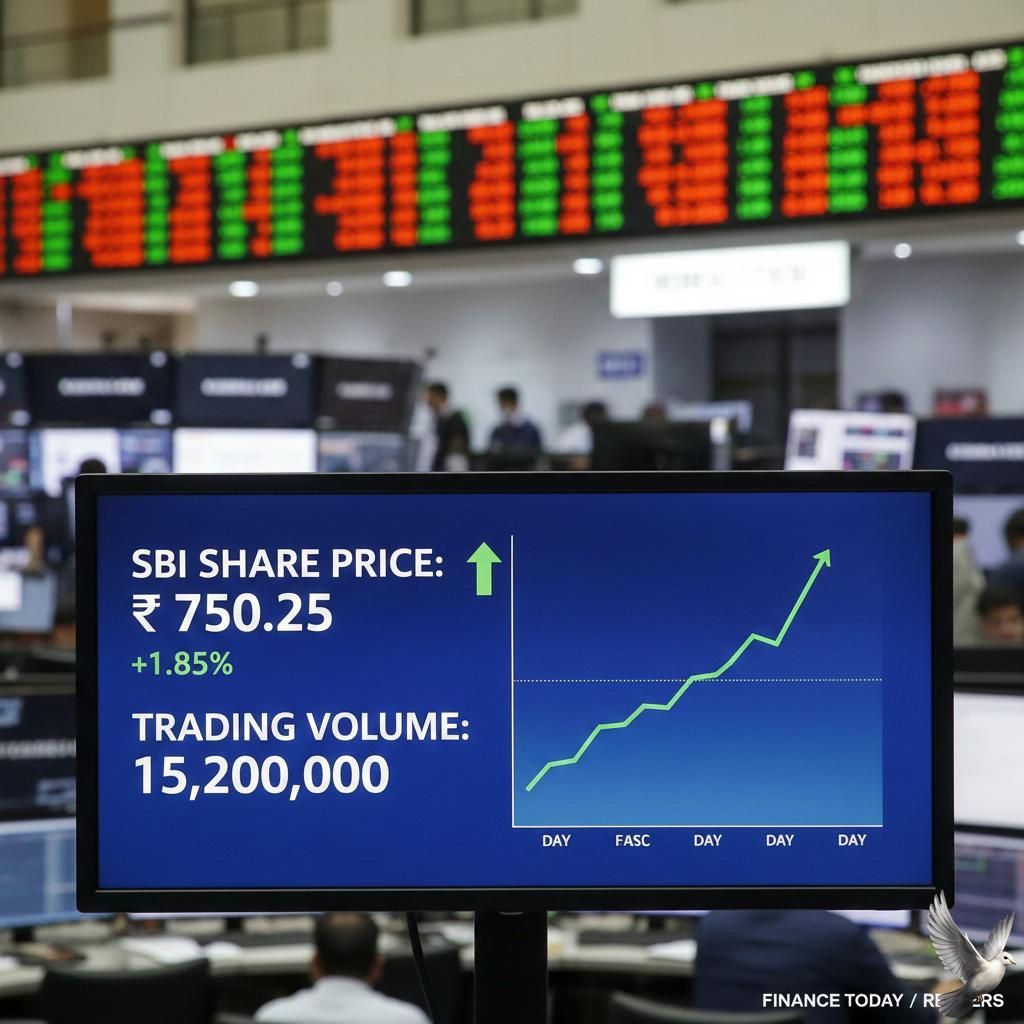
SBI Share Price and Trading Volume Update
**Global Market Snapshot: Friday, January 30, 2026** **Equities: Mixed Close to End the Week** US markets remained largely flat as investors digested mixed tech earnings. The **S&P 500** hovered near **6,978** (-0.01%), while the **Dow Jones** inched up to **49,015** (+0.02%). The **Nasdaq** managed a slight gain to **23,857** (+0.17%), despite heavy pressure from the software sector. **Key Movers** **Microsoft** faced a sharp sell-off, dropping nearly **10%** following disappointing cloud growth numbers, acting as a major drag on the tech sector. Conversely, **Meta** surged over **10%** on strong earnings, while **Apple** shares rose **0.72%** ahead of its own earnings report, helping to balance the indices. **Commodities: Gold Retreats, Oil Stabilizes** After a record-breaking rally, **Gold** prices faced a significant correction, dropping over **4%** to trade around **$5,203** per ounce amid profit-taking and a rebound in the dollar. **Crude Oil** remains relatively soft, with **Brent** trading near **$68.50** and **WTI** around **$59.00**, pressured by eased supply fears. **Crypto: Bearish Sentiment Persists** The crypto market continues to face headwinds. **Ethereum** is struggling below **$3,000**, risking its fifth consecutive month of losses. **Bitcoin** remains under pressure, failing to reclaim key support levels as broader market risk appetite cools. **Economic Focus: Fed Holds Steady** The Federal Reserve kept interest rates unchanged at **3.50%–3.75%**, maintaining a "wait-and-see" approach. Market attention has now shifted to the political arena, with President Trump expected to announce his nominee for the new Fed Chair imminently, a move likely to spark further volatility.

Hindalco Share Price and Trading Volume Analysis
**Global Market Brief: Tech Rout & Pre-Budget Nerves** **Global Equities Shake-Up** Global markets are closing the week on a volatile note as a sell-off in major US technology stocks ripples worldwide. The **S&P 500** has slipped below the key **7,000** mark, pressured by a sharp **10%** decline in Microsoft shares following disappointing cloud growth figures. Nasdaq futures are trading lower, dragging Asian and European tech indices down with them. **India: Pre-Budget Caution** Indian benchmarks are seeing heavy profit-booking ahead of the Union Budget. The **Nifty 50** has retreated to near **25,200**, while the **Sensex** dropped over **400 points** in early trade. * **Sector Drag:** Metal and IT stocks are leading the decline, with Nifty Metal plunging **5%**—its biggest intraday drop in nine months. * **Stock Moves:** Swiggy shares fell **7%** to hit an eight-month low after widening losses, while Larsen & Toubro provided some support with strong quarterly numbers. **Crypto Flash Crash** The cryptocurrency market is witnessing a steep correction. **Bitcoin** has broken key support levels, tumbling below **$85,000** for the first time since December. Ethereum and other major altcoins like Solana and XRP are down over **5–6%**, mirroring the risk-off sentiment in equities. Liquidations across the crypto market have exceeded **$785 million** in the last 24 hours. **Commodities: Gold Cools, Oil Heats Up** * **Gold:** After a record-breaking run, gold prices have cooled to approximately **$5,200** per ounce as investors book profits. * **Oil:** Conversely, crude oil is strengthening. Brent Crude has risen above **$70** per barrel, driven by escalating geopolitical tensions between the US and Iran, raising concerns over supply disruptions in the Strait of Hormuz. **Key Watchlist** All eyes are now on the upcoming Indian Union Budget presentation and further earnings reports from US tech giants like Apple. Volatility is expected to remain high as markets digest the mix of slowing tech growth and geopolitical risks.

HCL Technologies Stock Price and Trading Volume Update
Global Market Brief – January 30, 2026 **US Markets Mixed as Big Tech Diverges** Wall Street closed the week on a divided note as major earnings split investor sentiment. The **Dow Jones** managed to edge higher, adding **0.11%** to reach **49,071**, while the **S&P 500** slipped **0.13%** to **6,969**. The tech-heavy **Nasdaq** led the declines, falling **0.72%** to **23,685**. **Tech Earnings Volatility** **Microsoft** suffered its worst day in years, plunging nearly **10%** after cloud growth slowed, wiping out over **$350 billion** in market cap. In sharp contrast, **Meta Platforms** surged over **10%** on a strong AI-driven outlook. **Apple** shares rose **0.6%** in extended trading after beating revenue expectations, though warnings about rising costs kept gains in check. **Fed Chair Nomination Imminent** Markets are pricing in the likely nomination of **Kevin Warsh** as the next Federal Reserve Chair by President Trump. Treasury yields climbed on the news, contributing to the pressure on tech stocks. The current Fed funds rate holds steady at **3.75%**, with markets watching for future rate path signals under new leadership. **Crypto Sell-Off** **Bitcoin** led a broad retreat in digital assets, dropping to approximately **$84,000**. The sell-off erased nearly **$800 million** in value across the crypto market, driven by risk-off sentiment in high-growth sectors and rising yields. **Commodities: Gold Cools, Oil Steady** After hitting a record high near **$5,600** earlier in the week, **Gold** pulled back to trade around **$5,342**. Despite the dip, the metal is up nearly **24%** in January, fueled by geopolitical tensions and safe-haven demand. **Crude Oil** remained subdued, with WTI trading near **$65** per barrel and Brent around **$69**, facing headwinds from ample supply projections for 2026.
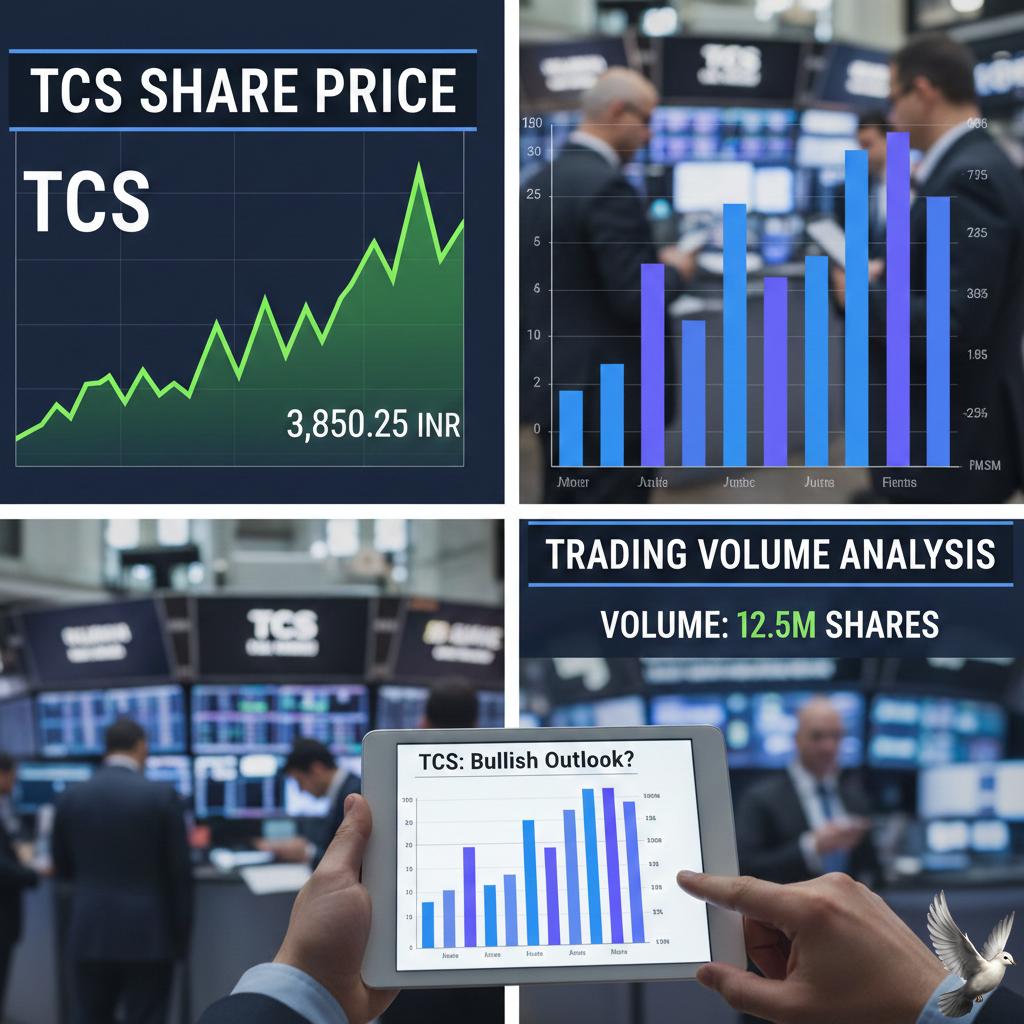
TCS Share Price and Trading Volume Analysis
**GLOBAL MARKET BRIEF: JANUARY 30, 2026** **Executive Summary** Global equities are closing January on a mixed footing as volatility in the technology sector and a cautious Federal Reserve weigh on sentiment. While the **Dow Jones Industrial Average** managed to edge higher, broader indices and crypto markets faced significant selling pressure. Investors are digesting a diverge in Big Tech earnings, with "AI jitter" driving sharp rotation out of software stocks. **Equities & Sector Performance** **US Markets** The **S&P 500** slipped to **6,969.01** (down **0.13%**), struggling to maintain momentum after touching recent highs. The tech-heavy **Nasdaq Composite** saw sharper declines, falling **0.72%** to **23,685.12**, dragged down by a sell-off in enterprise software. Conversely, the **Dow Jones** outperformed, rising **0.11%** to **49,071.56**, buoyed by strength in industrial and defensive names. **Big Tech Divergence** Earnings season has exposed a rift in the technology sector. **Microsoft** shares plummeted **~10%**—their worst day in years—following reports of slowing cloud growth. Similarly, **SAP** dropped **15%** on disappointing forecasts, fueling concerns over AI disruption risks. In contrast, **Meta Platforms** surged **9%**, signaling that investor demand remains robust for companies showing immediate returns on AI capital expenditure. **Global Indices** Asian and European markets mirrored the cautious tone. Japan's **Nikkei 225** dipped **0.22%**, while Hong Kong’s **Hang Seng** faced heavier selling, down **1.78%** amid consolidation. In India, the **Sensex** dropped over **500 points** in early trade, tracking weak global cues and foreign outflows. **Cryptocurrency: Sharp Correction** The crypto market faced a sudden liquidation event. **Bitcoin (BTC)** broke below the critical **$85,000** support level, trading around **$82,448** (down **6.2%**). The decline triggered a broader sell-off, with **Ethereum** and **Solana** posting losses exceeding **6%**. Market breadth is weak, with over **$785 million** in derivative positions liquidated in 24 hours, signaling a temporary "risk-off" shift among digital asset traders. **Commodities & Treasury Yields** **Precious Metals** After a relentless rally, **Gold** prices cooled significantly, retreating **4%** from recent all-time highs. Profit-taking has set in as traders reassess the safe-haven premium following the Fed's latest pause. Silver also saw a steep decline, dropping over **6%**. **Energy** Crude prices remain soft. **WTI Crude** is trading near **$59.06** per barrel, while **Brent Crude** hovers around **$65.59**. Demand concerns continue to cap gains despite geopolitical tensions. **Fixed Income** The Federal Reserve voted to keep interest rates unchanged on January 28, matching market expectations. The **US 10-Year Treasury Yield** held steady at **4.27%**, reflecting a market that is pricing in "higher for longer" rates amid resilient economic data. **Key Economic Watchlist** * **Federal Reserve Policy:** The central bank maintains a neutral stance, awaiting further inflation data before considering cuts. * **Earnings Continuation:** Focus shifts to upcoming reports from **Amazon** and **Apple** to gauge if consumer spending can offset enterprise tech weakness. * **Geopolitics:** Ongoing trade friction and regional instability remain key tail risks for energy and supply chains.

Economic Survey Projects Copper Supply Deficit Amid Rising AI and Power Demand
**MARKET BRIEF: Copper Crunch & The AI-Energy Nexus (2025-26)** **Headline: Economic Survey Warns of Structural Copper Deficits Amid AI & Green Energy Surge** The government's newly released **Economic Survey 2025-26** has flagged a critical shortage of copper as a "strategic chokepoint" for the global economy. The report underscores that the dual pressures of rapid AI data center expansion and the green energy transition are severely straining global supplies. **Price Action & Market Trends** Copper prices have shattered historical records in early **2026**, with trading levels breaching the **$13,000–$14,500 per tonne** mark on major exchanges. This represents a surge of over **40%** from previous years, driven by a disconnect between explosive demand and stagnant mine output. Analysts note that this is not a typical cyclical rally but a structural repricing. The metal is now trading with significant volatility, reacting sharply to geopolitical trade barriers and inventory tightness. **The Demand Shock: AI & Green Energy** The Survey highlights the "staggering" scale of material requirements for modern infrastructure: * **AI Data Centers:** Hyperscale facilities are consuming massive copper volumes for power distribution and cooling, with demand from this sector projected to grow exponentially. * **Renewables:** A single **1 GW** wind turbine requires approximately **2,866 tons** of copper. * **Logistics:** Transporting the ore required for just one such turbine would fill over **1,194 truckloads** (at 400-ton capacity), illustrating the immense logistical burden of extraction. **Supply Side: Outages & Deficits** Global supply chains are fracturing under the weight of disruptions. The Survey points to significant mine outages in key producing regions, including **Indonesia, Congo, and Chile**. Declining ore grades are compounding the issue. Miners now need to process significantly more earth to extract the same amount of metal, with yields at many major operations dropping below **0.6%**. Consequently, global markets are facing a refined copper deficit projected to reach **300,000 to 600,000 tonnes** in 2026. **India’s Strategic Vulnerability** For India, the stakes are particularly high. The country currently imports over **90%** of its copper concentrate requirements. With domestic demand growing at **9%** annually—driven by construction, consumer goods, and infrastructure—India is heavily exposed to global price shocks. The Economic Survey warns that rising input costs could bleed into broader inflation, affecting sectors from electronics to real estate. The government views copper not just as an industrial input but as a critical component of national economic resilience. **Outlook: The New "Oil"** Copper has effectively transitioned from a base metal to a critical security asset. The Survey indicates that control over copper supply chains will increasingly define industrial competitiveness and energy security. With new mine projects taking over **15 years** to come online, the supply-demand gap is unlikely to close in the near term. Markets should brace for sustained elevated prices and heightened volatility as nations compete for limited resources to fuel their digital and green ambitions. *** **Next Step:** I can provide a deep dive into specific copper mining stocks or ETFs that might benefit from these structural deficits if you need targeted investment data.

MFIs to Strengthen Credit Assessment Amid Rising Asset Stress
**Microfinance Sector Brief: Market Correction & Regulatory Reset** **January 30, 2026** **Capital Dynamics & Market Contraction** The historical influx of private equity and venture capital, which previously fueled aggressive expansion in the microfinance sector, has given way to a severe liquidity squeeze. As of **September 30, 2025**, the industry gross loan portfolio (GLP) contracted to **₹3.39 lakh crore**, reflecting a sharp **16.8%** year-on-year decline. The funding environment has shifted from abundance to caution, with equity capital for pure-play firms dropping and debt funding from banks tightening significantly. **Asset Quality & Stress Indicators** The "recurring stress" highlighted in earlier economic assessments has materialized into critical asset quality challenges. Gross Non-Performing Assets (NPAs) surged into **double digits** by late 2025, with some estimates pegging stress levels near **16%**. Delinquencies in the **90+ days past due** bucket effectively doubled over the last fiscal year. Consequently, active borrower counts have fallen, with NBFC-MFIs alone seeing a client base reduction of approximately **20.4%**, as lenders prioritize collection over new disbursements. **Regulatory Guardrails Against Over-Indebtedness** To curb the systemic risks of over-lending, regulatory bodies and industry associations have enforced stricter "guardrails" effective **January 2026**. * **Lender Cap:** Borrowers are now restricted to a maximum of **3** micro-lenders (down from 4). * **Debt Ceiling:** Total indebtedness is capped at **₹2 lakh** per borrower. * **Income Assessment:** Mandatory board-approved policies for precise household income verification are now in full effect to prevent leverage beyond **50%** of household income. **Strategic Outlook & Government Intervention** The sector is currently undergoing a painful consolidation phase. While the government recently announced an **₹8,000 crore** credit guarantee scheme to stabilize cash flows, this falls short of the industry's requested **₹20,000 crore** liquidity support. The focus has decisively shifted from rapid VC-fueled growth to portfolio quality, with larger institutions gaining market share while smaller players face existential viability crises. Regional concentration remains high, with **East and North-East India** continuing to hold the largest portfolio share despite rising delinquency rates.