Bearish News
Collection
JSW Steel Share Price and Trading Dynamics
**Global Market Snapshot: February 3, 2026** **Headline: Equities Rally on US-India Trade Deal & Tech Rebound** Global markets are surging today, driven by a breakthrough trade agreement between the US and India, alongside a sharp recovery in Asian technology stocks. Sentiment has shifted to "risk-on" despite lingering weakness in commodities and cryptocurrencies. **US Markets (Feb 2 Close)** Wall Street steadied Monday, snapping a three-day losing streak as investors bought the dip in tech and industrial sectors. * **S&P 500:** Rose **0.54%** to **6,976.44**. * **Nasdaq Composite:** Added **0.56%** to **23,592.11**. * **Dow Jones:** Climbed **1.05%** to **49,407.66**. **Micron Technology** surged **5.5%** on bullish AI demand forecasts, offsetting a **2.8%** dip in **Nvidia**, which faced concerns over stalled OpenAI investments. **Walt Disney** lagged, falling **7.2%** on soft growth projections. **Asian Markets (Feb 3 Trend)** Asian indices posted massive gains Tuesday, catalyzed by the announcement that the US will cut reciprocal tariffs on Indian goods from **25%** to **18%**. * **India:** The **BSE Sensex** skyrocketed over **2,300 points** (+2.8%), and the **Nifty 50** reclaimed the **25,800** level. * **South Korea:** The **KOSPI** jumped **5%**, erasing Monday's losses, led by a **7.5%** rally in **SK Hynix**. * **Japan:** The **Nikkei 225** advanced **3.2%** to **54,346.33**, buoyed by a weaker yen and tech buying. **Commodities & Rates** Precious metals and energy remain under pressure as capital rotates back into equities. * **Gold:** Consolidating near **$4,652/oz** after briefly dipping below **$4,500** earlier in the week. Volatility remains high following the recent parabolic run-up. * **Crude Oil:** Brent Crude trades soft at **$66.13**, down significantly from January highs, aiding global disinflation narratives. * **US Treasuries:** The **10-year yield** edged up to **4.28%**, reacting to stronger-than-expected US manufacturing data. **Cryptocurrency** Digital assets continue to struggle with outflows totaling **$1.7 billion** this week. * **Bitcoin (BTC):** Trading around **$78,700**, down **~10%** for the month. * **Ethereum (ETH):** Followed the broader slide, with institutional ETFs flipping to net negative flows for 2026. **Market Drivers** 1. **US-India Pact:** The reduction of tariffs has sparked a massive relief rally in emerging markets, boosting global trade sentiment. 2. **Tech Resilience:** Buyers are stepping back into AI hardware stocks (Micron, SK Hynix) despite valuation concerns. 3. **Monetary Policy:** Strong US factory data may delay Federal Reserve rate cuts, keeping bond yields elevated.

Nestle India Share Price and Trading Volume Analysis
**Global Market Brief | February 3, 2026** **Market Sentiment: Cautious Recovery** US equity markets are stabilizing following a session of extreme volatility driven by commodity swings and shifts in monetary policy expectations. Investors are digesting the nomination of **Kevin Warsh** as Federal Reserve Chairman, viewing the pick as a hawkish signal for inflation control. **Key Indices (Intraday/Close)** * **S&P 500:** **6,976.44** (+0.54%) — Snapped a three-day losing streak, trading just shy of record highs. * **Dow Jones:** **49,407.66** (+1.05%) — Led gains as rotational buying favored industrial and cyclical stocks. * **Nasdaq Composite:** **23,592.11** (+0.60%) — Tech remains mixed as investors scrutinize AI capital expenditure returns. **Commodities & Currencies** * **Gold:** **~$4,652/oz** — The metal is attempting to find a floor after a historic flash crash saw it drop over **$1,000** from recent highs. * **Silver:** **~$82.50/oz** — Recovering from a sharp 9% overnight plunge. * **Crude Oil (WTI):** **$61.73/bbl** (-0.66%) — Prices retreated as geopolitical tensions with Iran showed signs of easing following recent diplomatic comments. * **10-Year Treasury Yield:** **4.28%** — Yields edged higher on stronger-than-expected manufacturing data, putting pressure on rate-cut bets. **Sector & Corporate Movers** * **Tech Divergence:** **SanDisk** surged **+15%** on strong AI-driven memory demand, while **Microsoft** faced pressure (-1.6%) over cloud growth concerns. * **Semiconductors:** **Micron** rallied on bullish analyst notes; **Nvidia** slipped (-1%) amid reports of potential deal friction with OpenAI. * **Earnings Watch:** **Disney** gained (+1%) after beating revenue estimates; **Palantir** surged (+2%) ahead of its earnings report. **Macro Outlook** Data remains the primary catalyst this week. Monday’s **ISM Manufacturing PMI** signaled unexpected expansion, reducing immediate recession fears but complicating the Fed's path to easing. Markets are now bracing for Friday’s **Non-Farm Payrolls** report (consensus: +70k jobs) to gauge labor market resilience under the new policy regime. **Watchlist** * **Upcoming Earnings:** Alphabet, Amazon, Eli Lilly. * **Key Data:** JOLTS Job Openings (Tuesday), ADP Employment (Wednesday).
Bajaj Finance Share Price and Volume Analysis
**Global Market Brief: Volatility Spikes on Tariff & AI Jitters** **Overview** Global equities are facing renewed turbulence as **trade war fears** and **AI sector recalibration** dominate sentiment. Markets are reacting sharply to the Trump administration's aggressive tariff announcements and the disruption caused by the DeepSeek AI release, forcing a repricing of risk assets. **Equity Markets** US indices closed significantly lower as investors digested the imposition of **25% tariffs** on Canada and Mexico and **10%** on China. The tech sector led the decline, pressured by concerns over AI profitability and trade retaliations. * **S&P 500**: Closed at **6,040.53** (down **0.5%**). * **Nasdaq**: Slid to **19,627.44** (down **1.2%**), hit hard by semiconductor weakness. * **Dow Jones**: Dropped **337 points** to **44,544.66** (down **0.8%**). * **India (Sensex)**: Fell **319 points** to **77,186**, tracking global weakness. **Key Market Drivers** * **Tariff Tantrum**: The White House's executive orders on tariffs have sparked concerns of a retaliatory trade war, impacting supply chains for autos (GM, Toyota down **~3%**) and transportation (FedEx down **6.6%**). * **AI "Reality Check"**: The debut of Chinese startup **DeepSeek**’s low-cost model has triggered an "AI bubble" scare, pulling down heavyweights like **Nvidia** (down **2.8%**) and **Microsoft** amid fears of margin compression. * **Fed Policy**: The Federal Reserve held rates steady at **4.25%–4.50%**, signalling a cautious approach to inflation which remains sticky at **2.6%** (PCE). **Commodities & Crypto** Safe-haven assets and energy are diverging from equities. * **Oil**: Prices edged higher on supply disruption fears. **Brent Crude** rose **0.77%** to **$76.25**, and **WTI** climbed **1.8%** to **$73.84**. * **Gold**: Retained its safe-haven appeal, trading around **$2,787** per ounce globally, with domestic prices in India seeing a slight uptick. * **Crypto**: Digital assets faced a steep sell-off in a risk-off environment. **Bitcoin** dropped below **$96,000**, shedding **~3.7%**, while **Ethereum** and **Solana** saw double-digit declines. **Corporate Radar** Earnings season enters a critical phase with major tech giants reporting this week. * **Alphabet (Google)** and **Amazon** are set to release results, which will be pivotal for stabilizing tech sentiment. * **Palantir** surged in extended trading after beating revenue expectations, signalling resilience in specific AI software segments. * **Disney** and **ExxonMobil** are also on deck, providing insights into consumer health and energy demand. **Next Step** I can generate a detailed technical analysis of the S&P 500 or a comparative breakdown of the new tariff impacts on specific sectors if you provide the focus area.
SEBI Likely to Extend Ban on Agricultural Futures
**Market Brief: SEBI Agricultural Futures Ban** **Current Status: Ban Active & Extension Likely** The Securities and Exchange Board of India (SEBI) currently enforces a suspension on futures trading for key agricultural commodities, valid until **March 31, 2026**. Latest market reports from **February 2026** indicate the regulator is poised to extend this ban for **another year** (until 2027), continuing its conservative stance on food inflation and market stability. **Affected Commodities** The suspension applies to **7 core agricultural assets** and their derivatives: 1. Wheat 2. Paddy (non-basmati) 3. Moong (Green Gram) 4. Chana (Gram) 5. Mustard Seeds (including derivatives) 6. Soybean (including derivatives) 7. Crude Palm Oil (CPO) **Key Drivers & Rationale** * **Inflation Control:** Government focus remains on curbing food price volatility. Officials cite that while prices have stabilized, removing restrictions now could reignite speculative pressure. * **Speculation Concerns:** The ban, originally imposed in **December 2021**, was designed to strip speculative froth from essential food items. * **Conflicting Views:** A SEBI-appointed panel in late **2025** had reportedly recommended *lifting* the ban to boost liquidity and aid price discovery. However, the regulator appears to be favoring caution over market liberalization for the upcoming fiscal year. **Industry Impact** * **Hedging Void:** The continued suspension leaves farmers, processors, and importers without domestic hedging tools, exposing them to global price swings. * **Volume Shift:** Trade volumes on exchanges like **NCDEX** have seen significant declines as liquidity dries up in the absence of these anchor commodities. * **Stakeholder Pushback:** Industry bodies argue that without futures contracts, the value chain loses critical price signals, ultimately hurting the farmers the policy aims to protect. **Next Steps** Market participants should prepare for the formal notification of the extension before the **March 31, 2026** expiry. Traders are advised to maintain alternative risk management strategies for the listed commodities.
Oil Steady Amid Firm Dollar and Possible U.S.-Iran De-escalation
**Global Market Snapshot: February 3, 2026** **Energy Markets** Oil prices have retreated significantly, breaking a period of stability as geopolitical risk premiums unwind. **Brent Crude** is currently trading around **$65.89** per barrel, while **WTI Crude** has dipped to **$61.73**. The market is reacting to a sharp de-escalation in Middle East tensions, with traders pricing in the reduced likelihood of supply disruptions. **Geopolitical Developments** Sentiments have shifted following the confirmation that **U.S. and Iranian officials** will resume direct diplomatic talks this Friday in Ankara. This breakthrough, mediated by regional partners, has immediately cooled fears of a wider conflict, acting as the primary driver for the bearish turn in energy prices. **Trade Relations** In a major policy shift, the U.S. and India have finalized a new trade agreement. Under the deal, the U.S. has slashed tariffs on Indian goods to **18%** (down from 25%). In exchange, India has agreed to halt purchases of Russian oil, signaling a strategic realignment that is expected to impact global crude flows and strengthen bilateral commercial ties. **Currency Performance** The **U.S. Dollar Index (DXY)** has strengthened to **97.52**, up approximately **0.55%**. The greenback’s rally is supported by robust domestic economic data and shifting expectations regarding Federal Reserve policy, providing a stable backdrop for the unfolding shifts in global trade and energy dynamics. I can monitor the outcome of the Ankara talks this Friday for further impact on oil volatility.
China Gold Market Downturn Highlighted by Steep Retail Losses
**Global Commodities Brief: Precious Metals Rout** **Executive Summary** A massive reversal in the precious metals market has triggered historic losses for retail and institutional investors alike. Following a parabolic rally driven by speculative "hot money" in Asia, the market collapsed in late January and early February 2026. The sell-off was catalyzed by the nomination of **Kevin Warsh** as the next US Federal Reserve Chair, which strengthened the US Dollar and signaled a potentially hawkish monetary policy shift. **The Speculative Bubble Bursts** Chinese retail investors, who had aggressively piled into futures markets, faced immediate devastation. One widely cited case involves a **42-year-old homemaker** in Hangzhou. After opening a futures account to chase the rally, she initially saw a **60% gain** in 48 hours. However, the subsequent market U-turn triggered a forced liquidation of her leveraged positions. In less than one week, she incurred a **750,000 yuan** loss, wiping out **84%** of her peak investment equity. This case reflects a broader trend of margin calls cascading through the retail sector, with many accounts facing total wipeouts. **Market Data & Price Action** The volatility recorded in the last 72 hours has been historic: * **Silver Crash:** Silver futures suffered their largest single-day drop on record, plunging approximately **26%** in one session. Prices collapsed from all-time highs near **$121 per ounce** to trade in the **$70–$80** range. * **Gold Sell-Off:** Gold spot prices fell roughly **9–10%**, the sharpest daily decline since 1983. Prices retreated from a peak above **$5,600** to test support levels near **$4,400**. * **Exchange Responses:** To curb volatility, the **Shanghai Gold Exchange** and **CME Group** significantly hiked margin requirements, forcing further liquidations of leveraged bets. **Key Drivers** The nomination of Kevin Warsh unnerved markets previously positioned for aggressive rate cuts. His reputation as a "hard money" advocate drove the **US Dollar Index** sharply higher, making dollar-denominated commodities expensive for overseas buyers. Combined with profit-taking from trend-following funds, this fundamental shift caused the "hot money" trade to unravel instantly. Market analysts note that while long-term structural demand remains, the short-term speculative fervor has been effectively flushed out.

Gift Nifty Signals Gap-Up Opening Following US Trade Deal and Asian Rally
**Global Market Snapshot: February 3, 2026** **US Equities Rebound, Asia Stumbles** US markets opened February on a high note, snapping recent losing streaks as investors digested positive manufacturing data and earnings. The **Dow Jones** surged **515 points (+1.05%)** to close at **49,407**, while the **S&P 500** added **0.54%** to reach **6,976**, finishing just shy of record highs. The tech-heavy **Nasdaq** rose **0.56%** to **23,592**, buoyed by gains in Alphabet and Amazon ahead of earnings. Contrastingly, Asian markets faced severe turbulence. South Korea's **Kospi** crashed **5.26%**, marking its worst single-day performance since April 2025. In India, the **Nifty 50** and **Sensex** plunged nearly **2%** following the Union Budget 2026 announcement, which hiked taxes on derivatives and share buybacks. **Commodities: Historic Volatility** Precious metals are witnessing extreme volatility following record rallies. **Silver** crashed approximately **30%** on February 1—its worst daily drop since 1980—before stabilizing near **$80.50** per ounce. **Gold** also faced heavy selling pressure, dipping below **$4,500** per ounce briefly before settling near **$4,780** (Global Spot). Oil prices pushed higher, with **WTI Crude** climbing above **$65** per barrel, driven by winter storms disrupting US output and renewed geopolitical risks in the Middle East. **Crypto Markets: Liquidity Crunch** Digital assets remain under pressure. **Bitcoin** slumped to **$74,000**—its lowest level since April 2025—before staging a mild recovery to trade around **$76,000**. **Ethereum** faced sharper declines, sliding over **8%** as major holders ("whales") liquidated **$371 million** in assets to repay DeFi loans, triggering widespread liquidation cascades. **Macro Drivers & Key Events** * **US Manufacturing:** Factory activity expanded for the first time in a year, with the ISM Manufacturing PMI hitting its highest level since August 2022, signaling economic resilience. * **Fed Leadership:** Markets are adjusting to President Trump's nomination of **Kevin Warsh** to succeed Jerome Powell as Federal Reserve Chair, keeping bond yields steady. * **Data Delays:** The highly anticipated January US Jobs Report, originally scheduled for Friday, has been delayed due to a partial government shutdown.

Textile Stocks in Focus Amid India-US Trade Deal Developments
**MARKET BRIEF: US-INDIA TRADE BREAKTHROUGH** **The Catalyst: Tariff Wall Breached** Indian textile stocks have entered a decisive bull phase following the landmark trade agreement signed **February 2, 2026**. The deal slashes US tariffs on Indian textile exports to **18%**, a sharp reduction from the prohibitive **25–50%** reciprocal duties and penalties that had choked volumes throughout 2025. **Immediate Market Impact** Reaction on Dalal Street was swift and volume-led. Key export-focused counters surged in early trade: * **Gokaldas Exports**: Up **5%** * **Raymond**: Surged **8.18%** * **KPR Mill**: Gained **6%** * **Vardhman Textiles**: Up **7.36%** **Strategic Advantage** This tariff reset fundamentally alters the competitive landscape. * **Price Parity**: At **18%**, Indian exporters now face lower duties than competitors in **Vietnam** and **Bangladesh**, who are grappling with **20%** tariffs and severe internal supply chain disruptions. * **Volume Pivot**: The removal of the "Russian oil penalty" overhang (which had pushed effective duties to **50%** for some categories) is expected to restart stalled order flows from major US retail chains immediately. **Sector Outlook** The textile index is breaking out of a 12-month consolidation. With Bangladesh's spinning industry facing indefinite shutdowns as of **February 1, 2026**, global buyers are aggressively consolidating sourcing into India. The dual tailwinds of **tariff normalization** and **competitor instability** project a robust Q4 FY26 for integrated players. *** [Impact of Regional Crisis on Indian Textiles](https://www.youtube.com/watch?v=rwyykhjc_V0) This video provides essential context on how the concurrent supply chain crisis in Bangladesh is accelerating the shift of export orders to Indian manufacturers, amplifying the benefits of the new tariff deal. http://googleusercontent.com/youtube_content/0

Bitcoin Liquidations Reach $2.5 Billion Amid Market Volatility
Market Brief: Liquidation Surge & Risk-Off Sentiment **February 3, 2026** The cryptocurrency market has faced a severe contraction, validating reports of a massive $2.56 billion loss in collective liquidations over recent days. This sharp downturn was primarily triggered by the nomination of Kevin Warsh as the next Federal Reserve Chair, a move interpreted by investors as a signal for tighter monetary policy and a stronger U.S. dollar. Bitcoin (BTC) bore the brunt of this volatility, plunging below the **$75,000** support level earlier this week—its lowest point since April 2025. While prices have staged a mild recovery to trade near **$78,400**, the market remains fragile. Sentiment has deteriorated significantly, with the Fear & Greed Index dropping to **17**, indicating "Extreme Fear" among traders. This sell-off was not isolated to digital assets. Precious metals experienced a simultaneous crash, dismantling the "safe haven" narrative. Silver futures plummeted approximately **16%**, while Gold retreated by roughly **6.5%**, as the strengthening dollar reduced the appeal of non-yielding assets. The technology sector also contributed to the bearish atmosphere. Investor anxiety regarding the evolving AI landscape has intensified, driven by concerns over sustainable returns on massive infrastructure spending by major tech firms. This skepticism created a correlation between tech stocks and crypto, amplifying the selling pressure across all high-risk categories. Market participants are now exercising extreme caution, waiting to see if the **$75,000** floor for Bitcoin holds or if the "risk-off" environment will drive further de-risking in the days ahead.

Key Factors Influencing Tuesday's Stock Market Action
**Market Brief: Post-Budget Rebound & Volatility Analysis** **February 2, 2026** **Indices Reclaim Key Levels** Indian equity benchmarks staged a sharp recovery today, wiping out a significant portion of the losses sustained during the Budget-day sell-off. The **BSE Sensex** surged **944 points** (+1.17%) to close at **81,666**, while the **Nifty 50** reclaimed the psychological 25,000 mark, ending at **25,088** (+1.06%). **Volatility Drivers: STT & Borrowing Costs** The initial market "drubbing" was triggered by the Union Budget 2026-27, specifically the steep hike in the Securities Transaction Tax (STT) on F&O trading—futures STT jumped to **0.05%** from 0.02%—and a higher-than-expected gross borrowing plan of **₹17.2 lakh crore** for FY27. Bond yields spiked in response, with the 10-year yield hitting **6.78%**. **Crude Relief & Global Cues** Sentiment improved significantly today due to a sharp correction in global oil prices. Brent Crude tanked nearly **5%** to trade around **$65.94** per barrel, driven by signs of easing geopolitical tensions between the U.S. and Iran. This decline offered crucial respite to India’s import bill, offsetting concerns over the government's fiscal math. **Technical Outlook** Despite the bounce, technical damage remains visible. The Nifty 50 briefly slipped below its **200-day moving average** during the Budget session, a sign of weakening medium-term momentum. While the index is back above **25,000**, analysts caution that the broader trend remains guarded. The consensus suggests a "sell on rise" strategy as the market digests the liquidity impact of higher taxes. **Sector Watch** Broad-based buying was observed across **14 of 16 sectors**, with Oil & Gas, Banking, and Auto stocks leading the charge. However, broader caution persists as Foreign Institutional Investors (FIIs) remain net sellers, offloading equities worth over **₹580 crore** in the previous session.

Budget 2026 Maintains Status Quo on Crypto Taxation Structure
**Market Brief: India Crypto & VDA Sector (Budget 2026)** **Core Policy Update** The Union Budget 2026 has strictly maintained the status quo on crypto taxation, bypassing industry demands for relief. The existing **30%** flat tax on gains and the controversial **1%** TDS on transactions remain in full force. The ban on setting off losses against gains also continues, effectively taxing gross profits without accounting for net trading realities. **New Compliance Penalties** While tax rates remained static, the government tightened enforcement mechanisms. A new amendment introduces specific financial penalties for reporting failures, effective **April 1, 2026**: * **₹200 per day** for failure to furnish transaction statements. * **₹50,000** flat penalty for providing inaccurate information or failing to rectify errors. These provisions target reporting entities (exchanges and VDAs) to ensure strict adherence to Section 509 of the Income Tax Act. **Market Impact & Liquidity** The decision to retain the **1%** TDS is expected to perpetuate the "liquidity drain" on domestic exchanges. Industry data indicates that nearly **72%** of Indian crypto trading volume has already shifted to offshore platforms to bypass this levy. By refusing to lower the TDS to the requested **0.01%**, the government has prioritized transaction tracking over restoring onshore market depth. **Sector Sentiment** Industry response is mixed but largely somber. While some leaders view the new penalty clauses as a step toward "formalizing" the sector and removing regulatory ambiguity, the lack of economic rationalization is a major setback. The inability to offset losses remains a critical friction point, leaving traders with high tax liabilities even in net-loss scenarios. **Key Figures at a Glance** * **30%**: Tax on VDA gains (unchanged) * **1%**: TDS on transfers (unchanged) * **₹200/day**: New penalty for reporting delays * **₹50,000**: New penalty for inaccurate data * **72%**: Estimated trading volume moved offshore due to current tax structure
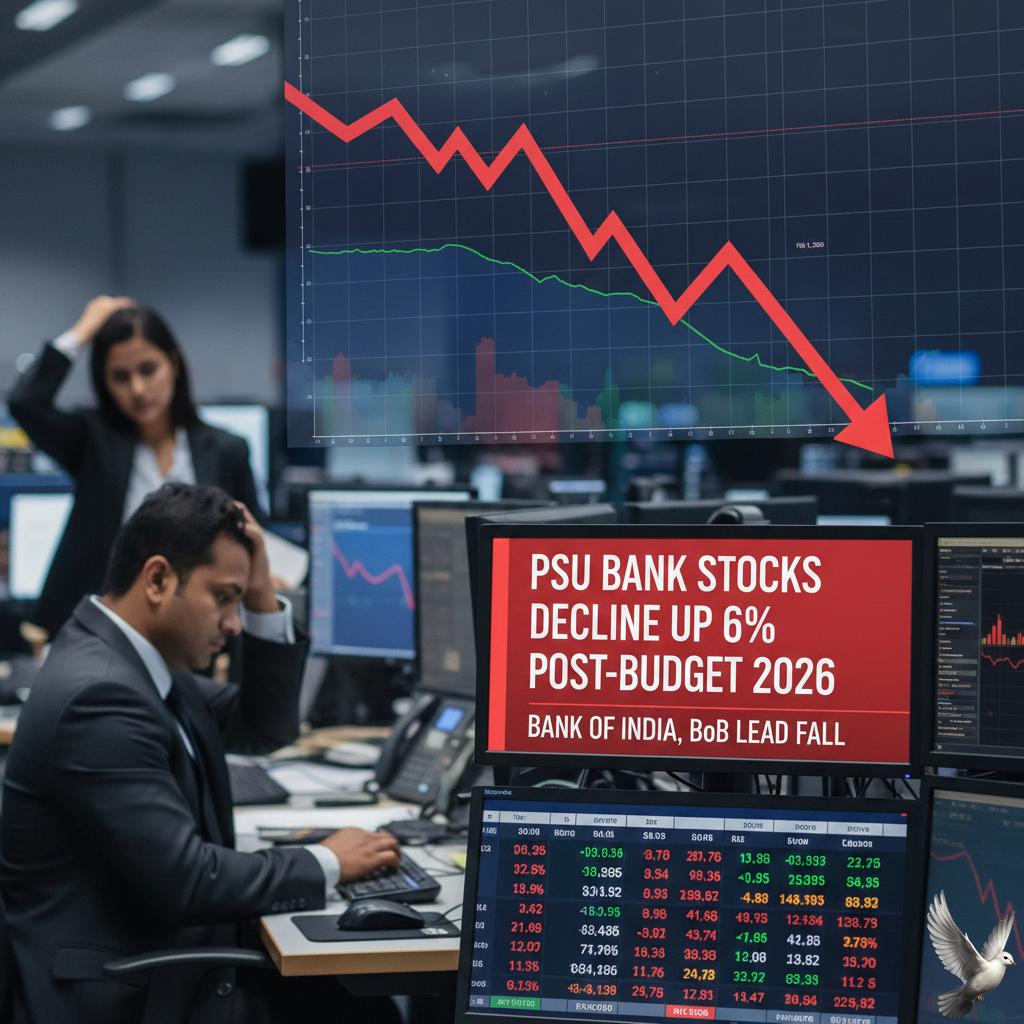
PSU Bank Stocks Decline Up to 6% Post-Budget 2026; Bank of India, BoB Lead Fall
**Market Brief: PSU Banks Hit by Budget Sunday Sell-Off** State-run bank shares faced intense selling pressure during today’s rare Sunday trading session, triggered by key announcements in the Union Budget 2026-27. The sector emerged as the biggest underperformer as markets reacted to policy shifts and fiscal data. **Sector Performance** The **Nifty PSU Bank index** tumbled approximately **5.6%** intraday, erasing recent gains. All 12 constituents of the index traded in the red, marking a sharp reversal from the sector's strong pre-budget momentum. * **Bank of India** led the losses, sliding nearly **7%** to trade around ₹152. * **Indian Bank** dropped over **8%**. * **Bank of Baroda** and **Union Bank** declined by roughly **4–5%**. **Key Triggers** Investors reacted nervously to two major developments outlined by Finance Minister Nirmala Sitharaman: **1. High-Level Committee for Banking** The government announced the formation of a high-level committee to comprehensively review the banking sector. While aimed at aligning the sector with the **"Viksit Bharat"** (Developed India) initiative and ensuring future growth, the lack of immediate clarity on potential structural changes fueled uncertainty. **2. Record Borrowing Target** The Centre set a gross market borrowing target of **₹17.2 lakh crore** for FY27, exceeding street estimates of ₹16.3–16.5 lakh crore. * **Impact:** Higher borrowing typically pushes bond yields up. * **Consequence:** Public Sector Banks (PSBs), which hold significant government bond portfolios, face the risk of **Mark-to-Market (MTM) losses**, dampening profitability outlooks. **Broader Context** * **Restructuring:** The Budget also proposed restructuring state-run non-bank lenders, including **Power Finance Corp (PFC)** and **REC**, to strengthen financial institutions. * **Rare Session:** This volatility occurred during a special live trading session, as the Budget presentation fell on a Sunday for the first time since the NDA government shifted the date to February 1. **Summary:** The dual whammy of structural review uncertainty and yield-spike fears triggered an aggressive sell-off in state-owned lenders, making them the primary casualty of the Budget 2026 session.
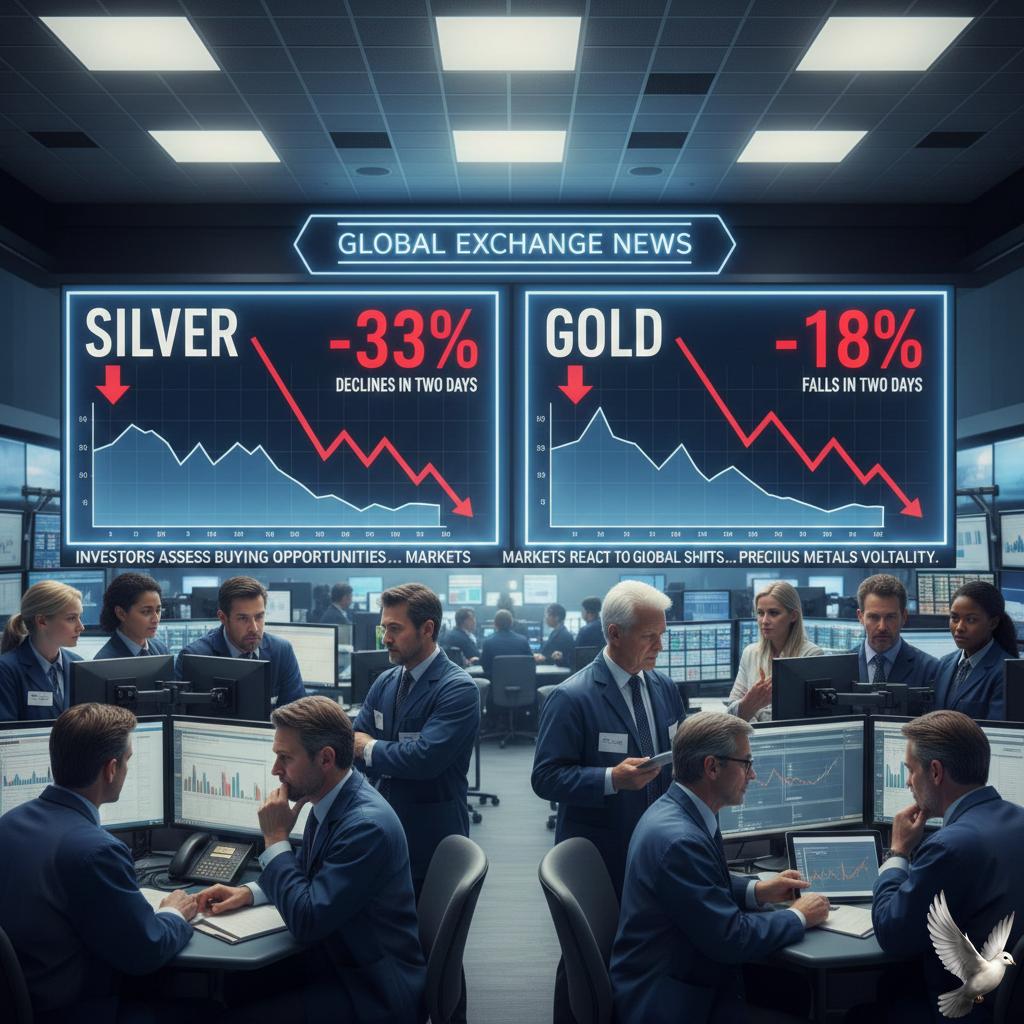
Silver Declines 33% and Gold Falls 18% in Two Days as Investors Assess Buying Opportunities
**MARKET BRIEF: PRECIOUS METALS CORRECTION** **Historic Price Collapse** Gold and silver prices have witnessed a historic crash, snapping a record-breaking rally with unprecedented speed. **Silver** has been the hardest hit, plunging approximately **33%** in just two trading sessions. On Sunday alone, MCX Silver hit a **9%** lower circuit, dropping to **₹2,65,652** per kg and wiping out over **₹1.35 lakh** from its recent peak of **₹4 lakh**. **Gold** mirrored this severe weakness, sliding roughly **18%** from its all-time highs. Prices retreated to trade around **₹1,38,634** per 10g on the MCX, while global spot prices fell below **$4,900** per ounce. **Primary Catalysts** The sharp reversal was triggered by US President **Donald Trump’s nomination of Kevin Warsh** as the next Federal Reserve Chair. Markets interpreted this "establishment-friendly" pick as a signal of stability for the central bank's independence, causing the **US Dollar Index (DXY)** to surge above **97**. Compounding the sell-off, the **CME Group** raised margin requirements for gold and silver futures. This forced traders to unwind leveraged positions immediately, accelerating the downward momentum. **Expert Outlook** Market veterans advise against panic, characterizing the drop as a "sentiment shock" and profit-booking event rather than a fundamental story-breaker. With structural drivers like geopolitical tension and central bank buying still intact, analysts suggest viewing this deep correction as a buying window. The consensus recommendation is to adopt a **staggered buying strategy**, slowly accumulating positions as volatility settles.

Bitcoin Holds Near $84,000 Following Warsh Fed Chair Nomination
**Market Brief: Bitcoin Stabilises Amid Fed Chair Nomination** **Current Snapshot** Bitcoin is trading near **$84,000**, attempting to stabilise after dipping to a two-month low of **$81,000**. The sharp volatility follows President Donald Trump’s official nomination of **Kevin Warsh** as the next Federal Reserve Chair, replacing Jerome Powell when his term expires in May 2026. **Key Market Drivers** * **Fed Leadership Shift:** Markets are pricing in uncertainty regarding Warsh’s policy stance. While historically a "hawk" (favouring higher rates), his recent alignment with administration calls for lower rates has created a mixed outlook for risk assets. * **Institutional Outflows:** Spot Bitcoin ETFs have seen significant capitulation, recording nearly **$818 million** in daily outflows and pushing weekly outflows above **$1.5 billion**. * **Sentiment Plunge:** The Crypto Fear & Greed Index has dropped to **16–20 (Extreme Fear)**, signaling aggressive bearish sentiment not seen since late 2025. **Broader Crypto Performance** * **Ethereum (ETH):** Trading around **$2,680**, down alongside the broader altcoin market. * **Altcoins:** Major tokens including **Solana (SOL)** and **XRP** have faced 7–8% weekly declines, though some recovery is visible in intraday trading. * **Liquidations:** Over **$1.8 billion** in crypto positions were liquidated recently, flushing out excessive leverage. **Outlook** Despite the "sell-the-news" reaction to the Fed nomination and heavy ETF bleeding, technical indicators suggest the market is oversold. The flush of leverage and extreme bearish sentiment may set the stage for a near-term contrarian rebound if the **$84,000** support level holds firm.
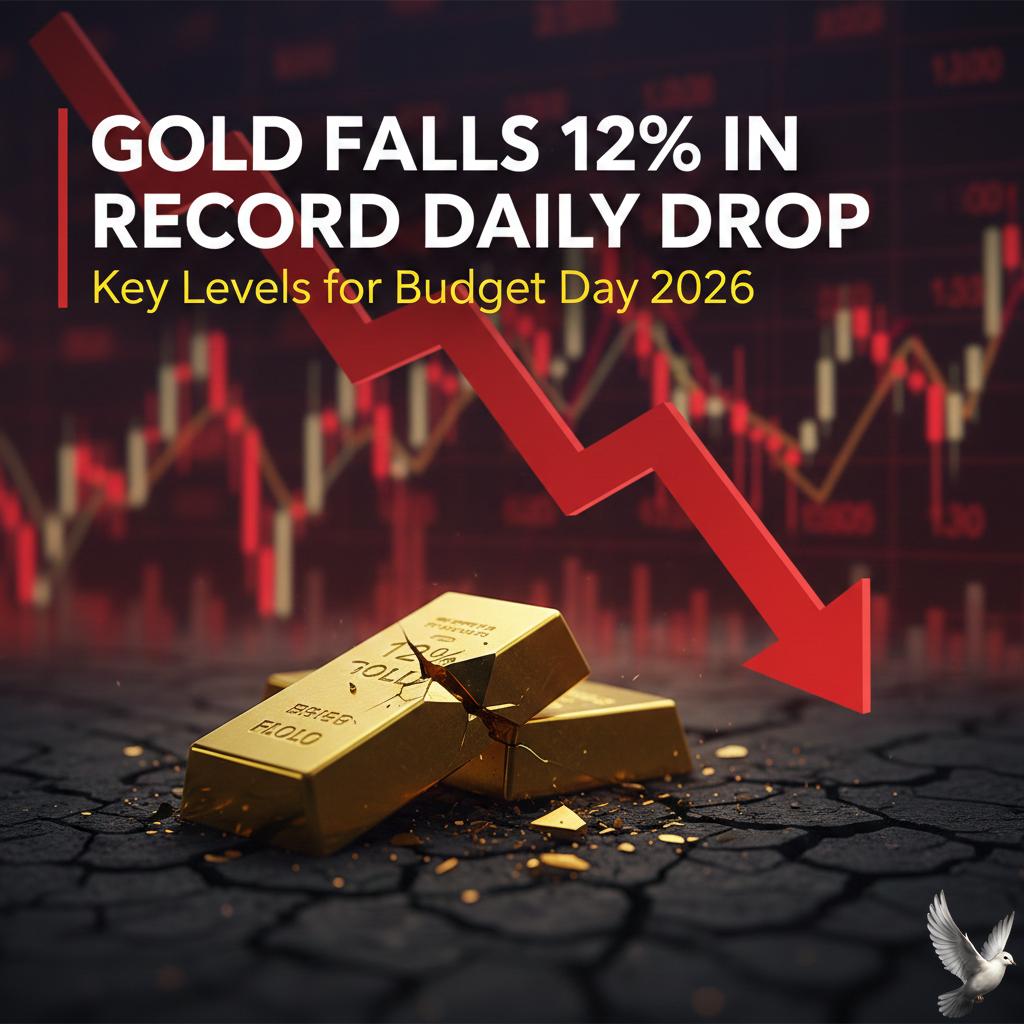
Gold Falls 12% in Record Daily Drop; Key Levels for Budget Day 2026
MARKET BRIEF: Historic Gold Crash & Pre-Budget Volatility **Current Status (Jan 31, 2026)** Gold prices have suffered a historic collapse, registering their steepest single-day decline in decades. After touching record highs earlier this week (near **₹1.83 lakh** per 10g), the yellow metal witnessed a brutal correction, shedding approximately **12% intraday** in international markets. **Market Data & Key Moves** * **MCX Gold:** Plummeted to trade near **₹1.69 lakh** levels, erasing over **₹11,000–₹14,000** per 10g in a single session. * **Spot Gold (Global):** Broke below the psychological **$5,000/oz** mark, retreating sharply from the **$5,600** peak. * **Silver Carnage:** Silver futures crashed even harder, plunging **15–17%** to slip below **₹3.35 lakh** per kg. * **Currency Impact:** The correction was driven by a sharp rebound in the **US Dollar Index (DXY)**, which strengthened on news of a potential hawkish Federal Reserve Chair nomination (Kevin Warsh), dampening safe-haven demand. **Drivers of the Crash** * **Profit Booking:** The "parabolic" rally of January (up ~32%) triggered massive liquidation of leveraged positions. * **Fed Jitters:** Renewed expectations of a tighter US monetary policy boosted the dollar, making non-yielding bullion expensive. * **Budget 2026 Focus:** Traders are now eyeing the Union Budget (Feb 1) for potential changes in import duties or gold-related policies, adding to the nervousness. **Outlook** Volatility is expected to remain extreme. With prices testing critical support zones near **₹1.60 lakh**, the market’s focus shifts entirely to the Budget announcement and the US dollar's trajectory. **Next Step:** I can provide a technical summary of the key support levels for MCX Gold and Silver to watch during the Budget session if you need precise entry/exit zones.
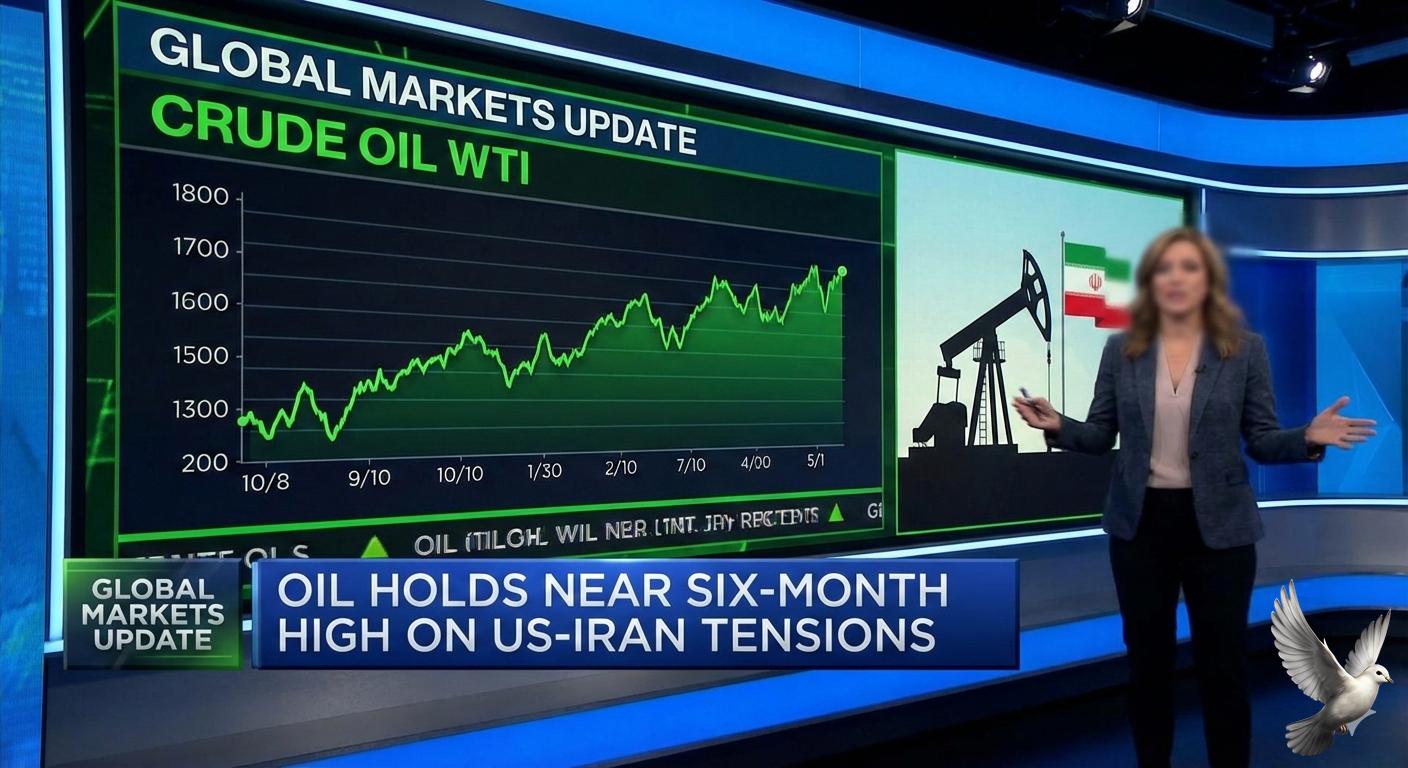
Oil Holds Near Six-Month High on US-Iran Tensions
**Global Oil Market Brief – January 31, 2026** **Current Market Status** Oil prices have rallied to near four-month highs, driven by renewed geopolitical instability and supply constraints. **Brent Crude** is currently trading around **$69.80 – $70.70** per barrel, while **WTI Crude** has climbed to approximately **$65.20 – $65.75**. **Key Drivers** * **Geopolitical Tensions:** escalating friction between the U.S. and Iran has re-emerged as a primary market mover. Recent warnings from the U.S. administration regarding nuclear talks and naval readiness have reintroduced a risk premium, with traders fearing potential disruptions in the Strait of Hormuz. * **OPEC+ Policy:** The alliance is reportedly set to extend its oil production pause through **March 2026**. This decision to withhold additional supply is intended to counter seasonal demand weakness and support a price floor near **$70**. * **Supply Disruptions:** Severe winter storms in the U.S. have temporarily shut in approximately **600,000 barrels per day** of production. Simultaneously, outages in Kazakhstan (Tengiz field) are tightening immediate global availability. * **Strategic Buying:** China continues to act as a stabilizer, with record crude imports and aggressive stockpiling estimated at **2.67 million bpd** in December, taking advantage of lower prices to build strategic reserves. **Market Outlook** While the immediate trend is bullish due to war risk and weather outages, analysts remain cautious about the broader 2026 horizon. Projections from agencies like the EIA suggest prices could average lower later in the year—potentially dipping towards **$56**—as global production eventually outpaces demand. For now, the market remains volatile, effectively balancing immediate supply fears against long-term oversupply forecasts.
Silver Records Historic Decline on MCX; Three Factors Behind the Fall
**Market Brief: Silver's Historic Correction** **Crash Overview** Silver futures on the MCX witnessed a historic single-day collapse on January 30, 2026. Prices plunged approximately **27%**, erasing over **₹1 lakh** per kg in a single session. The white metal, which recently touched a lifetime high of nearly **₹4.2 lakh** per kg, crashed to settle around the **₹2.92 lakh** level. This marks one of the steepest single-session declines in decades. **Key Drivers** * **Fed Leadership Shift:** Sentiment turned bearish following reports of Kevin Warsh’s nomination as the next Federal Reserve Chair. His perceived "hawkish" stance (favoring tighter monetary policy) triggered a sharp rebound in the US Dollar, pressuring dollar-denominated commodities. * **Margin Calls:** Major exchanges, including the CME, raised margin requirements for precious metals. This forced leveraged traders to liquidate positions aggressively to cover costs, accelerating the sell-off. * **Profit Booking:** The crash followed a vertical rally where silver had gained nearly **58%** in January alone. Traders rushed to lock in gains after the metal reached extreme overbought levels. **Global Context** The sell-off was mirrored globally, with international spot silver tumbling from record highs of nearly **$120** per ounce to trade near **$85** per ounce. Gold also faced significant pressure, dropping in tandem, though silver's high volatility made its correction far more severe. **Outlook & Fundamentals** Despite the massive "leverage flush," structural fundamentals remain active. Analysts note that the long-term investment case is supported by deep supply deficits and critical industrial demand from the solar, AI, and green energy sectors. Market observers view this as a sentiment reset rather than a reversal of the secular bull trend, with Citi maintaining a **$150** target in the medium term.
Bombardier Shares Fall 9% on Trump Tariff and Decertification Threats
**MARKET ALERT: Aerospace Sector** **Date:** January 31, 2026 **Bombardier Slides on White House Tariff Threat** **The Event** Bombardier Inc. (BBD.B) shares plunged **9%** in Friday trading following a direct ultimatum from U.S. President Donald Trump. In a statement released Thursday night via Truth Social, the President threatened to "decertify" Bombardier’s large-cabin Global Express jets and impose a sweeping **50% import tariff** on all Canadian-made aircraft. **The Ultimatum** The proposed penalties are conditional. President Trump stated these measures will remain until Transport Canada grants full certification to rival U.S. jets manufactured by Gulfstream Aerospace (a General Dynamics subsidiary). The President specifically named the **Gulfstream G500, G600, G700, and G800** models, claiming Canadian regulators have "wrongfully, illegally, and steadfastly" blocked their entry into the domestic market. **Market Reaction (Friday, Jan 30)** * **Stock Impact:** Bombardier stock opened sharply lower, shedding approximately **9%** of its value in early trading on the Toronto Stock Exchange. * **Price Levels:** Class B shares fell significantly from the ~**CA$249** range, trading down to the **CA$232** level amid high volume. * **Volatility:** The sell-off reflects investor fear that a 50% levy would effectively price Bombardier out of the critical U.S. business jet market, its largest revenue driver. **The Dispute Context** * **Gulfstream Status:** The FAA certified the Gulfstream G700 in March 2024 and the G800 in April 2025. * **The Bottleneck:** Reports indicate the delay in Canada stems from technical disagreements—specifically regarding fuel system icing test exemptions granted by the FAA but not yet accepted by Transport Canada. * **Scope:** While the White House later clarified the threat applies to *new* aircraft rather than the existing fleet, the "decertification" language sparked immediate concerns for U.S. regional airlines operating Canadian-made CRJ series jets. **Sector Watch** Analysts warn this escalation could disrupt North American supply chains, noting that over **150** Bombardier Global Express jets are currently registered in the U.S. General Dynamics (Gulfstream’s parent company) remained relatively stable, outperforming the broader aerospace dip.
Silver Drops 17% in Worst Session in 15 Years; Gold Posts Sharpest Decline Since 2013
📉 MARKET BRIEF: Historic Crash in Precious Metals **Warsh Nomination Triggers Massive Reversal** Global commodity markets are reeling from a historic selloff as of **January 31, 2026**. President Trump’s nomination of **Kevin Warsh** as Federal Reserve Chair has upended sentiment, triggering a massive profit-taking wave that erased weeks of gains in a single session. **Gold: Worst Drop Since 2013** Gold prices collapsed approximately **9%**, marking the metal's steepest single-day decline in over a decade. * **Spot prices** plummeted to the **$4,895 – $5,080** range per ounce. * **MCX Futures** saw a vertical drop of nearly **₹11,000 per 10g**, settling around the **₹1.54 lakh – ₹1.60 lakh** levels. * The selloff comes immediately after the metal touched record peaks above **$5,100**. **Silver: Worst Crash Since 1980** The white metal faced a far more brutal correction, crashing approximately **30%** in what analysts are calling the worst trading day in nearly 46 years. * **Spot Silver** dived to near **$83.45** per ounce, down from recent highs exceeding $120. * **MCX Silver** witnessed a historic wipeout, plunging roughly **₹1.06 lakh per kg** to trade near **₹2.93 lakh**. **Key Drivers** * **Dollar Resurgence:** The nomination eased market fears regarding Fed independence, sending the **US Dollar Index (DXY)** surging 0.8% and pressuring dollar-denominated assets. * **Liquidation:** A "sell everything" sentiment took hold as leveraged positions were unwound, exacerbating the slide amid extreme margin pressure. **Outlook** Volatility remains extreme. While the long-term structural drivers for precious metals remain, the immediate technical damage suggests a period of cooling and consolidation as markets digest the new Fed leadership landscape. [What caused the 2026 silver crash?](https://www.youtube.com/watch?v=jH-WluAsnyQ) This video provides relevant context on market reactions to political events and sharp selloffs in gold and silver, similar to the current Kevin Warsh-driven crash. http://googleusercontent.com/youtube_content/0
Trump Nominates Kevin Warsh as Federal Reserve Chair to Replace Powell
**Market Brief: Warsh Nominated as Fed Chair Amid Market Jitters** **Breaking News** President Donald Trump has officially nominated **Kevin Warsh** to lead the Federal Reserve, confirming months of speculation. Warsh, a former Fed governor (2006–2011), is set to replace Jerome Powell when his term expires in **May 2026**. The announcement, made on January 30, signals a potential "regime change" at the central bank, with Warsh expected to align the Fed’s focus more closely with White House economic strategies. **Market Reaction: Immediate Sell-Off** Markets reacted negatively to the news, driven by uncertainty over the Fed's future independence and Warsh's historical hawkishness. * **S&P 500:** Fell approximately **0.8%** to trade near **6,945**. * **Dow Jones:** Dropped roughly **1.0%** (approx. **146 points**). * **Nasdaq:** Slid **1.0%**, led by tech weakness. * **Safe Havens:** Gold prices tumbled over **5%** as the dollar strengthened and yields rose. **Treasury Yields & Rate Outlook** Bond markets signaled caution, pricing in fewer rate cuts. * **10-Year Treasury Yield:** Climbed roughly **5 basis points**, holding above the **4.25%** mark. * **Fed Funds Rate:** Currently holds steady at **3.50%–3.75%** following the January 28 FOMC meeting. * **Inflation Concerns:** Recent data shows December producer prices (PPI) rose **0.5%**, fueling fears that inflation could re-accelerate, complicating the path for future cuts. **Policy Implications** While Warsh has recently advocated for lower rates—aligning with President Trump's demands—investors remain wary. His past reputation as a "hawk" (favoring tighter money to fight inflation) contrasts with his recent commentary. The market is now pricing in a potentially volatile confirmation process and a shift in the Fed's "operating framework" that could challenge the institution's traditional autonomy. **Key Watch** Senate confirmation hearings will be the next major hurdle. Traders are closely monitoring upcoming inflation data to see if the Fed can afford the aggressive rate cuts the administration desires before Warsh takes the helm in mid-2026.