Bearish News
Collection
Dollar Under Pressure Amid Policy Reassessment and Geopolitical Risk
**US Dollar Plunges to Multi-Month Lows Amid Extreme Policy Uncertainty** *** The U.S. dollar is facing a brutal selloff in late January 2026, driven by an acute breakdown of confidence in domestic policy stability. Investors are rapidly shedding long positions, pushing the U.S. Dollar Index (DXY) toward key support levels last seen in 2025. The DXY is currently trading around **97.11**, marking a sharp decline of approximately **2.50%** across the month. This weakness continues the trend from last year, when the index suffered nearly a **10%** annual drop against major currencies. The dollar’s slide against the Euro and other G10 currencies reflects shifting capital flows away from the Greenback, amplified by extreme pre-FOMC positioning. The primary immediate catalyst remains the volatile relationship between Washington and the Federal Reserve. President Trump’s administration has consistently advocated for a significantly weaker currency and lower borrowing costs to fuel domestic growth. This political tension threatens the central bank's institutional autonomy and monetary policy framework. The Federal Reserve’s policy-setting committee is meeting this week, with the Federal Funds Rate currently held in the **3.50%–3.75%** range following three cautious cuts in late 2025. Despite market pricing for aggressive easing, officials have signaled a higher bar for further reductions. The official Fed projection calls for only **one** additional **25 basis point cut** throughout 2026. This disconnect between central bank signaling and political desire heightens market risk. Economic data presents a highly complex picture for the Fed. While the economy continues to show resilience—with the 2026 growth forecast recently upgraded to a strong **2.3%**—the labor market has cooled, and inflation remains sticky, hovering near **3.0%**. This combination complicates the path to the Fed’s **2%** target, making rate decisions fraught with political fallout. The President’s unpredictable policy moves continue to drive currency outflows. Renewed rhetoric on tariffs and aggressive posturing with allies, including controversial moves like the "Greenland theme," have contributed directly to the dollar's recent steep descent. The looming nomination of a new Fed Chair, expected in the coming weeks, further introduces high-level uncertainty, with candidates widely seen as favoring accommodative, lower-rate policies. This climate of domestic instability is accelerating a global shift away from U.S. assets. The trend of de-dollarization is visible across sovereign balance sheets. The US dollar’s share of global foreign exchange reserves has dropped to a **30-year low of 58.5%**. Foreign entities are actively diversifying away from U.S. debt holdings due to geopolitical pressures and concerns over America’s fiscal health. The flight to safety is evident in the commodities complex. **Gold** has surged to historic highs, recently trading above **$5,000 per ounce**. This rally reflects investors' preference for hard assets over currency exposure as a hedge against global uncertainty and the debasement of the U.S. dollar. While the technical picture suggests the DXY’s sharp descent is stalling near the **96.80 to 97.00** support zone, the underlying policy risk remains unresolved. Long-term confidence in the currency is being eroded by the combination of vast U.S. public debt, persistent inflationary pressures, and continued political interference in monetary management. The dollar is facing a period of high volatility, characterized by short-term resilience but a persistent, longer-term bearish bias.

Oil Prices Decline Despite US Winter Storm Curbing Output
Oil Market Briefing: Geopolitical Premium Vs. Supply Surplus The crude oil market is currently defined by a **precarious equilibrium**, with geopolitical risks providing a firm floor under prices while fundamental oversupply pressures exert a consistent downward pull. Benchmark futures are trading in a narrow, volatile range. **Brent Crude** hovers near the **$65.70 per barrel** mark, while **West Texas Intermediate (WTI)** sits slightly below **$60.80 per barrel**. This dynamic reflects a struggle between immediate supply fears and a long-term bearish outlook driven by surging global production. The initial dip in prices, even as a massive **winter storm** severely hampered U.S. energy infrastructure, underscores the market’s resilience to short-term disruptions. Freezing conditions across the Gulf Coast caused major refineries to curtail operations and shut in significant crude output. Analysts estimated the production loss reached as high as **2 million barrels per day** over the peak weekend, roughly **15%** of national output. Yet, prices remained largely subdued, suggesting traders view the weather event as transient against a backdrop of bloated global inventories. *** Geopolitical Risk and the Supply Threat Geopolitical tension remains the primary bullish catalyst, injecting a tangible risk premium into crude pricing. The deployment of a **U.S. aircraft carrier** and supporting naval assets to the Middle East confirms the elevated state of readiness in the region, focusing market anxiety on potential disruption to vital shipping lanes, particularly through the Strait of Hormuz. This military build-up occurs alongside specific supply threats. **Iranian** oil exports have already dropped to approximately **1.6 million barrels per day** in recent months due to intensified pressure and sanctions. Separately, **Venezuelan** crude exports have slumped dramatically, falling to only around **300 thousand barrels per day** in early January following stricter U.S. measures against sanctioned tankers. These cumulative geopolitical impacts act as a continuous check on price declines. *** OPEC+ Policy and Global Output Expansion Attention is squarely focused on the upcoming **OPEC+** meeting, where the group is widely expected to formally **maintain its pause** on oil output increases for the month of March. This policy is a continuation of the alliance’s tactical effort to stabilize the market. The voluntary adjustments from eight key members, totaling **1.65 million barrels per day**, are critical to counteracting the current supply glut. Despite these collective production restraints, the fundamental balance remains in flux due to relentless supply expansion outside the alliance. The **International Energy Agency (IEA)** projects that global oil supply will rise by a substantial **2.5 million barrels per day** in 2026, with non-OPEC+ countries driving the majority of this growth. This expansion is heavily led by the **Americas quintet**—the United States, Canada, Brazil, Guyana, and Argentina. The U.S. shale patch, in particular, has proven highly resilient, maintaining production near record highs and acting as the global swing producer. This robust non-OPEC+ output, combined with the large volumes of oil accumulated in global storage tanks and at sea over the past year, provides a considerable **cushion** against almost any short-term supply outage, explaining why a major weather event failed to trigger a sustained price rally. Ultimately, the crude market is navigating two competing forces: the immediate fear of geopolitical supply loss which supports prices, versus the structural reality of rising output and expanding global inventories that limit upward movement. This tension suggests continued **sideways volatility** is likely in the near term.

Pre-Market Action and Trade Setup
Indian equity markets are set to resume trade today following the Republic Day holiday, facing a **cautious to bearish** outlook fueled by a sharp correction and escalating pre-Budget volatility. Sentiment remains weak as benchmark indices enter the critical Budget week. *** Market Correction and Recent Price Action The past week saw significant distribution, with both headline indices posting sharp declines. The Nifty 50 closed the last trading session down **241.25** points, or **0.95%**, settling at **25,048.65**. Simultaneously, the BSE Sensex tumbled by **769.67** points, ending at **81,537.70**, a **0.94%** drop. This downward pressure confirms a significant pullback from recent highs. The Nifty has suffered a steep correction of over **5%** in just **11** trading sessions. The market slide has been broad-based, with Midcap and Smallcap indices underperforming the frontlines, signaling a risk-off environment across the capital market spectrum. Banking and financial services were major weak spots, with the Nifty Bank index declining by **1.23%** to **58,473.10**. Selling was pronounced in heavyweight stocks, with several index leaders witnessing sharp monthly cuts—for instance, one major industrial stock dropped nearly **12%** and a prominent banking stock fell **7.58%** in January alone. *** Elevated Volatility and Fund Flows Volatility has surged dramatically ahead of the Union Budget 2026-27 announcement. The India VIX, the market’s fear gauge, surged by nearly **25%** last week, reflecting high investor anxiety and expectations for sharp price swings. The VIX level hovering near **14.2** confirms that market participants are actively hedging against potential negative surprises. This elevated VIX indicates that high trading volatility will define the coming sessions. Sustained selling pressure from Foreign Institutional Investors (**FIIs**) remains a major overhang. FIIs have been continuous net sellers, with significant daily outflows exceeding **₹4,000 crore** in recent sessions. This heavy foreign outflow has contributed to the weakening rupee, which recently touched a historic low of **92** against the US dollar. Conversely, consistent buying from Domestic Institutional Investors (**DIIs**) has provided crucial counter-support, preventing a deeper market correction. *** Technical Outlook and Key Levels Technically, the indices display weakness. The Nifty has slipped below its crucial **200-day** Exponential Moving Average, a bearish signal not seen in many months. For the week ahead, the immediate downside risk is defined by the first major support zone for the Nifty, placed around **24,800** to **24,710**. A breach below this level could accelerate the descent towards **24,600**. On the upside, immediate recovery attempts will face stiff resistance. The **25,400–25,450** band is now seen as the key technical hurdle. Only a sustained closing above the higher resistance level of **25,500** would signal a shift in the short-term negative bias. Similarly, Bank Nifty is battling to hold the **58,200** mark. Resistance for the banking index is clustered around **59,300** to **59,400**. *** Budget 2026: The Central Catalyst The immediate focus for the market is entirely on the Interim Budget, expected on February **1st**. This event is the primary driver of volatility. Investors anticipate the government will prioritize fiscal discipline while also injecting measures to support consumption and growth, likely balancing macro stability with growth initiatives. Market expectations are centered on potential relief concerning income tax, possible customs duty realignments, and a continued focus on capital expenditure in infrastructure. With Q3 corporate earnings commentary being mixed and global geopolitical concerns persisting, the Budget narrative is critical. Traders are currently adopting a cautious, range-bound strategy, anticipating substantial price movements immediately after the government’s presentation.
Federal Reserve Holds Rates Amidst Political Scrutiny of Chair Powell
**Market Brief: Federal Reserve Monetary Policy Outlook** The Federal Reserve is signaling a definitive **pause** in its recent interest-rate-cutting cycle, choosing to hold policy steady following three consecutive reductions in late **2025**. This decision arrives as officials convene for their first meeting of **2026**, placing the focus squarely on assessing the cumulative impact of prior easing moves. The current federal funds rate target stands firm at **3.5% to 3.75%**. This range reflects the Federal Open Market Committee’s (FOMC) judgment that borrowing costs are currently positioned at an appropriate level to fulfill its dual mandate of maximizing employment and achieving price stability. The consensus is building for the central bank to maintain this holding pattern for the immediate future. *** The primary justification for the halt stems from a resilient labor market and sticky price pressures. The most recent data showed the **Unemployment Rate** ticking lower to **4.4%** in December, a figure near what the Fed considers full employment. This strength alleviates immediate pressure for deeper cuts to support job growth. Simultaneously, the battle against inflation remains unfinished. The latest reading for headline Consumer Price Index (CPI) inflation was **2.7%** year-over-year in December, with Core CPI at **2.6%**. Although well below the highs of the past two years, these figures still sit persistently above the Fed’s long-term **2.0%** target. Policy makers are now wary that further easing could reignite inflationary pressures, particularly given forecasts for U.S. economic expansion. The Fed has significantly upgraded its projection for Gross Domestic Product (GDP) growth for **2026** to **2.3%**, a substantial jump from earlier estimates. Stronger growth typically argues against rapid rate reductions. *** Deep divisions within the central bank continue to define the path forward. The Fed’s own internal “dot plot” suggests that the median expectation among policymakers is for only **one more 25-basis-point cut** over the remainder of **2026**. This expectation is notably more cautious than market pricing, which is currently factoring in the potential for two to three additional cuts this year. This divergence in outlook highlights the rift: one side of the FOMC views current rates as sufficiently restrictive, while a more dovish faction continues to signal concern about economic fragility and seeks further accommodation. *** The political dimension adds significant uncertainty to the monetary policy landscape. The focus on the Fed’s core mandate comes as it faces intensifying external scrutiny, particularly from the executive branch. With the term of the current Fed Chair expiring in May, the administration is expected to nominate a replacement who is openly supportive of lower interest rates. This dynamic sets up a complex political environment where the Fed’s carefully guarded independence could be tested. Any perception that policy is being swayed by political demands rather than economic data could undermine the credibility of the committee’s decisions, making the path of monetary policy even harder to predict for the rest of the year. For the bond market, the current uncertainty translates to upward pressure on longer-term Treasury yields, as investors demand more compensation for holding debt amid conflicting signals on inflation and policy independence. The coming months are set to be a crucial test of the central bank's commitment to its current, cautious posture.
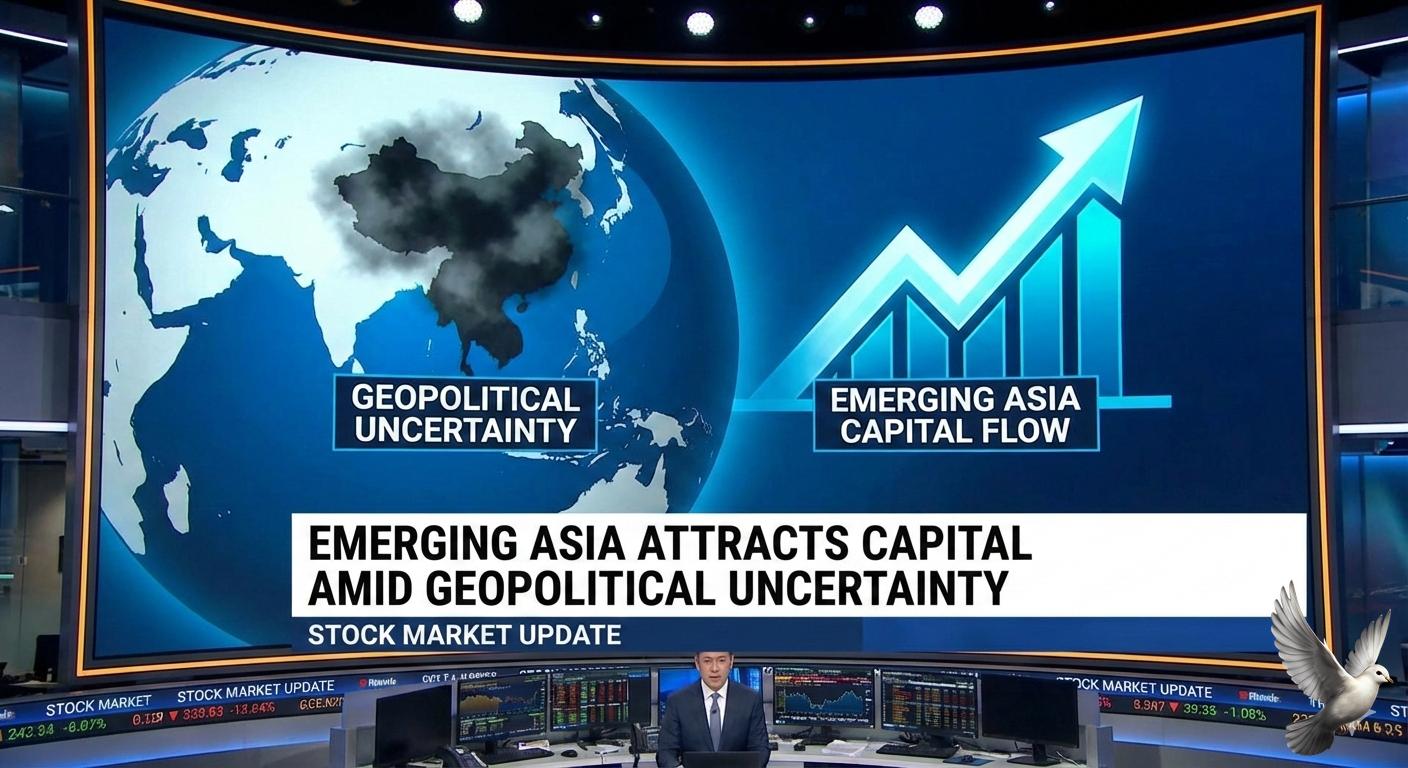
Emerging Asia Attracts Capital Amid Geopolitical Uncertainty
**MARKET BRIEF: ASIA PACIFIC & GLOBAL MACRO — JANUARY 27, 2026** **Geopolitical De-escalation & New Flashpoints** Market sentiment has shifted following the withdrawal of immediate US tariff threats against the European Union, specifically regarding the contentious **Greenland** dispute. This diplomatic de-escalation has temporarily calmed transatlantic volatility. However, risk appetite remains fragile as focus pivots to intensifying instability elsewhere. **Middle East & LatAm Tensions** Capital is rotating away from conflict-sensitive zones. Tensions in the Middle East have spiked with reports of a US naval build-up near Iran, raising fears of a renewed confrontation following the **12-day conflict** in 2025. Simultaneously, political instability in Venezuela is driving regional uncertainty in Latin America. **The "Safe Haven" Trade: Gold & Asia** Traditional safe havens are reacting aggressively. Gold prices have shattered records, surging past **$4,700 per ounce** in January 2026 as investors hedge against "tail risks." Amidst this, Emerging Asia is increasingly viewed as a structural growth haven. Global capital is redirecting toward the region, driven by superior risk-adjusted returns and isolation from Western geopolitical friction. **Regional Market Performance** * **China & Hong Kong:** Leading the region, the Hang Seng and Shanghai Composite have seen renewed inflows. Optimism is fueled by the **15th Five-Year Plan**'s focus on AI, semiconductors, and healthcare innovation. * **Japan:** The Nikkei 225 has faced headwinds, recently trading near **52,800**. Volatility is driven by currency fluctuations (USD/JPY in the lower **154** range) and sector rotation out of exporters. * **India:** After a muted performance in 2025, Indian equities are positioned for a 2026 turnaround, supported by domestic consumption and policy continuity. **Strategic Outlook** Investors are repricing assets to favor growth-oriented Asian markets. The region's pivot toward high-tech manufacturing and self-reliance offers a buffer against the stagflationary risks currently threatening Western economies. While short-term volatility persists, the fundamental rotation into Asian equities remains a dominant theme for Q1 2026.

Stock Analysis: Two Buy-Rated Picks with Potential for 11% Upside
📉 Indian Market Brief: Downtrend Persists Amid Sectoral Sell-Off Indian benchmark indices concluded the last trading session on a **bearish note**, reflecting sustained selling pressure and heightened risk aversion. --- Key Index Performance The **Nifty 50** closed at **25,048.65**, registering a sharp decline of **0.95%** (a fall of 241.25 points) on Friday, January 23, 2026. This drop confirmed a crucial technical breach, with the index **slipping below its 200-day moving average**. Similarly, the **BSE Sensex** plunged **0.94%**, settling at **81,537.70**. The broader market mirrored this weakness, with **BSE Midcap** and **Smallcap** indices suffering even steeper losses of approximately **4%** and **6%**, respectively, over the week. --- Sectoral Weakness and Outflows The downturn was broad-based, led prominently by **Banking**, **Energy**, and **Auto** stocks. The **Nifty Bank** index was a major laggard, closing lower by **1.23%** at **58,473.10**. The **Nifty Financial Services** index also saw a significant fall of **1.21%** at **26,821.35**, with heavyweights like HDFC Bank and ICICI Bank facing pressure. The **Nifty Auto** index closed down **1.13%**, while the **Nifty Energy** index, which includes companies like Reliance Industries and ONGC, also contributed to the overall decline. **Foreign Institutional Investors (FIIs)** continued their trend of paring exposure, maintaining their status as net sellers and exacerbating the market weakness. --- Technical Indicators and Volatility The technical picture remains **cautious**. The Nifty's decline below the 200-day moving average is a classic indicator of continued weakness and potential for further downside correction toward the **25,000** psychological support mark. Market volatility, measured by the **India VIX**, surged **6.31%** to **14.19**, indicating increased market apprehension and expectation of wider daily swings. The market breadth was also poor, with a ratio of advances to declines heavily skewed toward the latter. --- Outlook and Key Triggers The immediate market outlook is one of **cautious to negative bias**. Investors are advised to be highly selective, focusing on stock-specific opportunities rather than a broad market recovery. The **Union Budget for FY27** is the next major domestic trigger, with expectations leaning towards fiscal prudence and a continued focus on capital expenditure. Globally, persistent geopolitical fragmentation and policy uncertainty add to the downside risks. While analysts foresee a potential **earnings recovery in 2026** driven by domestic strength, the current elevated Price-to-Earnings (P/E) ratio of the Nifty 50 around **21.8** suggests valuations are not cheap, necessitating a disciplined investment approach.

US-India Trade Deal Stalls Over Currency Dispute
The casual observer saw only bureaucratic hesitation. Yet, for those monitoring the flow of global capital, the silence on the line masked a **thunderous shift**—the fundamental unwinding of the global economic order forged over the last three decades. This is not a traditional cyclical downturn but a structural realignment driven by two opposing forces: **geopolitical fragmentation** and **unprecedented technological supremacy**. *** The Price of Fragmentation Geopolitical risk is now a permanent feature of macroeconomic planning, acting as a direct tax on cross-border investment. Political instability and increasing trade barriers have fueled protectionist policies, causing a significant shift in capital flows. Investors are executing a **"flight home"** effect, pulling funds out of regions deemed politically sensitive and concentrating capital in advanced, familiar markets. This behavior has driven up the cost of capital for vulnerable emerging and developing economies. While global GDP growth for 2026 is projected to remain resilient at **3.3%**, this headline figure hides significant divergence. Investment decisions are increasingly prioritizing political stability over raw economic return, fragmenting supply chains and reshaping debt markets. Long-term government bond yields, such as the UK 10-year gilt, surged to highs of **4.8%** last year, reflecting the higher risk premium investors now demand for holding debt amid fiscal and geopolitical uncertainty. *** AI: The Engine of Resilience The counterweight to this friction is the immense tide of technology-led investment. Massive capital expenditure, focused overwhelmingly on artificial intelligence and digital infrastructure, is offsetting the drag from trade tensions and slowing industrial demand. This wave of AI investment is fueling a **bullish outlook** for global equities in 2026. However, the gains are narrowly concentrated. Equity markets display a widening gap between the performance of a handful of dominant technology giants and the rest of the market, raising concentration risk to elevated levels. *** Sticky Prices and Monetary Stance Central banks globally are maneuvering through a tricky phase where disinflation has stalled. Global headline inflation is forecast to ease toward **3.8%** this year, but the path remains uneven and challenging. The United States faces particularly stubborn price pressures, with core inflation figures hovering near **3.0%**. This stickiness, driven in part by domestic cost pressures and the pass-through of recent tariffs, means the US Federal Reserve is expected to remain cautious. Market consensus anticipates only two further policy rate cuts throughout the year, projecting the target range to settle between **3.00% and 3.25%** by year-end 2026. Conversely, some large emerging economies have found room to loosen policy. The Reserve Bank of India, for example, has already initiated an easing cycle, dropping its key repo rate to **5.25%** as of late 2025 to underpin domestic growth amid cooling local inflation forecasts. The narrative is clear: the post-pandemic cycle of aggressive tightening is over, but the era of cheap, easily accessible capital has not returned. The world’s financial architecture is navigating a precarious equilibrium between technology-driven growth and geoeconomic division.

Union Budget Expectations, Q3 Earnings, and Key Factors Likely to Influence Market Trends This Week
A sweeping wave of risk aversion has engulfed the market, triggering a sharp and broad-based sell-off that resulted in significant wealth erosion across nearly all segments. This downturn confirmed a decisive shift in investor sentiment, pushing frontline indices to their steepest weekly fall in **four months**. The main benchmarks failed to hold critical support levels. The S&P BSE Sensex shed over **760 points** to close near **81,537**, while the CNX Nifty lost more than **240 points**, settling just above the **25,000** mark. In a single recent session alone, the Nifty declined **1.38%**, highlighting the accelerating pace of the correction. *** Deep Erosion in Broader Markets While large-cap stocks showed relative resilience, the damage was overwhelmingly concentrated in the higher-beta segments of the market. The core theme of this downturn is the pronounced pain felt by small and mid-cap stocks, validating the earlier observations of systemic weakness. The broader indices posted alarming figures for the week, with the BSE SmallCap index plummeting a staggering **9%**. The BSE Midcap index followed closely, recording a sharp decline of **5.7%**. This erosion is far more severe than the headline indices suggest, emphasizing the extent of the flight to quality. The downturn has been brutal and widespread. Recent data indicates that nearly **80%** of the stocks within the Nifty Smallcap 250 index are now trading over **20%** lower from their recent peaks. Moreover, over **600 small-cap stocks** have already registered double-digit losses since the beginning of the year. This aggressive de-rating follows a period of rapid outperformance, signaling an inevitable valuation reset. *** Sectoral Indices Register Universal Declines The sell-off proved comprehensive, with all sectoral indices finishing in negative territory. The clear risk-off environment impacted segments sensitive to economic cycles and high valuations the hardest. The **Nifty Realty** index bore the brunt of the weekly pressure, collapsing by more than **11%**. This significant drop reflects heightened caution regarding leveraged sectors and high-growth bets. The **Nifty Consumer Durables** sector also faced heavy selling, declining **6.5%**. Other key sectors saw substantial cuts: **Nifty Media** dropped around **4%**, while the Oil & Gas, Energy, Infra, Defence, and Healthcare sectors all registered losses of approximately **3%** or more. Even the relatively stable Nifty Bank index saw pressure, declining nearly **1%** in one session, confirming the lack of safe havens in the current environment. *** Macroeconomic Pressures Intensify Selling The systemic weakness is underpinned by a confluence of macroeconomic factors and shifts in capital flows. A primary driver has been the aggressive stance of Foreign Institutional Investors (FIIs), who turned net sellers, offloading equities worth approximately **₹14,651 crore** during the week. While Domestic Institutional Investors (DIIs) attempted to cushion the blow with strong buying, their support was insufficient to neutralize the foreign exodus. Compounding the pressure, the Indian rupee has continued its downward trajectory against the US dollar, breaching the psychologically significant **92** mark and hitting record lows. A rapidly weakening currency typically fuels FII selling and raises concerns about imported inflation. Furthermore, specific corporate developments and ongoing valuation concerns contributed to the fragile sentiment. Select heavyweight stocks, particularly those facing renewed regulatory scrutiny, saw dramatic single-day declines exceeding **10%**. This highlighted how pockets of fear can rapidly transmit instability across the entire market structure. The current phase demands intense selectivity as the market corrects the over-exuberance witnessed in prior years.

Gold Price Rally: Drivers and Outlook toward $\$5,000$
Global Markets Brief: Gold Smashes Historic $5,000 Barrier **Spot Market Surge** Gold prices have shattered historical records in early trading this week, surging past the psychological **$5,000 per ounce** mark to hit an intraday high of **$5,032**. This represents a blistering **64%** annual gain, signaling a full-blown bull market for precious metals. Silver has followed suit, breaking its own record to trade near **$100 per ounce**. **Indian Market Impact** In the domestic market, the rally is equally aggressive. On the MCX, gold futures have crossed **₹1.61 lakh per 10g**, while spot prices for 24-karat gold in major cities like Mumbai and Kolkata are holding firm at approximately **₹1,60,260**. Silver is trading near **₹3.35 lakh per kg**, reflecting sustained industrial and investment demand. **Geopolitical Drivers & Trade Tensions** The convergence of geopolitical frictions is the primary engine behind this ascent. Tensions have escalated following the U.S. administration's renewed push to acquire Greenland, triggering diplomatic spats with Europe and threats of a **10% tariff** on select European nations. Simultaneously, instability in Venezuela and persistent friction in the Middle East have compounded risk aversion, driving capital aggressively toward safe-haven assets. **Shift Away from U.S. Assets** A distinct "Sell America" sentiment is emerging among institutional investors. Reports indicate that major Northern European pension funds are reducing exposure to U.S. Treasuries, citing concerns over spiraling U.S. debt and policy unpredictability. This rotation is weighing on the dollar and amplifying gold's appeal as the ultimate hedge against fiat debasement and sovereign credit risk. **Central Bank & Monetary Outlook** Structural support remains robust as central banks continue to diversify reserves. The People's Bank of China has extended its buying streak, now exceeding **14 consecutive months** of accumulation. Market pricing also suggests aggressive Federal Reserve easing in **2026**, with investors betting that lower real yields will further fuel the rally. Analysts at major banks have revised their year-end targets, with some forecasting a push toward **$5,400** if current momentum holds.
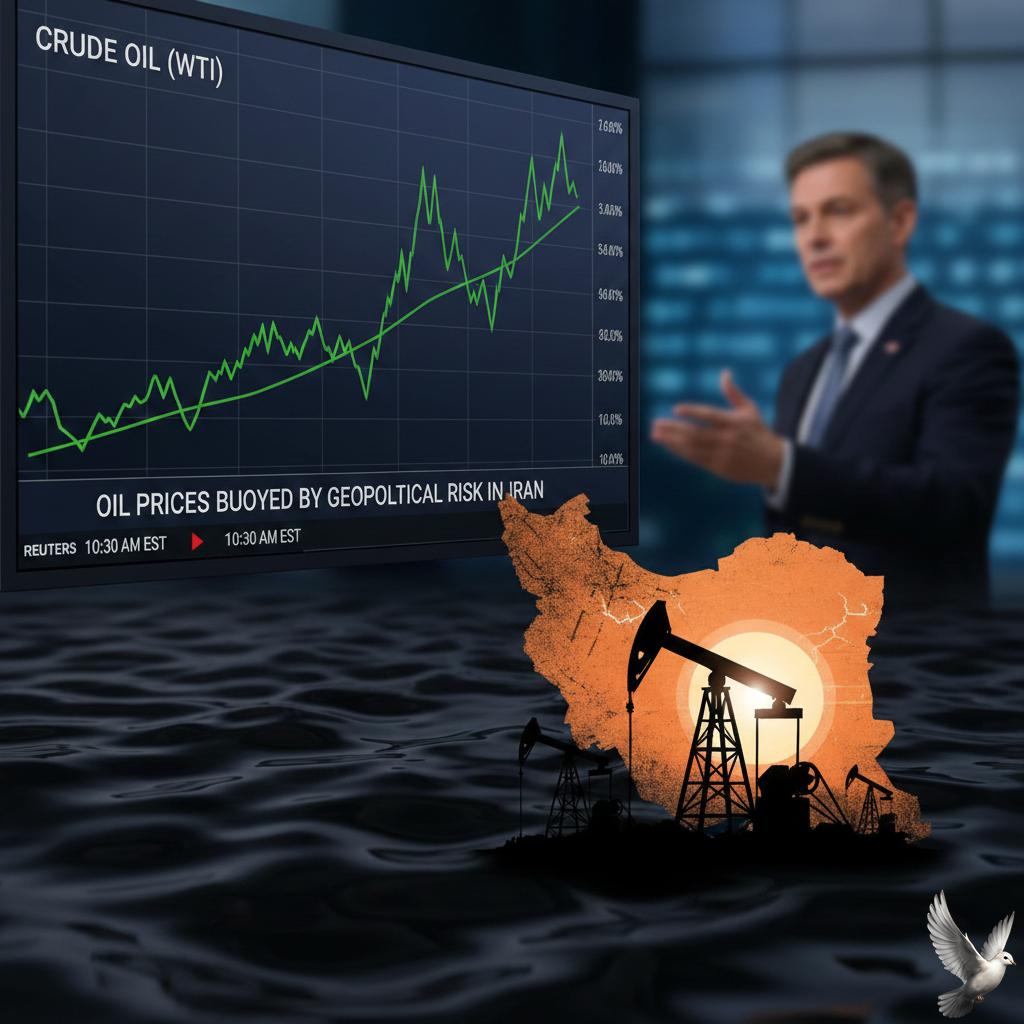
Oil Prices Buoyed by Geopolitical Risk in Iran
**CRUDE RALLY EXTENDS AS IRAN TENSIONS ECLIPSE SUPPLY CONCERNS** Global oil prices surged, extending a strong upward trend into the new week. The market is overwhelmingly focused on escalating geopolitical risk in the Middle East, a factor that is currently overshadowing structural supply concerns. Both major benchmarks recorded substantial gains on Friday, capping a **fifth consecutive week** of rising prices. Brent crude futures moved sharply, settling near **$65.88** per barrel. West Texas Intermediate (WTI) followed suit, pushing back above the **$61** mark, last trading around **$60.90** per barrel. The immediate catalyst for the upward pressure is the rapid escalation of rhetoric and military positioning between the United States and Iran. Geopolitical risk premiums increased sharply after the US deployed a naval carrier strike group toward the region. This military presence was coupled with renewed political pressure from US President Donald Trump, who revived threats directed at Tehran and announced new sanctions targeting Iranian oil transport vessels. Iran remains a critical supply factor, ranking as OPEC’s **fourth-largest producer**. Analysts estimate any sustained disruption to Iran’s output of approximately **3.3 million barrels per day** could trigger an immediate and significant price spike. The crucial **Strait of Hormuz**—through which roughly **20%** of global petroleum liquids transit—remains the market’s core chokepoint vulnerability. Adding to the supply-side stress are fresh, severe disruptions in Eurasian production. While initial reports suggested that Kazakhstan's main export pipeline was resuming operations, new supply shocks from the region are keeping the market tight. Ongoing outages in Kazakhstan, including a recent fire at the crucial Tengiz oilfield, have severely constrained output. The country’s production is estimated to average only **1 to 1.1 million barrels per day** this month, significantly below its typical rate of **1.8 million barrels per day**. This production loss, estimated at up to **900,000 barrels per day**, reinforces supply anxieties, effectively nullifying any positive market sentiment from isolated pipeline repair progress. Looking beyond immediate headlines, the market structure still presents a fundamental headwind to sustained high prices. Despite the geopolitical noise, the overall supply picture is one of looming surplus. The International Energy Agency (IEA) continues to project a substantial global **supply surplus** for the year ahead, expecting global stockpiles to swell by **3.7 million barrels per day**. This structural overhang is supported by record output from North America. US crude production forecasts have been revised upward, expected to reach a record **13.59 million barrels per day**. The US Energy Information Administration (EIA) recently reported a build in national crude inventories of **3.6 million barrels**, exceeding consensus expectations. However, two secondary factors are currently providing additional buoyancy. The US Dollar recently recorded its weakest performance in seven months. A depreciating dollar makes dollar-denominated crude cheaper for international buyers, boosting physical demand. Secondly, a severe winter storm across the United States is spiking demand for refined products. This cold snap is driving up prices for heating oil and diesel, supporting the entire petroleum complex. In summary, the oil market remains a battleground where high-stakes geopolitical tension is consistently overpowering bearish structural signals like record US supply and the looming global inventory surplus. Prices will continue to trade on headline risk as long as the US-Iran situation remains unresolved.
Yen Gains on Intervention Watch
**Global Market Brief: Yen Surges on Intervention Alert** **USD/JPY Plunges as Intervention Risks Escalate** The US dollar opened significantly lower in early trading this Monday, January 26, 2026, driven by an aggressive rally in the Japanese yen. The **USD/JPY** pair has dropped sharply to trade around **154.13**, retreating from recent highs near **158.00**. This sudden strengthening of the yen — a move of over **1.6%** in recent sessions — reflects a market on high alert for immediate currency intervention. Speculation reached a fever pitch following reports that the **Federal Reserve Bank of New York** conducted "rate checks" regarding the yen late last week, a move often interpreted as a precursor to joint official action between Washington and Tokyo. **Official Warnings Amplify Volatility** Japanese authorities have intensified their rhetoric. Prime Minister **Sanae Takaichi** explicitly warned on Sunday that the government is prepared to take "all necessary measures" to combat speculative and abnormal currency movements. This jawboning has triggered a squeeze on short yen positions, with traders rapidly cutting dollar exposure to avoid being caught on the wrong side of potential Ministry of Finance action. **Dollar Index and Gold React** The broader weakness in the greenback is visible in the **US Dollar Index (DXY)**, which has slipped to approximately **97.24**. The softness in the dollar is providing a tailwind for commodities, with **Gold** shattering records to top **$5,000 per ounce** for the first time, signaling a flight to safety amid currency instability and geopolitical friction. **Federal Reserve Meeting & Leadership Uncertainties** Investors are treading carefully ahead of the Federal Open Market Committee (FOMC) meeting scheduled for **January 27–28**. While policy decisions are central, market attention is heavily distracted by the unprecedented political pressure on the central bank. Reports indicate that President Trump may announce a nominee for the next **Federal Reserve Chair** in the coming days, potentially as early as this week. The backdrop includes threats of legal action against current Chair **Jerome Powell**, creating a layer of institutional uncertainty that is weighing on US assets. The convergence of a pivotal Fed meeting, leadership speculation, and intervention threats has created a fragile trading environment for the week ahead. **Short-Term Outlook** Volatility is expected to remain elevated. The market is effectively pricing in a high probability of "stealth" or overt intervention if the yen weakens back toward the **155.00** handle. Traders are likely to remain defensive, prioritizing liquidity and safe-haven assets until the Fed's policy stance and leadership future are clarified midweek. [Fed 2026 Expectations and Leadership Changes](https://www.youtube.com/watch?v=txHwst3KVY8) This video provides essential context on the projected policy shifts and personnel changes at the Federal Reserve for 2026, which are currently driving market sentiment. http://googleusercontent.com/youtube_content/0

Yen Gains on Intervention Risks; Gold Surpasses $5,000/oz
Gold has achieved a historic milestone, surging past the psychological **$5,000 per ounce** threshold early this Monday morning. The move comes as global financial stability concerns drive capital into safe-haven assets, marking an unprecedented period of ascent for the yellow metal. This price action extends a relentless rally. Spot gold is trading at approximately **$5,024.95** per ounce, an increase of **0.85%** in the current session alone. This monumental climb is underpinned by massive investor reallocation, building on a robust **64%** gain throughout the previous year, with the metal already up more than **16%** year-to-date in 2026. *** The primary catalyst remains escalating geopolitical friction. Tensions over the proposed US acquisition of **Greenland** continue to rattle sentiment across major economic blocs. This controversy has led directly to market anxiety surrounding US President Donald Trump’s administration and his latest aggressive tariff policies. The threat of blanket **10%** tariffs on certain European nations—and the possibility of rates rising to **25%** by June—has stoked fears of a full-scale trade war between NATO allies. This uncertainty fuels gold’s fundamental role as a protective hedge against global financial disruption and trade conflict risk. *** Macroeconomic indicators are reinforcing this bullish structural shift. The US dollar index (DXY) is trading near a four-month low at **97.224**. A weaker dollar is pivotal, making dollar-denominated gold more accessible and attractive to international buyers. Furthermore, markets are on tenterhooks regarding bond performance and monetary policy. While a rout in the bond market has pressured fixed income assets, expectations for continued US monetary policy easing are boosting non-yielding bullion. The Federal Reserve’s benchmark rate stood at **3.75%** at the end of 2025, and anticipated cuts in 2026 provide significant tailwinds for gold’s momentum. Currency volatility is also playing a critical role. Violent spikes in the Japanese yen, driven by concerns over potential US involvement in currency intervention, signal deep instability in major global currency pairs. The yen firmed **0.5%** against the dollar, currently trading around **154.84**, a dynamic that often correlates with increasing safe-haven demand for gold. *** Institutional activity confirms the sustained structural demand. Central banks across the globe continue their record buying spree, accumulating gold reserves at an elevated pace. China, for instance, has extended its gold purchases for a **fourteenth consecutive month**. These official sector flows reflect a broader global strategy to diversify away from traditional reserve assets amid geopolitical risks and growing sovereign debt concerns. Investor appetite is equally robust, demonstrated by sustained, heavy inflows into gold Exchange-Traded Funds (ETFs). *** The momentum is visible across the entire precious metals sector. Silver has also soared to historic levels, climbing above the **$100 per ounce** psychological barrier for the first time. The spot silver price is currently around **$104.72** per ounce, reflecting its role as both a monetary metal and an increasingly tight industrial commodity. Other metals are following suit, with platinum posting a gain of **4.77%** to trade at **$2,872.00** per ounce. The prevailing market outlook remains decidedly bullish. Analysts are forecasting further gains for the metal, with expectations for gold to remain well supported throughout the year. Initial price targets suggest gold could approach **$5,300** before the close of the first quarter, while major institutional forecasts project an average price of **$5,055** per ounce by the final quarter of 2026.

Natural Gas Price Surge Squeezes Bearish Winter Positions
**Market Brief: Winter Volatility Spike (January 2026)** **Global Gas Markets in Turmoil** A severe, unanticipated "brutal freeze" has gripped North America this week, shattering the mild-winter thesis that traders relied on for months. The sudden weather shift has triggered a violent short squeeze, sending natural gas prices vertical and forcing a chaotic realignment of global LNG flows. **US Prices & Production** * **Price Surge:** Henry Hub spot prices nearly tripled from early-winter lows, hitting **$8.15/MMBtu** on January 22. * **Futures Rally:** US natural gas futures spiked **~70%** in a single week—the most dramatic weekly gain on record. * **Supply Crunch:** Freezing temperatures have triggered "freeze-offs" in key production basins, cutting output by nearly **3 Bcf/d**. * **Record Activity:** Panic buying to cover short positions pushed CME trading volumes to an all-time high of **2.57 million** contracts in a single day. **Europe & Asia Divergence** The volatility has spilled over into the Atlantic basin, widening the spread between European and Asian indices. * **European Premium:** Dutch TTF futures rallied **~30%** week-on-week to **€38.22/MWh** (~$13.17/MMBtu), driven by critically low storage levels (now under **50%**) and anxiety over US export delays. * **Asia Priced Out:** The Asian JKM benchmark trails at **$11.22/MMBtu**. With Europe commanding a premium of nearly **$2.00/MMBtu** over Asia, price-sensitive Asian buyers are retreating from the spot market. **Logistics & Rerouting** Real-time tracking confirms that LNG tankers are abandoning routes to Asia to chase higher yields in Europe. * **Cargo Diversions:** Vessels like the *Clean Resolution* (originally bound for the Philippines) and *Zoe Knutsen* have abruptly changed course mid-voyage, redirecting supplies toward UK and Turkish terminals. * **Market Outlook:** Traders remain in "panic mode" as forecasts predict the deep freeze will persist through late January, threatening further pipeline disruptions and continued volatility. *** **Next Step:** I can generate a comparison chart of the Henry Hub vs. TTF price spread over the last 30 days to visualize the arbitrage window.
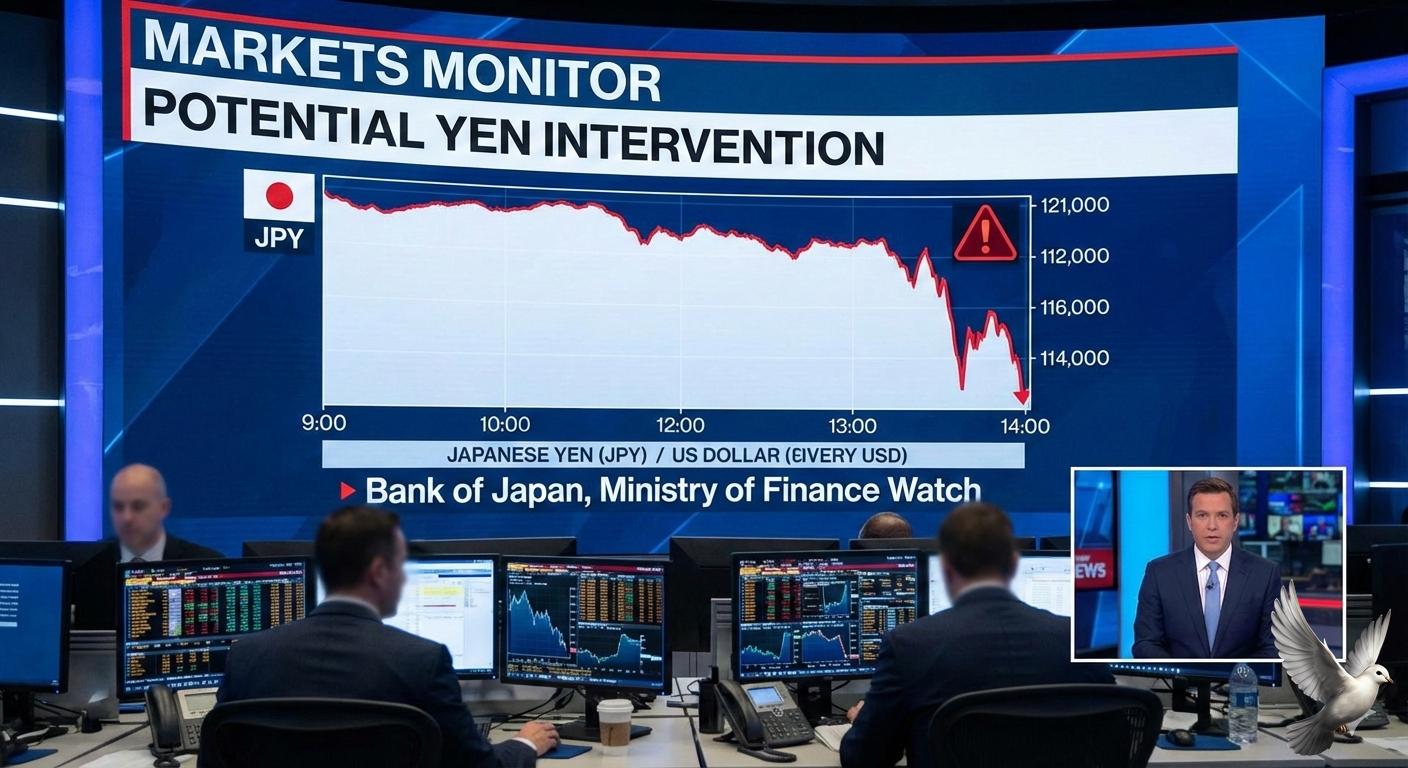
Markets Monitor Potential Yen Intervention
**USD/JPY: Intervention Watch & Volatility Alert** **Date:** January 26, 2026 **Executive Summary** The Japanese yen (JPY) has entered a critical volatility zone against the US Dollar (USD), driven by heightened speculation of coordinated government intervention. Traders are on high alert following confirmed "rate checks" by the Federal Reserve Bank of New York, a move widely interpreted as a precursor to potential joint action between Tokyo and Washington to stabilize the currency. **Market Price Action** * **Current Levels:** USD/JPY is trading in the **154.20 – 155.70** range, pulling back sharply from recent highs near the psychologically significant **160.00** level. * **Recent Movement:** The pair experienced a rapid decline (yen strengthening) of over **1.0% to 1.75%** late last week, marking its sharpest daily adjustment since August. * **Key Drivers:** The sudden drop was triggered by reports of US authorities inquiring about exchange rates, spooking short sellers and prompting a wave of position unwinding. **Policy & Economic Context** **Bank of Japan (BOJ) Decision:** The BOJ maintained its policy rate at **0.75%** on January 23, opting to hold steady ahead of the upcoming February 8 general election. While the bank upgraded its inflation outlook for FY2026, it refrained from signaling an immediate rate hike, leaving the yen vulnerable to yield differentials. **Government Stance:** Japanese Prime Minister **Sanae Takaichi** has issued a stern warning regarding "abnormal" market movements, stating the government is prepared to take "decisive action" against speculative trading. This marks a shift in tone, suggesting a lower tolerance for currency depreciation than previous administrations, particularly as rising import costs impact domestic sentiment. **Outlook & Risks** * **Intervention Risk:** The involvement of the NY Fed suggests that any potential intervention could be bilateral, significantly amplifying its impact compared to unilateral action by Japan. * **Bond Market Stress:** Japanese Government Bond (JGB) yields have seen record volatility, complicating the BOJ's path and adding pressure on the yen. * **Immediate Focus:** Markets remain highly sensitive to headlines. A breach below **154.00** could signal further unwinding of carry trades, while a return toward **158.00** may invite actual intervention.
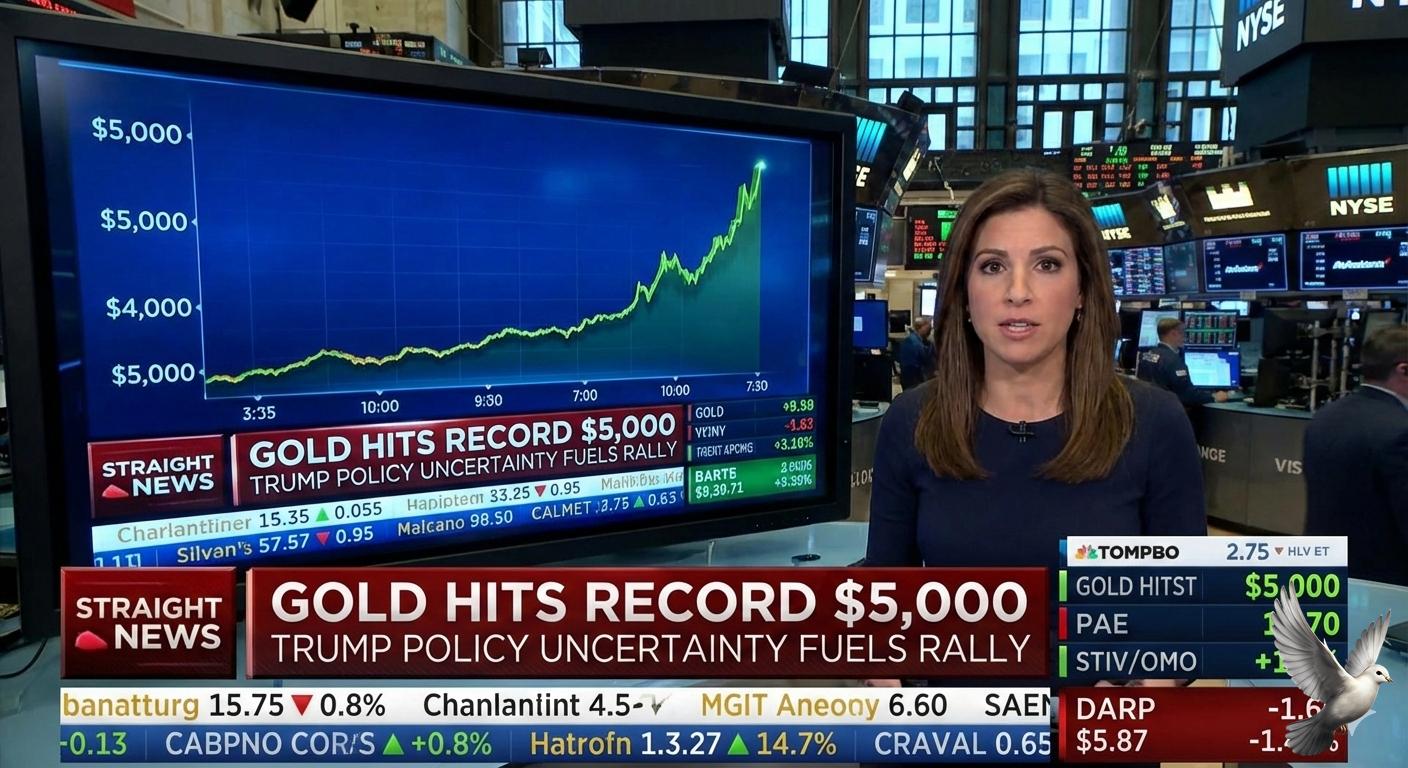
Gold Reaches Record $5,000 Amid Trump Policy Uncertainty
**MARKET UPDATE: GOLD BREACHES $5,000** **Historic Price Action** Gold futures have officially shattered the **$5,000 per ounce** barrier, reaching an intraday high of **$5,029** this week. The yellow metal is currently trading in uncharted territory, having surged approximately **79%** over the past year. This is no longer just a rally; it is a historic repricing of the world's premier safe-haven asset. **The "Sell America" Trade** The primary catalyst is a resurgence of the "Sell America" trade. Global investors are aggressively rotating out of US-denominated assets, spooked by escalating trade tensions. President Trump's recent tariff threats—targeting key partners like Canada, China, and Mexico—combined with geopolitical friction regarding Greenland, have severely rattled market confidence. **Currency and Fed Pressure** The US Dollar is under heavy pressure, slipping against major rivals like the Yen. Simultaneously, the Federal Reserve faces an impossible balancing act: sticky inflation data is clashing with a stagnating labor market. Growing anxiety over the Fed's political independence is further accelerating the flight away from fiat currency and into hard assets. **Broader Precious Metals Boom** Gold is not acting alone. Silver has delivered even more explosive gains, recently topping **$100 per ounce** for the first time. The white metal is up over **200%** year-on-year, driven by dual demand as both a monetary hedge and a critical industrial component for the green energy transition. **Investor Sentiment** Fear is currently the dominant driver. With equity futures stumbling and bond yields volatile, capital is fleeing risk assets. The traditional inverse relationship between rates and gold has broken down; investors are buying bullion regardless of yield, prioritizing capital preservation above all else. --- ... [Gold & Silver Outlook 2026: Impact of Trump Policies](https://www.youtube.com/watch?v=cTiaCZch8Ag) ... This video provides a relevant analysis of the commodity boom in 2026, specifically discussing how Trump's "America First" policies and inflation expectations are fueling the record-breaking rally in gold and silver. http://googleusercontent.com/youtube_content/0

Nifty Outlook and Pre-Budget Trading Strategy
**Market Brief: Pre-Budget Caution Deepens** **Date: January 25, 2026** **Market Pulse** Market sentiment has turned critically fragile ahead of the Union Budget on February 1. The Nifty 50 has breached the psychological **200-day moving average (DMA)** support, closing at **25,048.65** after shedding **241** points. This technical breakdown signals heightened bearish dominance, amplified by relentless foreign outflows and currency weakness. **Key Triggers** * **FII Exodus:** Foreign Institutional Investors (FIIs) have extended their selling streak to **13 consecutive sessions**, offloading over **₹36,000 crore** in January alone. * **Currency Pressure:** The Indian rupee has hit a fresh lifetime low of **91.99** against the US Dollar, exacerbating concerns over inflation and external balances. * **Sectoral Stress:** Selling is broad-based, with Realty and PSU Banks leading the decline. **Expert Strategy: LKP Securities** Rupak De, Senior Technical Analyst at LKP Securities, highlights the following for the January expiry: * **Trend:** The index is firmly under bearish control below the 200-DMA (approx. **25,160**). * **Critical Levels:** * **Support:** Immediate defense lies at **25,000–24,900**. A decisive break here could open downside targets toward **24,700**. * **Resistance:** Any relief rally is likely to face stiff selling pressure near **25,300–25,500**. * **Approach:** Traders are advised to adopt a "sell on rise" strategy. Aggressive long positions should be avoided until the index decisively reclaims the **25,300** mark. **Outlook** Volatility is expected to spike further as the Budget approaches. The primary trend remains weak, and sustaining above **25,000** is crucial to prevent a deeper sell-off. ----- **Next:**

Top 9 of 10 Most Valued Firms' Market Cap Drops by ₹2.51 Lakh Cr; RIL Leads Decline
A broad-based sell-off in domestic equities has severely impacted India's market heavyweights, resulting in a substantial erosion of investor wealth. The combined market valuation of nine of the nation's **top-10 most valued firms** saw a sharp slump last week, collectively plunging by over **Rs 2.51 lakh crore**. This sharp correction reflects elevated pressure across the broader market, driven by persistent selling in key sectors. Reliance Leads the Decline **Reliance Industries (RIL)**, the market leader by valuation, bore the brunt of the correction. The conglomerate's market capitalization tumbled by a massive **Rs 96,960.17 crore**. This heavy loss underscores the volatility facing large-cap stocks following mixed corporate results and broad profit-booking sentiment. Despite the recent dip, RIL retains its position as the country's most valued company, holding a current market capitalization exceeding **Rs 18.75 lakh crore**. Sectoral Impacts The rout was comprehensive, affecting firms across finance, technology, and telecom. **Financial stocks** contributed significantly to the overall loss. **ICICI Bank** saw its valuation erode by **Rs 48,644.99 crore**, while **HDFC Bank** tanked by **Rs 22,923.02 crore**. The downward pressure was also prominent in the technology space. **Tata Consultancy Services (TCS)** dropped **Rs 16,588.93 crore** in valuation, and **Infosys** saw its MCap dive by **Rs 7,810.77 crore**. This reflects sector fatigue and global softness in IT demand. **Bharti Airtel** also diminished, losing **Rs 17,533.97 crore**, with **Bajaj Finance** recording a decline of **Rs 14,093.93 crore**. Index Performance and Key Drivers The sell-off in large-cap stocks directly translated into sharp declines for benchmark indices. The BSE Sensex tanked over **2,032 points**, registering a weekly fall of **2.43%**. Meanwhile, the Nifty 50 also dropped significantly, reflecting the depth of the market correction. The core reasons fueling this downturn included escalating global geopolitical tensions and a highly cautious stance from foreign institutional investors (FIIs). FIIs continued to be net sellers, withdrawing substantial capital from Indian equities in January. Further pressure stemmed from a depreciating rupee and reports of subdued performance in corporate earnings across various sectors. The confluence of these factors has unsettled investor confidence and kept bears firmly in control of the trend. The Single Outlier Amidst the widespread losses, only one firm among the top ten managed to post gains. The consumer goods giant, **Hindustan Unilever (HUL)**, bucked the negative trend, climbing by **Rs 12,311.86 crore** in valuation. This highlight suggests a flight towards defensive, consumption-focused sectors during times of market uncertainty.

Q3 Earnings, Fed Rate Decision, Union Budget to Drive Market Direction This Week
**MARKET BRIEF: WEEK AHEAD (JAN 26–30, 2026)** **Overview** Indian equity markets face a critical, abbreviated trading week (closed **Monday, Jan 26** for Republic Day). Volatility is expected to peak as investors navigate a "trifecta" of high-impact triggers: the US Fed decision, Union Budget 2026-27, and major corporate earnings. **Current Market Status** * **Indices:** Nifty 50 closed at **25,049** (-0.95%) and Sensex at **81,538** (-0.94%) on Friday, ending a volatile week on a weak note. * **Sentiment:** Bearish pressure persists, driven by 13 consecutive sessions of FII selling and the Rupee hitting a record low of **~91.99** against the USD. * **Support Levels:** Nifty has slipped below the psychological **25,100** mark; key support is seen at **24,880**. **The Big Three Triggers** **1. US Fed Interest Rate Decision (Jan 27–28)** * The FOMC meets midweek with markets pricing in a high probability of a **rate pause** (holding at 3.5%–3.75%). * **Focus:** Investors will scan the commentary for cues on the 2026 rate-cut trajectory, especially given recent mixed US labor data. * **Impact:** A hawkish pause could trigger further FII outflows from emerging markets like India. **2. Union Budget 2026-27 (Feb 1)** * Finance Minister Nirmala Sitharaman will present the budget on **Sunday, Feb 1**. * **Expectations:** Focus on fiscal consolidation (targeting deficit ~4.2–4.4%), sustained capex in **Infrastructure** (Roads, Railways), **Defence**, and potential consumption boosters for the rural economy. * **Sector Watch:** Infrastructure, Defence, PSU Banks, and Green Energy stocks are likely to see heightened activity pre-budget. **3. Q3 Earnings Rush** Market heavyweights scheduled to report this week will dictate sector-specific moves: * **Tuesday (Jan 27):** Asian Paints, Tata Consumer, Bajaj Finance. * **Wednesday (Jan 28):** **Larsen & Toubro (L&T)**, **Maruti Suzuki**, SBI Life. * **Thursday/Friday:** ITC, NTPC, Sun Pharma. **Key Watchouts** * **FII Flows:** Foreign investors have offloaded over **₹36,000 crore** in January alone. A reversal is critical for a sustained recovery. * **Currency:** The Rupee's trajectory near **92/$** will be closely monitored for impact on IT and Pharma sectors. * **Global Cues:** US tech earnings and crude oil prices will act as secondary drivers. **Outlook** Expect a choppy 4-day week as the market consolidates ahead of the Sunday Budget. Traders are likely to remain cautious, with aggressive positioning expected only after the Fed's commentary and Budget announcements clarify the macro path.
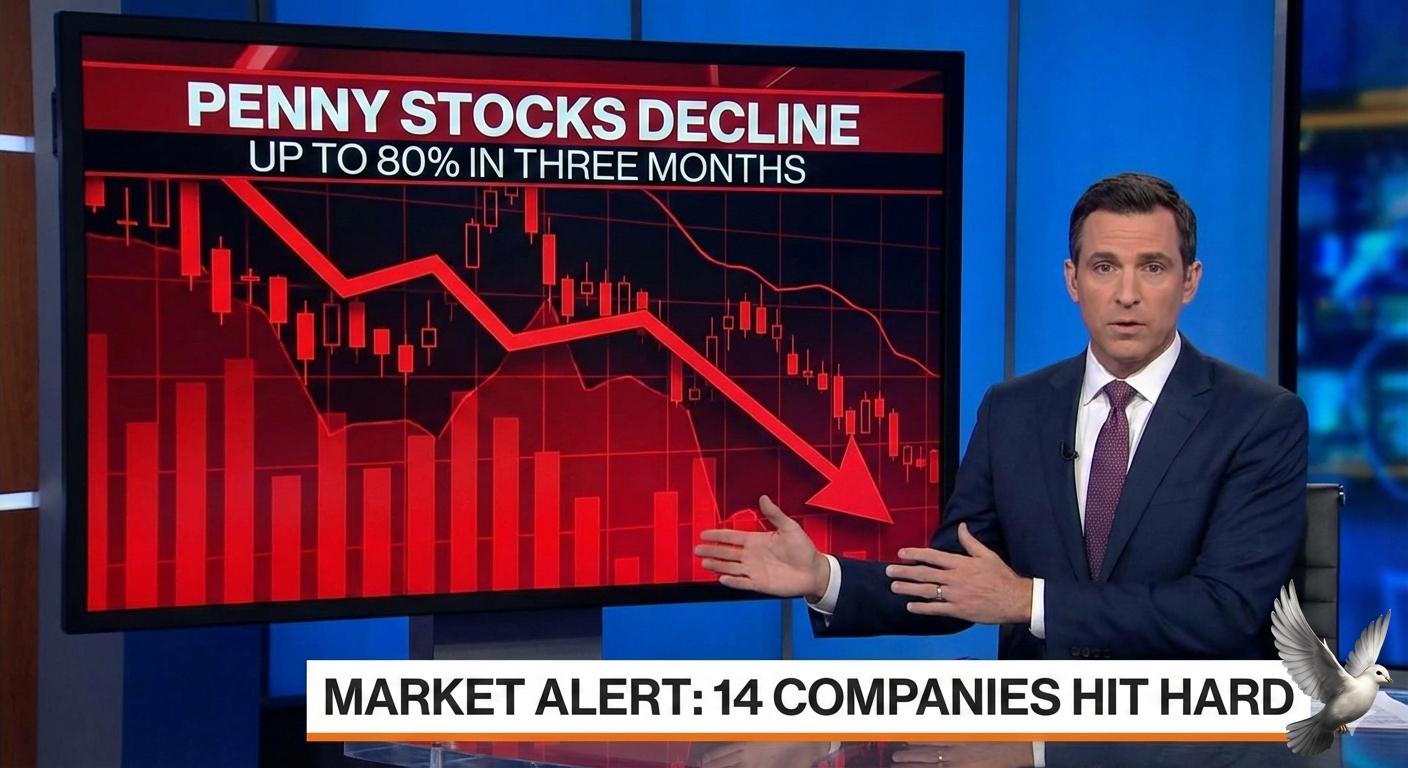
14 Penny Stocks Decline Up to 80% in Three Months
Market Vulnerability Brief Structural weaknesses currently define the asset landscape. The market is characterized by **low liquidity** coupled with **high volatility**, creating a fragile trading environment. This instability is compounded by **limited transparency**, significantly increasing exposure to manipulation. Consequently, the asset class remains prone to **sudden and severe price swings**.

FPIs Withdraw ₹33,598 Crore from Indian Equities in January Amid Sentiment Concerns
FPI Selling Pressure Intensifies Foreign Portfolio Investors (FPIs) have not only maintained their selling spree but significantly intensified outflows during the week ended January 23. According to VK Vijayakumar, Chief Investment Strategist at Geojit Financial Services, the momentum of selling has accelerated. The impact on market valuation has been severe. In a single week, cumulative selling resulted in a massive **Rs 16 trillion** erosion in market capitalisation. This sustained selling pressure dragged benchmark indices lower, causing the Nifty to register a sharp decline of **2.5%** for the week.