Bullish News
Collection
Evolving Global Capital Trends in the Indian Market in 2026
India’s economic landscape is undergoing a structural transformation, shifting from a traditional "emerging market" to a mature global financial hub. This evolution is anchored by a projected GDP growth of 7.4% for the 2026 fiscal year, positioning India as the fastest-growing major economy for the fourth consecutive year. The nation’s fiscal health remains a priority, with the government successfully narrowing the fiscal deficit to 4.4% of GDP. This fiscal discipline, combined with a nominal GDP growth estimate of 10.1%, has boosted international confidence, leading to credit rating upgrades from agencies like S&P and Morningstar DBRS. Foreign capital is flowing into the country at record levels. Total FDI inflows surged by 73% in the previous year to reach $47 billion. Investors are particularly focused on the services sector, manufacturing, and future-ready digital infrastructure. Data centers alone have become a massive magnet for greenfield investments, with India now ranked among the top 10 global recipients in this niche. A key driver of this integration is the Gujarat International Finance Tec-City (GIFT City). As India's first International Financial Services Centre (IFSC), it is moving beyond pilot stages to become a competitive alternative to global hubs like Singapore or Dubai. GIFT City recently marked a historic milestone with the filing of its first dollar-denominated IPO, allowing companies to raise foreign currency capital directly on Indian soil. Furthermore, the insurance sector has been fully liberalized, with the FDI cap raised to 100%, attracting major global players such as South Africa's Santam. Regulatory maturity is the final piece of the puzzle. Through initiatives like the Jan Vishwas Bill 2.0, India is decriminalizing over 100 minor industry offenses to reduce the "compliance tax." The rollout of a revamped Central KYC Registry and the implementation of a "trust first, scrutinize later" tax approach signal a definitive move toward global standards of data integrity and ease of doing business. Market benchmarks reflect this steady resilience. While the Sensex and Nifty 50 navigate short-term global volatility, the broader trend is supported by robust corporate balance sheets and an "India Stack" (UPI, ONDC) that continues to attract future-shaping capital. India is no longer just a destination for offshore labor; it is becoming a primary node in the global financial architecture. [GIFT City Investment Opportunities](https://www.youtube.com/watch?v=3evdopxcUow) This video provides an in-depth analysis of the latest economic survey and the strategic role of GIFT City in driving India's 7.4% growth target. http://googleusercontent.com/youtube_content/0
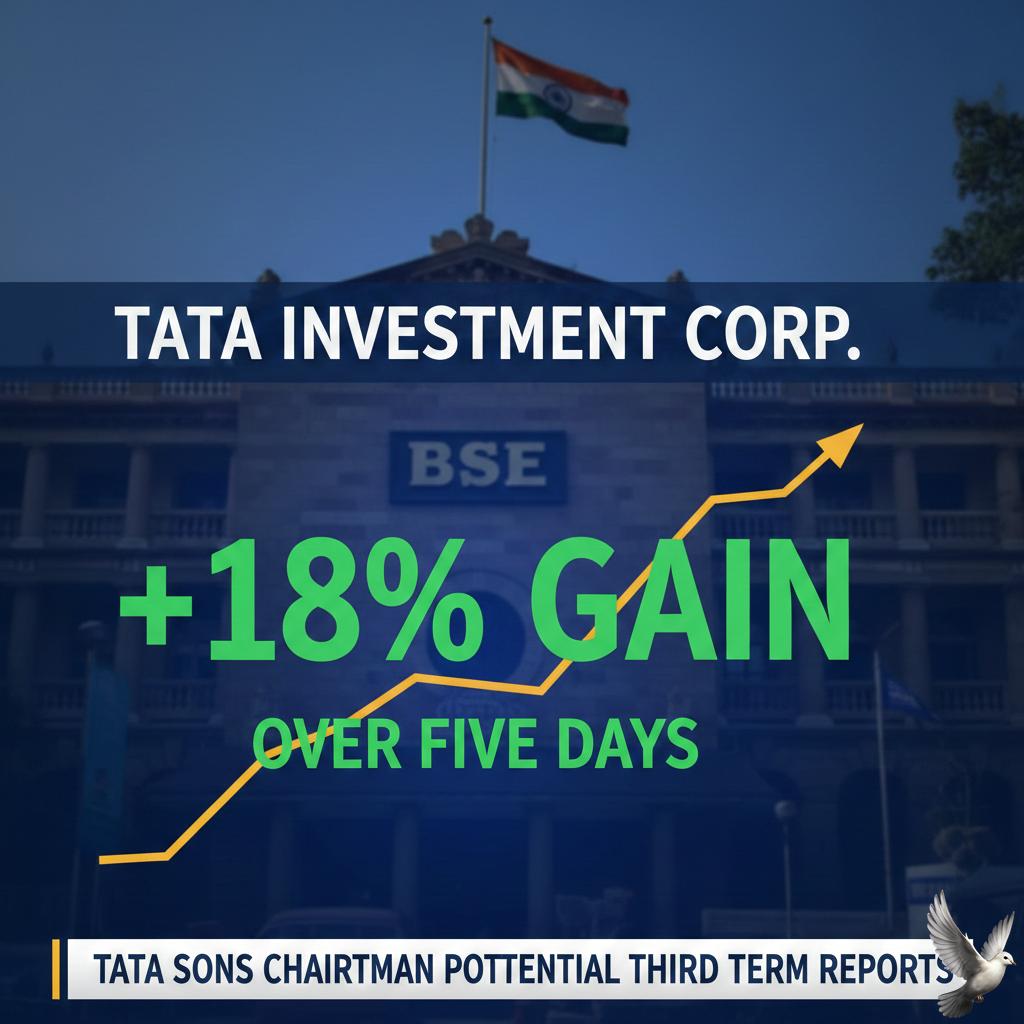
Tata Investment Corp. Shares Gain 18% Over Five Days Amid Reports of Potential Third Term for Tata Sons Chairman
Shares of Tata Investment Corporation have experienced a sharp rally, surging over **18%** across the last five trading sessions. This upward momentum is primarily driven by market anticipation surrounding the potential third term for N Chandrasekaran as Chairman of Tata Sons. The board of Tata Sons is scheduled to meet on **February 24, 2026**, to discuss the formal extension of Chandrasekaran's leadership. This move is viewed as a signal of stability for the group's ambitious **$120 billion** capital expenditure plan, which spans semiconductors, electric vehicles, and aviation. Market Performance and Valuation During today's trading session on February 20, 2026, the stock hit an intraday high of **741.70**, marking a gain of more than **6%** from its previous close. This performance significantly outpaced the broader market, as the Sensex traded lower by approximately **0.33%** during the same period. The company's market capitalization has climbed to approximately **35,160 crore**, reflecting robust buying interest. Despite the recent surge, the stock remains below its 52-week high of **1,184.70**, indicating a recovery phase from previous lows. Strategic Influence of Tata Sons As a specialized investment vehicle, the company's value is closely tied to its parent entity. Tata Sons holds a dominant **68.51%** stake in Tata Investment Corporation. The prospect of leadership continuity at the holding company level has historically acted as a positive catalyst for the subsidiary's stock. Investor sentiment is further bolstered by the group’s focus on future-ready sectors. Tata Consultancy Services is expected to present a critical artificial intelligence strategy to the board next week, highlighting the group's pivot toward high-growth technology infrastructure. Technical and Retail Trends Technical indicators suggest a bullish shift in the short term. The stock is currently trading above its **5-day**, **20-day**, and **50-day** moving averages. Retail participation has also spiked significantly, with the shareholder base expanding by approximately **78,000** new investors in the most recent quarter. While the company reported a **24%** increase in revenue for the last fiscal year, reaching **5.92 lakh crore**, net profits saw a decline of **17%** to **28,898 crore**. This reflects the high-investment phase the group is currently navigating under its existing leadership.

Brokers Request Revisions to Capital Market Exposure Limits Amid Liquidity Concerns
Market participants are bracing for a structural shift in liquidity as new banking exposure rules, finalized in February 2026, prepare to take effect on April 1, 2026. The regulations mandate a move to a 100% collateralized lending model, effectively ending the era of flexible, partially secured bank credit for intermediaries. Under the revised framework, every ₹100 of credit extended to a broker must be matched by ₹100 of tangible collateral. This replaces the previous system where personal or corporate guarantees were often sufficient. Furthermore, a new 40% mandatory haircut on equity collateral means that ₹100 crore in pledged shares now only provides ₹60 crore in borrowing power, significantly reducing effective leverage. Funding costs are expected to climb sharply due to the new cash trap provisions. Bank Guarantees (BGs) must now be backed by at least 50% collateral, with a minimum of 25% held in pure cash. Previously, brokers could secure large exposures with as little as 1% to 2% in fees. This cash lock-up is projected to impact roughly ₹1.5 lakh crore in bank exposure, potentially putting half of that liquidity at risk. Proprietary trading faces the strictest curbs, with a total ban on bank financing for a broker's own-account investments. Since proprietary and high-frequency traders contribute between 30% and 50% of total market volume, experts warn of wider bid-ask spreads and reduced market depth. Smaller firms heavily reliant on bank lines are viewed as vulnerable to consolidation. The Margin Trading Facility (MTF) segment, currently valued at approximately ₹1,00,000 crore, is also under pressure. While bank funding remains permitted for MTF, the requirement for 50% cash collateral makes the channel increasingly uneconomical. Many large brokerages are already pivoting toward the bond market and commercial paper (CP) to replace traditional bank lines. Despite short-term volatility, the regulator views these measures as essential for systemic stability. The goal is to decouple the banking sector from capital market volatility and curb speculative excesses. While liquidity may see a period of recalibration, the long-term outlook focuses on building a more resilient financial ecosystem with disciplined leverage and improved investor protection. [Understanding RBI's New Broker Lending Norms](https://www.youtube.com/watch?v=8kfPogaxY7A) This video provides a detailed breakdown of the 2026 regulatory changes and their specific impact on major brokerage stocks and market liquidity. http://googleusercontent.com/youtube_content/0

US Financial Stocks Decline Amid Leadership Changes and Credit Concerns
Blue Owl Capital’s recent execution of a **$1.4 billion** asset sale across three of its credit funds has intensified scrutiny of the private debt landscape. The transaction involved selling senior secured loans—averaging **$5 million** per position—to institutional buyers at approximately **99.7%** of par value. While management frames the move as a validation of their book values, the market remains on edge regarding underlying liquidity and sector-specific risks. The pivot in redemption strategy for Blue Owl Capital Corp II (OBDC II) marks a significant shift. The fund has transitioned from traditional quarterly tender offers to a structured return-of-capital distribution. Under this new framework, the firm plans to return roughly **30%** of investor capital within the next 45 days, with a broader goal of returning up to **50%** by the end of 2026. This tactical change aims to manage heavy withdrawal requests that surfaced following a failed merger attempt late last year. Investor anxiety is particularly focused on the software and technology sectors, which represent approximately **13%** of the assets sold. The S&P 500 Software & Services index has faced massive valuation swings, losing nearly **$2 trillion** in market value since late 2024. Concerns are mounting that rapid advancements in artificial intelligence could disrupt established software business models, potentially impacting the repayment capacity of middle-market borrowers in these portfolios. Despite these local pressures, broader private credit indicators show continued expansion. Global assets under management in the sector are projected to surpass **$2 trillion** in 2026. However, the Blue Owl developments highlight a growing "liquidity gap" between private valuations and public market sentiment. Publicly traded shares of Blue Owl’s flagship vehicle (OBDC) have reflected this tension, falling from a 2024 peak of near **$17** to below **$12** in February 2026. Regulators and analysts are monitoring these events as potential "canary-in-the-coalmine" signals for the $3 trillion private credit market. While a 2025 Federal Reserve stress test suggested that non-bank financial intermediaries do not currently pose a systemic threat to major banks, the increasing interconnectivity between private funds, insurance companies, and retail investors suggests that localized stress can quickly impact broader financial stock performance. The firm is currently utilizing share buybacks to stabilize its position, authorizing a new **$300 million** program. This comes as the parent company reports a record **$307.4 billion** in total assets under management, underscoring a period of aggressive growth meeting significant structural challenges in the secondary market.

Omnitech Engineering Sets Rs 583 Crore IPO for February 25
Omnitech Engineering is set to launch its Mainboard IPO on February 25, 2026, marking a significant entry into the public markets for the precision component sector. The company has finalized a price band of 216 to 227 per equity share for the 583 crore issue. The offering consists of a fresh issue of shares worth 418 crore and an offer-for-sale of 165 crore. Investors can participate with a minimum lot size of 66 shares, requiring an initial investment of 14,982 at the upper price limit. Subscription remains open until February 27, with the final allotment expected by March 2. The manufacturer plans to deploy 233.5 crore of the proceeds to establish two new production facilities in Rajkot, Gujarat. Additionally, 50 crore is allocated for debt reduction to strengthen a balance sheet that currently carries 382.9 crore in total indebtedness. A smaller portion of 18.6 crore is earmarked for rooftop solar installations at its plants. Financially, the firm has demonstrated rapid scaling, reporting a 92.45% revenue surge between FY 2024 and FY 2025. Total income for the 2025 fiscal year reached 349.71 crore, yielding a profit after tax of 43.87 crore. The company maintains a healthy EBITDA margin of 34.31% and a Return on Equity of 21.55%. Omnitech specializes in complex, safety-critical assemblies for global energy and industrial automation clients. Its operations are heavily export-oriented, with approximately 75% of revenue generated from 220 customers across 22 countries, including the United States and Germany. The IPO arrives as India’s precision engineering market is projected to reach 16.29 billion USD in 2026. This growth is fueled by global "China+1" sourcing shifts and rising demand from the aerospace and electric vehicle sectors. Market interest is further supported by the company's expansion into high-growth segments like motion control and industrial robotics. Listing is tentatively scheduled for March 5, 2026, on both the BSE and NSE, positioning Omnitech alongside industry peers like MTAR Technologies and Azad Engineering.

**Impact of Japan’s Monetary Policy Tightening on Global Market Liquidity**
Japan’s transition toward a 1% interest rate environment is accelerating, signaling a structural shift in the global financial landscape. Following decades of ultra-loose monetary policy, the Bank of Japan (BoJ) has raised its short-term policy rate to 0.75% as of early 2026. Market expectations are now firmly pricing in a move to 1.00% by mid-year, driven by a sustained period of inflation holding near the 2% target. This normalization is triggering a significant migration of capital. Japanese household savings, which have long sat in low-yield cash accounts, are beginning to shift into interest-bearing deposits. Ordinary deposit rates, which were effectively zero for years, have climbed toward 0.2% and 0.5% at major institutions. With over $14 trillion in domestic household assets, even a marginal shift back into the local banking system could reduce the supply of "cheap yen" that has historically fueled international markets. The impact on global capital flows is already visible. For years, Japan was the world’s primary source of low-cost funding via the carry trade—where investors borrow yen at near-zero rates to buy higher-yielding assets abroad. As domestic Japanese yields rise, the incentive for this trade diminishes. The 10-year Japanese Government Bond (JGB) yield recently breached 2.25%, a level not seen in over 25 years. These higher domestic returns are encouraging Japanese institutional investors to repatriate funds from foreign bond markets, particularly U.S. Treasuries and European debt. Currency markets remain a focal point of this volatility. While the yen has faced periodic weakness, reaching levels around 156 against the dollar, the closing interest rate gap between Japan and the West is creating a "yen revenge" scenario. A stronger yen increases the cost of servicing yen-denominated debt globally, putting pressure on high-growth equity valuations and emerging market liquidity. Corporate Japan is showing resilience despite the rising costs. The Nikkei 225 remains elevated near the 57,000 mark, supported by robust wage growth—which hit a 33-year high in recent negotiations—and strong export performance. However, debt-dependent sectors and technology firms are facing valuation caps as global discount rates drift higher. Financial institutions, conversely, are seeing improved net interest margins as lending rates finally move off the floor. Investors should prepare for a new era where Japan is no longer the world’s backstop for free liquidity. The steady climb toward 1% represents more than a policy tweak; it is a recalibration of how capital is priced across the globe. Strategic positioning will now require a focus on balance sheet strength and domestic cash flows as the era of the yen carry trade continues to unwind.

Sunny Agrawal Analyzes Execution Risks for NCC and Investment Outlook for Reliance Industries
Market Brief: Infrastructure & Energy Outlook **Market Overview** The Indian equity market is navigating a period of heightened volatility. The **Nifty 50** recently faced a sharp correction, dropping nearly **400 points** to settle around **25,400**. Geopolitical tensions between the US and Iran have pushed India VIX up by **10%**, signaling increased investor anxiety. Despite the turbulence, technical indicators suggest a crucial psychological and structural support floor at the **25,000** level. Maintaining this base is essential for a potential rebound toward the **25,800** resistance zone. **NCC Ltd: Execution Hurdles** The construction major is facing a challenging phase as it moves into **FY26**. While the company maintains a massive consolidated order book of nearly **₹79,571 crore**, short-term growth is under pressure. Recent operational headwinds include: * **Withdrawal of FY26 guidance** due to payment delays in government schemes like the Jal Jeevan Mission. * **Execution delays** stemming from elongated monsoon cycles and permit issues. * **Regulatory pressure** following a recent two-year debarment by NHAI from fresh road tenders, which sent the stock to a 52-week low of **₹135**. The stock is currently trading near **₹150**, significantly below its 52-week high of **₹347**. Analysts suggest that while valuations are attractive at a price-to-book ratio of **0.46**, investors should focus on gradual accumulation rather than aggressive buying until execution visibility improves. **Reliance Industries: Consumer-Led Recovery** Reliance Industries (RIL) is positioned as a structural "buy on dips" candidate. The stock has seen recent pressure, hovering near the **₹1,400** mark, but its long-term outlook remains bolstered by its non-oil verticals. Key growth drivers identified for the coming quarters include: * **Telecom Expansion:** Potential tariff hikes in mid-2026 are expected to provide a significant earnings kicker for Jio. * **Retail Momentum:** Steady scaling in the digital and physical retail space continues to drive cash flow. * **Energy Resilience:** Crude price spikes amid Middle East tensions are providing near-term support for the upstream oil and gas segment. With a current market capitalization of approximately **₹19.5 lakh crore**, brokerage targets for RIL sit between **₹1,700 and ₹1,800** over the next 12 to 18 months. **Investor Strategy** The current environment favors a defensive approach. While the infrastructure sector faces a "wait and watch" period due to payment cycles, large-cap heavyweights like Reliance offer a cushion against broader market swings. Staggered entry into **NCC** is viable for long-term players eyeing the recovery of its **₹72,000 crore** standalone order book, while **Reliance** serves as a core portfolio play for those betting on India's digital and consumer growth.

Novartis India Shares Rise 18% on Parent Company's Planned Exit in Rs 1,446 Crore Deal
Novartis India experienced a massive rally in today’s trading session, with shares surging nearly 20% to reach an intraday high of 996.50. This sharp upward movement follows a definitive announcement by the Swiss parent company regarding a total exit from its listed Indian subsidiary. The parent company, Novartis AG, has signed a binding agreement to sell its entire 70.68% stake for approximately 1,446 crore. The stake is being acquired by a consortium led by ChrysCapital, alongside WaveRise Investments and Two Infinity Partners. The transaction price for the promoter stake is set at 860.64 per share, which represented a 3.6% premium over the previous day’s closing price. This change in control has triggered a mandatory open offer for public shareholders. The acquiring consortium is now seeking an additional 26% stake from the public at the same price of 860.64 per share. Under the terms of the deal, the company will undergo a complete rebranding, removing all "Novartis" references within 120 days of the transaction's completion. The stock's performance today significantly outpaced the broader market, which is currently navigating high volatility. While Novartis India locked in gains at the upper circuit, the Nifty Pharma index showed more modest movement, trading near the 22,468 level with a gain of approximately 0.4%. Wider market sentiment remains cautious as of February 20, 2026. The Nifty 50 and Sensex opened relatively flat today, following a steep 1,200-point drop in the previous session. Investors are closely monitoring rising geopolitical tensions in the Middle East and Brent crude prices, which have climbed toward 72 per barrel. Despite the exit from the listed entity, the Swiss parent will continue its presence in the country through Novartis Healthcare Private Limited. This entity remains the core hub for the group's research, development, and commercial operations in the region, signaling a strategic shift toward a dedicated R&D and services model rather than a traditional listed commercial structure. The pharmaceutical sector continues to show resilience, with the domestic market recording over 10% value growth in the first month of 2026. Investors are now focused on the transition of management at Novartis India and how the new owners will optimize the company’s established product portfolio.

Performance Analysis of India-Linked AI Stock Following 200% Growth
Netweb Technologies has firmly established itself as the primary hardware proxy for India's sovereign AI ambitions, with its market valuation reflecting a massive surge of over 600% since its July 2023 IPO. As of February 2026, the company's financial performance shows explosive growth. In the third quarter of FY26, Netweb reported a consolidated revenue of 805 crore, a remarkable 141% increase year-on-year. Profit after tax (PAT) followed a similar trajectory, jumping 147% to reach 73.3 crore for the same period. The AI systems division has become the dominant revenue driver, contributing 64% of total income in the latest quarter. This shift is significant considering the segment accounted for only 7% of revenue just two years ago. High-performance computing (HPC) and private cloud solutions continue to support this growth, maintaining a strong 89% combined revenue share from these core sectors. Operational momentum is backed by a substantial order book totaling over 2,250 crore. This includes an organic order book of 525.8 crore and a massive strategic pipeline of 1,733.6 crore. Recent major wins include a 450 crore order for Tyrone AI GPU systems and a prior 1,734 crore contract to supply servers based on NVIDIA’s Blackwell architecture. Strategic partnerships remain a key catalyst. In February 2026, Netweb expanded its collaboration with NVIDIA by launching the Tyrone Camarero Spark, recognized as one of the world's smallest AI supercomputers. Manufactured in India, these systems deliver 1 petaflop of performance in a desktop form factor, allowing local developers to fine-tune AI models with up to 70 billion parameters on-premises. The company is also deploying liquid-cooled rack-scale systems based on the NVIDIA GB200 platform. These "Make in India" supercomputers are designed to handle massive workloads, including training models with up to 10 trillion parameters. Such innovations align directly with the government’s 10,300 crore IndiaAI Mission. Market confidence is reflected in the stock’s premium valuation, with a P/E ratio currently hovering around 107 to 113. Investors are pricing in a projected revenue and profit CAGR of nearly 50% through 2028. Despite the high valuation, the company maintains a strong balance sheet as a zero net-debt entity with cash reserves of 190 crore. Netweb's role as a key beneficiary of the IndiaAI Mission remains undisputed as it builds the physical infrastructure necessary for the nation's digital self-reliance. [Netweb Tech unveils 'Make in India' AI supercomputing systems](https://www.youtube.com/watch?v=lGbT5tZGGuM) This video provides the latest details on Netweb's February 2026 launch of new AI supercomputers in partnership with NVIDIA, which directly impacts the company's growth strategy. http://googleusercontent.com/youtube_content/0
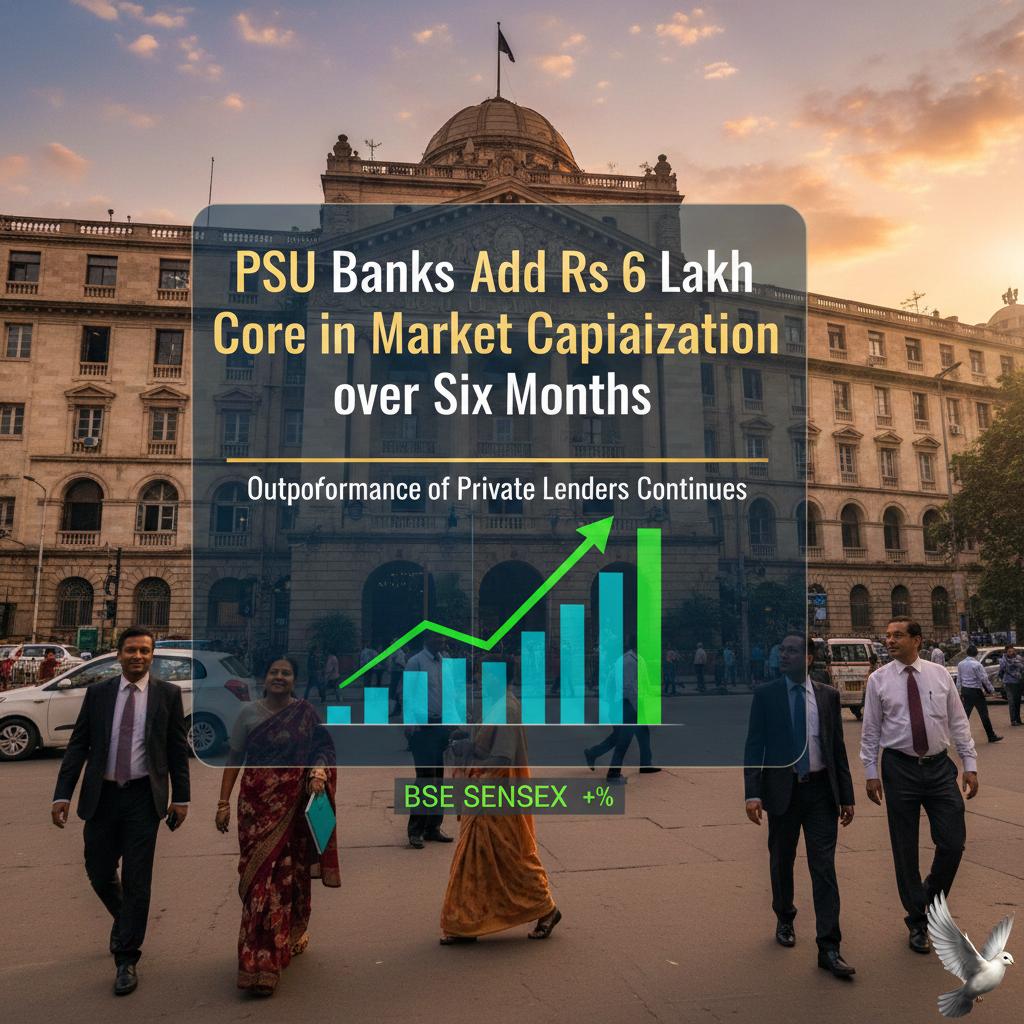
PSU Banks Add Rs 6 Lakh Crore in Market Capitalization over Six Months as Outperformance of Private Lenders Continues
Indian public sector undertaking (PSU) banks have transformed into a dominant market theme on Dalal Street. This shift is fueled by a rare combination of robust credit expansion, multi-decadal low bad loans, and consistent record-breaking profitability. The collective market capitalization of the 12 state-run lenders has climbed significantly, recently reaching approximately 21.36 lakh crore. This surge represents a massive valuation re-rating that has consistently outperformed private sector competitors over the last several quarters. Market leadership is anchored by State Bank of India, which currently commands a market cap of over 11.12 lakh crore. Other major contributors include Bank of Baroda at 1.57 lakh crore and Punjab National Bank at 1.45 lakh crore. The Nifty PSU Bank Index reflects this momentum, currently trading near 9,547 points and delivering 1-year returns of approximately 61.69%. Financial health across the sector has reached a turning point. Net profits for public sector banks surged 26% to reach 1.78 lakh crore in the 2024-25 fiscal year. More recently, the group posted a record cumulative profit of 49,456 crore for the second quarter of the 2025-26 fiscal, a 9% year-on-year increase. SBI alone contributed nearly 40% of these earnings with a net profit of 20,160 crore. Asset quality has seen a structural improvement. The Gross Non-Performing Asset (GNPA) ratio for state banks fell to a multi-decadal low of 2.1% as of September 2025. This is a dramatic recovery from the peak of 14.58% seen in 2018. Net NPAs have also reached record lows of 0.52%, supported by stronger provision buffers and improved credit discipline. State-run lenders currently hold a competitive edge in liquidity. While private banks grapple with high credit-to-deposit (CD) ratios near 90%, PSU banks maintain a more comfortable CD ratio of roughly 75%. This provides them with significant "lending headroom" to support credit growth, which is currently tracking at 11% year-on-year. The sector is also seeing a rise in investor rewards. Post-2022, PSU banks have consistently offered higher dividend yields, with the index currently maintaining a yield of approximately 2.09%. Valuation remains attractive for many investors, with the sector trading at a price-to-earnings (P/E) ratio of 9.23 and a price-to-book (P/B) value of 1.52. Government reforms and capital management continue to support this trajectory. With capital adequacy ratios standing at a decade high of 16.4%, these lenders are well-positioned to absorb potential economic shocks while continuing to fund India's infrastructure and retail credit demands.

Brokerage Anticipates New Record Highs Following Accurate Precious Metals Forecast
Market Brief: Precious Metals Outlook 2026 Precious metals have entered a high-velocity phase in early 2026, characterized by extreme volatility and the establishment of new price floors. After a historic surge in January, gold and silver are navigating a period of price discovery driven by structural supply-demand imbalances and a fundamental shift in global capital allocation. Gold Market Performance and Forecasts International gold prices scaled 12 all-time highs in the first six weeks of 2026, breaching the **$5,400** per ounce mark. Following a sharp technical correction at the end of January, the metal has shown resilience, stabilizing near the **$5,000** level. Institutional projections for the remainder of 2026 remain aggressively bullish. Major banks have revised year-end targets upward, with **J.P. Morgan** forecasting **$6,300**, while **UBS** and **Deutsche Bank** project levels between **$6,000** and **$6,200**. In the Indian domestic market, gold reached a record high of **₹1,80,779** per 10 grams on the MCX. Current spot rates for 24K gold are hovering around **₹1,54,190**, with analysts identifying **₹1,47,000** as a critical support zone for the next leg of the rally toward **₹1,63,000**. Silver's Structural Deficit and Industrial Momentum Silver has transitioned from a tactical hedge to a primary industrial and monetary asset. The market is currently entering its sixth consecutive year of structural deficit, with a projected shortfall of **67 million ounces** for 2026. Cumulative deficits over the last five years now exceed **800 million ounces**, equivalent to a full year of global mine production. Prices reached a peak of **$120** per ounce in late January before pulling back to the **$77–$83** range in mid-February. Despite this correction, technical indicators suggest silver is building a base for a move toward **$100** by mid-year. The industrial story remains the primary driver. Demand from the solar energy sector, electric vehicles, and AI-driven data centers continues to outpace supply. China’s decision to restrict silver exports through 2027 has further tightened physical availability, supporting long-term targets of **$140** to **$210** within a three-year window. Key Macroeconomic Drivers * **Central Bank Accumulation:** Monetary institutions continue to diversify away from the US Dollar. Global central bank gold purchases are expected to reach **800 tonnes** in 2026. * **Investment Flows:** Indian gold ETFs recorded nine consecutive months of net inflows, reaching a record **₹240 billion** by February. * **Supply Constraints:** Global mine production is only expected to edge up by **1%** in 2026, failing to bridge the gap created by accelerating industrial fabrication. * **Currency Dynamics:** The Gold:Silver ratio remains highly volatile, recently compressing below **60:1** for the first time in a decade, signaling silver’s potential for continued outperformance.

Gold Prices Decrease Amid Rising Dollar and Anticipated Inflation Data
Gold prices are navigating a period of high volatility as the market balances aggressive technical rallies against a strengthening U.S. dollar. Bullion recently crossed the psychological threshold of **$5,000** per ounce, reaching intra-day highs near **$5,020**. Despite this upward momentum, the metal faces immediate pressure from a recovering dollar index, which climbed toward a four-week high near **98.00**. Investor focus is fixed on upcoming U.S. economic indicators, specifically the Personal Consumption Expenditures (PCE) price index. This data is critical for determining the Federal Reserve's next steps, as recent FOMC minutes revealed a significant divide among policymakers. While some officials advocate for rate cuts if disinflation continues, others have hinted at maintaining restrictive levels or even implementing further hikes if inflation remains sticky above the **2%** target. Geopolitical instability remains a primary driver for safe-haven demand. Tensions between the United States and Iran have resurfaced, fueling concerns over regional security and potential disruptions to global energy flows. These risks, combined with ongoing friction in Eastern Europe, have reinforced gold’s appeal as a primary hedge against global uncertainty, even as the dollar gains strength from resilient U.S. labor data. In physical markets, demand has seen a temporary dip in Asia due to the Lunar New Year period, leading to thinner trading volumes. However, domestic prices in major hubs like India have touched lifetime records, with 24-carat gold reaching approximately **₹87,810** per 10 grams in Delhi. Analysts maintain a bullish long-term outlook, with some institutional forecasts projecting an climb toward **$5,400** by the end of 2026. Current market sentiment suggests that while the hawkish Federal Reserve stance creates short-term headwinds, the combination of persistent inflation risks and geopolitical triggers continues to support a structural uptrend. Traders are currently pricing in at least two 25-basis-point rate cuts before the end of the year, though the timing remains highly data-dependent.
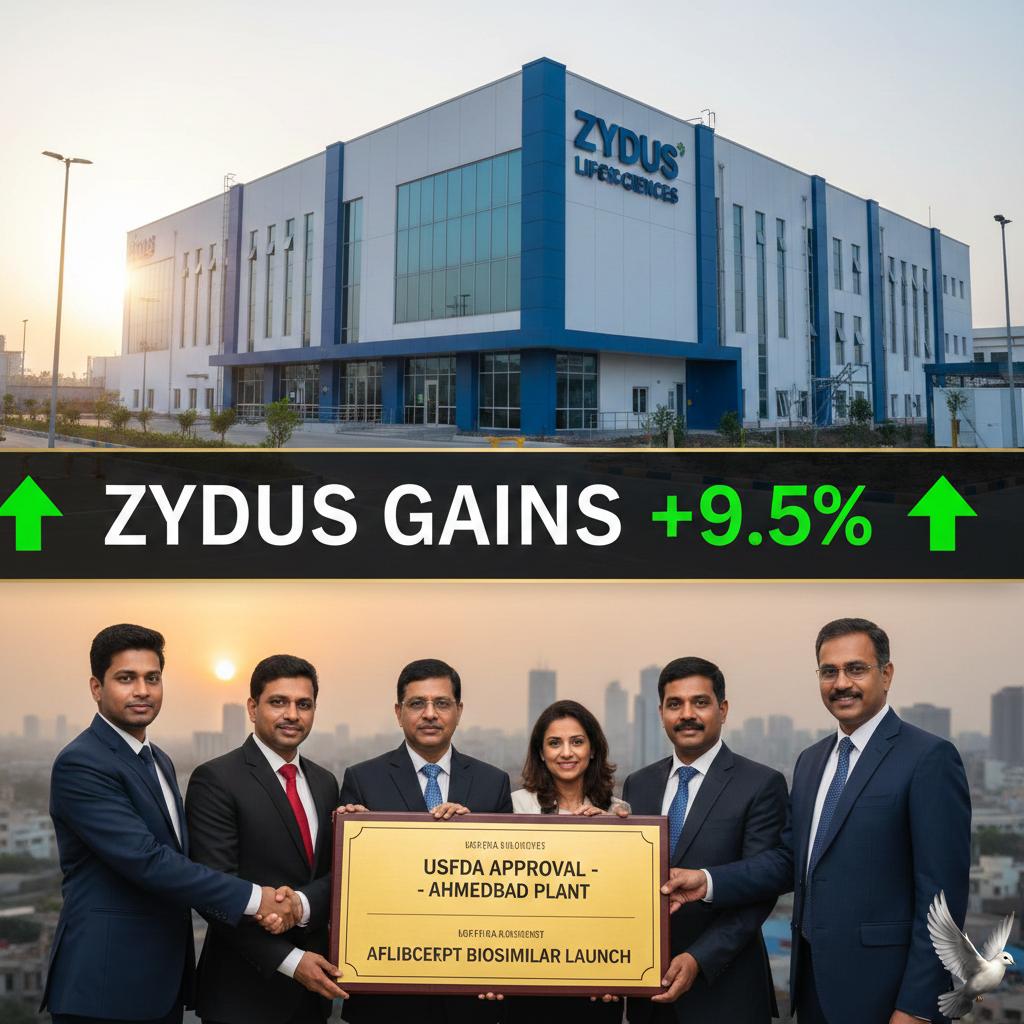
Zydus Lifesciences Gains USFDA Approval for Ahmedabad Plant and Aflibercept Biosimilar Launch
**Zydus Lifesciences Market Brief** **February 20, 2026** Zydus Lifesciences is witnessing a surge in institutional interest following a dual breakthrough in regulatory compliance and product innovation. The company successfully concluded a USFDA Pre-Approval Inspection at its Unit 9 injectable facility in Ahmedabad on February 19, 2026. The inspection ended with **zero observations**, a critical "Nil" status that paves the way for accelerated approvals in the high-margin US injectable market. This compliance milestone reinforces Zydus’s manufacturing standards after its oncology facility was upgraded to VAI status late last year. Simultaneously, Zydus has launched **ANYRA**, India’s first indigenous Aflibercept biosimilar. Developed in collaboration with Regeneron and Bayer, this 2 mg therapy targets retinal disorders including neovascular Age-related Macular Degeneration and Diabetic Retinopathy. The market opportunity for ANYRA is vast. India currently hosts over **100 million** people living with diabetes, with an estimated **7 to 8 million** suffering from diabetic retinopathy. The launch positions Zydus to lead the domestic retinal therapy segment, which requires chronic, long-term treatment. Financial performance remains robust. For the quarter ended December 31, 2025 (Q3 FY26), Zydus reported consolidated revenue of **₹68,645 million**, marking a significant **30.3%** year-on-year increase. EBITDA for the same period climbed **31%** to **₹18.20 billion**, with margins strengthening to **26.5%**. The North America business contributed **₹28,000 million** to the quarterly revenue, up **16%** year-on-year. This was supported by **8 new approvals** and **4 product launches** during the quarter, including BEIZRAY, the company’s first oncology 505(b)(2) product. In the domestic market, the India Branded Formulations segment grew by **14%**, outperforming general market trends. The chronic therapy portfolio now accounts for **45.3%** of this segment, highlighting a strategic shift toward more resilient and recurring revenue streams. As of February 20, 2026, Zydus Lifesciences (NSE: ZYDUSLIFE) is trading near **₹902**, with a market capitalization of approximately **₹90,800 crore**. The stock maintains a price-to-earnings (P/E) ratio of **18.4**, reflecting a valuation discount compared to several large-cap peers. Analysts maintain a cautious but positive outlook with a median 12-month price target near **₹1,020**. The focus now shifts to the launch of Saroglitazar Magnesium in the US and the expansion of the biologics portfolio, which currently features more than **13 biosimilars**.

Waaree Energies in Talks with Andhra Pradesh Government to Establish Gigafactory
Waaree Energies is rapidly expanding its footprint in the energy storage sector, confirming plans to establish India’s largest integrated lithium-ion battery gigafactory in Andhra Pradesh. The project involves a significant investment of 8,175 crore. The facility will be located at Rambilli in the Anakapalli district. This greenfield project is designed to reach a massive capacity of 16 GWh. The factory will cover the entire battery value chain. This includes the production of advanced chemistry cells, battery packs, and large-scale Battery Energy Storage Systems. The project has received in-principle approval from the state government. It is expected to create 3,000 direct jobs and significantly reduce India's reliance on imported energy storage technology. On the stock market, Waaree Energies shares were trading near 2,874 as of late February 2026. The stock has seen a 1-year return of approximately 29.5%. Financial performance remains robust. For the quarter ending December 2025, the company reported a total revenue of 7,761 crore. This represents a 24.6% increase from the previous quarter. Net profit for the same period reached 1,106 crore, marking a 26% growth compared to the September 2025 quarter. The company maintains healthy operating margins of around 22%. Market trends show a decisive shift toward energy storage. India’s power sector is increasingly tilting toward hybrid and storage-based tenders to stabilize the grid as renewable capacity grows. Solar-hour electricity prices remained low at 4.3 per kWh in January 2026. This price stability is driving the commercial and industrial segments to adopt integrated solar-plus-storage solutions. The government is supporting this transition through the 18,100 crore Production Linked Incentive scheme for Advanced Chemistry Cells. Over 10 manufacturers have now announced a combined 178 GWh of future capacity. Waaree’s expansion is timed to meet this rising demand. The company is transitioning from a solar module leader to a fully integrated energy player, aligning with the national goal of 500 GW of non-fossil fuel capacity by 2030.
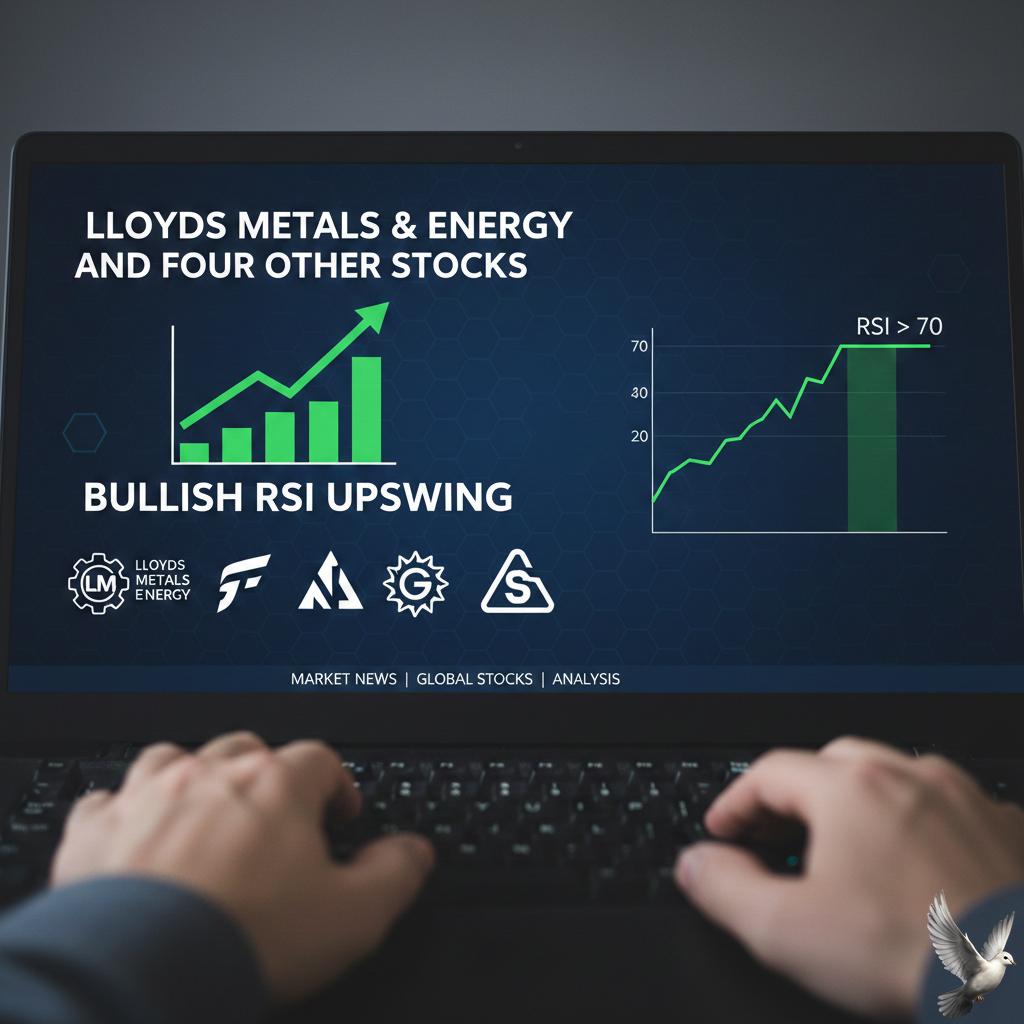
Lloyds Metals & Energy and Four Other Stocks Demonstrate Bullish RSI Upswing
Market Brief: Nifty500 Momentum and Technical Trends The Nifty500 index reflects a period of heightened volatility and cautious sentiment. As of **February 20, 2026**, the index has faced significant pressure, tracking a sharp **1.41%** decline in the benchmark Nifty 50, which closed at **25,413** following a substantial sell-off. Despite this broader market turbulence, specific technical scans continue to highlight pockets of resilience where stocks signal a shift from bearish to bullish territory. Technical indicators like the Relative Strength Index (RSI) are currently pivotal for identifying short-term recovery. A crossover where the RSI moves above the **50** mark is widely regarded by traders as a "bullish upswing," suggesting that price momentum is strengthening. This trend was notably observed earlier in several Nifty500 constituents, where improving technical scores helped investors identify buying opportunities amidst fluctuating prices. Lloyds Metals & Energy Limited (LLOYDSME) Lloyds Metals has recently navigated a complex trading environment. The stock price was last recorded around **₹1,125**, facing an intraday decline of over **5%** during the heavy market sell-off on **February 19**. Despite the immediate price pressure, the company is actively pursuing aggressive global expansion. On **February 17, 2026**, the firm incorporated a new step-down subsidiary, **Virtus Lloyds Resources FZCO**, in the Dubai Multi Commodities Centre (DMCC). This move is designed to facilitate strategic partnerships with US-based developers and enhance its international footprint in the metals and mining sector. This follow-up to its **₹8,000 crore** expansion plan approved earlier this month signals a robust long-term growth outlook, even as its short-term RSI navigates neutral to bearish zones. Welspun Living Limited Welspun Living is currently trading near **₹137.75**, showing a slight decline of **0.52%** in recent sessions. The stock has maintained a market capitalization of approximately **₹13,212 crore**. While it has experienced a **15%** return over the past month, it recently triggered a technical sell signal as it dipped below its **10-day** moving average. The textile sector, including Welspun, remains in the spotlight due to shifting trade dynamics. Recent interim pacts between India and the US have sparked interest in textile stocks, with some peers rallying up to **20%**. For Welspun, the focus remains on whether it can reclaim its momentum to push back toward its **52-week high** of **₹154.60**. Broader Nifty500 Highlights Other Nifty500 entities have recently appeared on the RSI Trending Up scan, reclaiming the **50** level: * **Tata Investment Corp**: RSI surged to **62.98**, with the stock trading at **₹692.30**. * **Oil India**: Reclaimed bullish territory with an RSI of **53.98** and a price of **₹476.70**. * **Newgen Software**: Showed strong momentum with an RSI of **53.53**, closing at **₹622.90**. The sharp drop in the broader market has dragged the Nifty 50 toward the **25,300** support zone. Analysts suggest that while many stocks have seen their RSI fall toward neutral territory, this often precedes a technical pullback or bargain hunting. Traders are monitoring the **25,600** resistance level closely; a decisive move above this would signal that the bullish momentum seen in individual technical scans is ready to return to the wider market.

Oil India and Three Other Stocks Exhibit Bullish RSI Trends
Market Brief: Bullish Momentum Amidst Broad Market Volatility Indian equity markets faced a sharp sell-off on February 19, 2026, with the **Nifty 50** dropping **365 points** to close at **25,454.35**. Despite this **1.41%** decline in benchmark indices, specific pockets of the **Nifty 500** displayed resilient bullish momentum. Technical scans identified four notable stocks—**Oil India, Tata Investment Corporation, Godrej Industries, and Newgen Software Technologies**—where the Relative Strength Index (**RSI**) crossed above the **50** mark. This transition signals a shift from bearish to bullish price momentum, suggesting potential short-term buying opportunities even as the broader market grapples with geopolitical tensions and FII outflows. Stock Performance Highlights **Newgen Software Technologies** emerged as a standout performer, surging **11.07%** to reach **₹586.35**. This rally followed a period of intense selling, with the stock rebounding sharply from a **52-week low** of **₹458.65**. Trading volume spiked to **87.47 lakh** shares, a massive increase over its 10-day average, signaling strong accumulation at lower levels. **Tata Investment Corporation** also witnessed a significant breakout, climbing **11.85%** in early trade to reach **₹719.95**. The stock outperformed the **Nifty 500** significantly over the week, with buy orders dominating nearly **80%** of market depth. This move pushed the stock above its **5-day and 20-day** moving averages, confirming a short-term trend reversal. **Godrej Industries** showcased robust intraday strength, gaining **7.55%** to hit a high of **₹1,046.65**. The company has maintained a positive trajectory for four consecutive sessions, yielding a total return of **7.68%** in that period. Technically, the price is now trading above its **50-day** moving average, although it faces long-term resistance at the **100-day** mark. **Oil India** recorded a **2.13%** gain to close at **₹463**, bucking the trend of a **0.96%** decline in the broader oil sector. Derivative data indicated a significant surge in open interest, which rose **11.1%** to **37,340** contracts. While the stock remains below its short-term **5-day** average, the RSI crossover suggests a building base for a potential upward move. Market Context The broader market weakness was driven by a combination of factors, including rising **Brent Crude** prices hitting **$71.92** and persistent selling by Foreign Portfolio Investors (**FPIs**), who offloaded shares worth **₹880.49 crore** in a single session. The **Nifty 500** index itself ended at **23,258.40**, down **1.64%**. However, the RSI crossover in these four stocks highlights a "divergence" where individual price action is beginning to decouple from the bearish sentiment of the primary indices.

Five Top-Performing Long-Term Stock Picks for 2026 Including Tata Steel and Eicher Motors
Market Overview The Indian equity market experienced a significant downturn on **February 19, 2026**, snapping a three-day winning streak. Benchmark indices faced heavy selling pressure as investors opted for profit booking near all-time highs. The **Nifty 50** plummeted by **1.6%**, closing at **25,413** points. This sharp decline dragged the index below its short-term consolidation range, breaking through both the **50-day** and **21-day EMA**. Technical analysts now eye **25,200** as a critical support zone. The **BSE Sensex** followed suit, dropping **1.48%** or **1,236 points** to end at **82,498**. The broader market sentiment turned cautious as roughly **₹3 lakh crore** in market capitalization was erased in a single session. Sector Performance While most sectors ended in the red, there were distinct outliers. **Financials** and **Metals** showed relative resilience earlier in the week, but ultimately succumbed to the broader sell-off. **Nifty Bank** closed near **61,200**, down approximately **0.6%**. The index formed a bearish engulfing candle on the daily chart, indicating strong profit-taking at elevated levels. Immediate support is seen at **60,300**. In the commodities space, **Brent Crude** surged to approximately **$89 per barrel** due to geopolitical tensions. Conversely, **Gold** prices on the MCX saw a decline, trading near **₹154,850 per 10g**, while the **Indian Rupee** remained steady at **90.67** against the US Dollar. Brokerage Recommendations Top firms have issued fresh calls for specific stocks, highlighting significant upside potential despite the current volatility. **Citi on LIC Housing Finance** The firm maintains a **Buy** rating with a target of **₹730**. Given the current price of **₹521**, this suggests a potential upside of **40%**. **Motilal Oswal on Tata Steel** A **Buy** recommendation remains with a target of **₹240**. Currently trading at **₹209**, the stock offers an estimated **14%** return potential. **Elara Capital on Safari Industries** Analysts have reiterated a **Buy** call, raising the target price to **₹3,248**. With the stock at **₹1,803**, this implies a massive **80%** upside. **Bajaj Broking on IndusInd Bank & UPL** IndusInd Bank and UPL are highlighted as top picks for a **3-month** horizon, targeting recovery from recent support levels. **Morgan Stanley on Infosys** The brokerage maintains an **Equal Weight** stance with a target of **₹1,760**, projecting a **26%** gain from the current price of **₹1,391**. Global Context The domestic sell-off occurred despite a firm performance in US markets overnight. The **S&P 500** and **Nasdaq** gained **0.56%** and **0.78%** respectively, supported by robust technology earnings. However, Asian markets presented a mixed bag. Japan's **Nikkei 225** advanced **0.66%**, while major Chinese markets remained closed for the Lunar New Year. The divergence between strong global tech cues and domestic profit-booking highlights a shift toward local risk management.

10 Stocks Drop Below 200-Day Moving Average
Market performance in February 2026 continues to lean heavily on the 200-day moving average (DMA) as a critical barometer for long-term health. This indicator, which averages closing prices over the last 200 trading sessions, is currently revealing a significant divergence between headline index levels and the health of individual stocks. In the U.S. market, the S&P 500 is trading near the **6,843** level as of mid-February. While the index remains in a broader uptrend, internal breadth is showing signs of strain. Recent data indicates that approximately **64%** of S&P 500 stocks are trading above their 200-DMA, down from higher levels seen earlier in the cycle. The technology sector is experiencing a "hidden breakdown" within this framework. Despite some mega-cap stability, roughly **57%** of S&P 500 technology companies are now trading below their 200-DMA. This suggests a loss of momentum for a majority of tech firms, even as the primary indices stay afloat. Across global markets, specifically in India, the Nifty 50 and Sensex have faced recent pressure, with the Sensex closing near **82,626**. Technical scans show a selective recovery; on February 17, only **13** major stocks in the Nifty 500 pack successfully crossed above their 200-DMA, signaling potential breakouts for those specific names. Traders utilize the 200-DMA to separate "noise" from true trend shifts. When a stock price stays above this line, it is viewed as a sustained uptrend. Conversely, falling below it often triggers defensive selling. For example, high-profile names like Reliance Industries and HDFC Bank have recently been flagged for trading below this long-term average. The 200-DMA also functions as psychological support. In a "buy the dip" environment, prices often bounce after touching this average. However, if an index like the Nifty IT plunges—as it did by over **8%** in a single week this month—the 200-DMA serves as a "ceiling" or resistance level that must be reclaimed to prove a trend reversal. Current sentiment for 2026 remains cautious but opportunistic. Analysts point out that while valuations have corrected to around **20 times** trailing earnings, the market is waiting for broader participation. The reliance on the 200-DMA is expected to intensify as investors look for confirmation that the current bull cycle has the durability to continue through the second half of the year.

Manilam Industries IPO: GMP, Price Band, and Subscription Details
Manilam Industries India officially opened its Rs 39.95 crore SME IPO for subscription today, February 20, 2026. The bidding window remains active through February 24, with the company targeting a listing on the NSE SME platform on February 27. The price band is fixed at Rs 65 to Rs 69 per share. Investors must bid for a minimum lot size of 2,000 shares, requiring a base investment of Rs 1,38,000. Ahead of the public launch, the company successfully secured Rs 11.30 crore from anchor investors on February 19. The total issue consists of a fresh issue of 47.36 lakh shares and an offer for sale of 10.92 lakh shares. Financially, the company has shown consistent growth. Total income reached Rs 142.16 crore in FY25, up from Rs 138.04 crore in FY24. More significantly, profit after tax more than doubled year-on-year, rising from Rs 3.10 crore to Rs 7.38 crore. Proceeds from the fresh issue are earmarked for strategic expansion. Specifically, Rs 16.65 crore is allocated for working capital, while Rs 3.45 crore will fund new plant machinery and solar panel installations at the Bareilly facility. The decorative laminates market in India is currently valued at approximately USD 1.32 billion as of 2025. It is projected to grow at a CAGR of 5.35% through 2031, driven by a 33% year-over-year increase in new home deliveries. Manilam operates on a B2B model, managing a network of over 50 distributors and 7,000 dealers. The company has recently expanded its physical presence with experience centers in Bangalore, Delhi, and Chennai to capture rising demand for modular furniture. Current grey market activity shows a flat premium of Rs 0, suggesting a neutral start as the subscription period begins. Market participants are closely watching the retail and NII portions, which account for 33.3% and 14.3% of the offer respectively.

Gaudium IVF IPO: Brokerage Reviews, GMP, and Subscription Details
Gaudium IVF and Women Health Limited has launched its Rs 165 crore initial public offering today, February 20, 2026. This move marks a significant milestone as the company becomes the first pure-play fertility services provider to enter the Indian public markets. The IPO is structured with a price band of Rs 75 to Rs 79 per share. It consists of a fresh issue of Rs 90 crore and an offer-for-sale of 94.93 lakh shares valued at Rs 75 crore. Investors can participate with a minimum lot size of 189 shares, requiring a retail investment of Rs 14,931 at the upper price limit. Ahead of the opening, the company successfully raised Rs 49.5 crore from anchor investors, including Meru Investment Fund and Sanshi Fund. Market sentiment remains cautiously optimistic, with grey market premiums indicating a potential listing gain of approximately 15%, pointing toward an estimated debut price near Rs 91 per share. The capital raised will be strategically deployed to fuel aggressive expansion. Gaudium plans to allocate Rs 50 crore to establish 19 new IVF centers across India, targeting a mix of metro and Tier-2/3 cities. Additionally, Rs 20 crore is earmarked for debt repayment to strengthen the balance sheet. Financial performance has shown robust momentum leading up to the listing. Revenue from operations climbed from Rs 44.24 crore in FY23 to Rs 70.72 crore in FY25. Profitability followed a similar trajectory, with profit after tax reaching Rs 19.13 crore in FY25, supported by strong EBITDA margins of 40.48%. The broader Indian IVF market is currently valued at approximately $2.54 billion and is projected to double to $5.03 billion by 2034. Growth is being driven by rising infertility rates—now affecting an estimated 10–15% of couples—alongside increasing social acceptance and advancements in reproductive technology. Gaudium operates a capital-efficient hub-and-spoke model, currently managing over 30 locations including seven major hubs in cities like Delhi, Mumbai, and Bengaluru. This network handled over 3,400 IVF cycles in the last fiscal year, maintaining a success rate of nearly 59%. While the sector offers high growth potential, investors are monitoring risks such as high employee attrition and heavy reliance on specialized medical talent. However, with the Indian healthcare IPO pipeline expected to hit Rs 20,000 crore this year, Gaudium stands as a frontrunner in an increasingly organized and institutionalized specialty care market. Subscription for the issue will remain open until February 24, with the final allotment expected on February 25. The shares are scheduled to debut on the BSE and NSE on February 27, 2026.