Bullish News
Collection
Dollar Records Significant Weekly Gain Amid Tightening Monetary Policy and Geopolitical Tensions
The US Dollar Index (DXY) is trading at approximately **97.87**, marking a significant recovery from its four-year lows reached earlier this year. The currency is currently on track for its strongest weekly performance in over four months, bolstered by a convergence of resilient economic data and shifting monetary policy expectations. Recent labor market statistics show a gain of **130,000** nonfarm payrolls for January 2026, the largest monthly increase in over a year. Additionally, industrial production rose by **0.7%** in January, further signaling that the domestic economy remains on a stable footing despite previous slowdown concerns. The Federal Reserve has adopted a more hawkish posture, maintaining the federal funds rate at a range of **3.50% to 3.75%**. Policymakers have signaled a reluctance to proceed with further rate reductions in the immediate term, citing "solid" economic growth and the risk of persistent inflation. Market expectations for rate cuts in 2026 have consequently been scaled back. Geopolitical instability is providing a powerful safe-haven tailwind for the greenback. Tensions with Iran have escalated following a **15-day** ultimatum regarding its nuclear program, driving capital toward defensive assets. This risk premium has also propelled gold prices toward the **$5,000** per ounce threshold and pushed oil futures above **$70** per barrel. Foreign exchange pairs reflect this broad dollar resurgence. The Euro has weakened significantly, with the EUR/USD pair dropping to a low of **1.1756**. Sterling is facing similar downward pressure, with GBP/USD trading near **1.3486** as the market weighs the contrast between the Federal Reserve’s pause and potential easing from the Bank of England. Treasury yields have climbed in tandem with the dollar's strength. The **2-year** Treasury yield is currently hovering near **4.48%**, while the **10-year** benchmark has moved up to **4.10%**. These higher yields continue to enhance the relative attractiveness of dollar-denominated assets for international investors.

**U.S. Equities Decline Led by Weakness in Nvidia and Private Equity Firms**
Market Brief: Wall Street Sentiment Shifts Wall Street concluded the February 19 session with a downward trajectory, as the **S&P 500** fell **0.28%** to finish at **6,861.89**. The **Nasdaq Composite** declined **0.31%** to **22,682.73**, while the **Dow Jones Industrial Average** saw a steeper drop of **0.54%**, closing at **49,395.16**. Trading activity remained lighter than the recent average, with **16.4 billion** shares changing hands compared to the **20.5 billion** 20-session benchmark. Private Equity and Credit Pressure The private equity sector experienced significant turbulence following a strategic pivot by **Blue Owl Capital**. The firm announced a freeze on redemptions at one of its funds and a **$1.4 billion** asset sale to manage debt obligations. This move triggered a **6%** tumble in Blue Owl’s stock and dragged down industry peers. **Apollo Global Management**, **KKR & Co**, and **The Carlyle Group** saw losses ranging between **1.9%** and **5.2%**. The sell-off reflects growing investor anxiety regarding credit quality and the heavy exposure of lenders to the software sector. Tech Giants and AI Realignment Mega-cap tech stocks acted as a primary drag on the major indices. **Apple** shares dipped **1.4%**, marking it as the single largest weight on the S&P 500 during the session. **Nvidia** also faced pressure as the market reevaluates whether massive capital expenditures in artificial intelligence are yielding proportional revenue growth. Investor sentiment has been impacted by concerns that emerging AI tools—specifically "agentic AI" and new releases from firms like Anthropic—could disrupt the business models of legacy software-as-a-service (SaaS) providers. High valuations in the sector are under scrutiny as the narrative shifts from AI as a growth tailwind to AI as a competitive threat. Corporate Performance and Retail **Walmart** shares dropped **1.4%** to close at **$124.87**. Despite a strong holiday quarter with e-commerce growth of **25%**, investors reacted to a conservative fiscal 2027 forecast and a "somewhat unstable" consumer outlook provided by the new leadership. Conversely, **Deere & Co** provided a rare bright spot, surging **11.6%** after raising its annual profit guidance. **Omnicom** also saw a significant jump of **15%** following a fourth-quarter revenue beat. Macroeconomic and Fed Outlook Market participants are currently processing minutes from the Federal Reserve, which indicate a split among policymakers. While the benchmark rate remains at **3.50-3.75%**, the unexpected resilience of the labor market—with unemployment at **4.4%**—has shifted expectations for the next potential rate cut from June to July 2026. Treasury yields reacted to the hawkish tone of the minutes, with the **10-year yield** trading near **4.10%** and the **2-year yield** holding at **4.47%**. Investors are now focusing on the upcoming Core PCE inflation data to determine the central bank's next move.

Sensex, Nifty 50 Open Flat as Asian Markets Decline
**Global Markets Brief: February 20, 2026** The global financial landscape is navigating a complex transition as the "Year of Truth" for AI matures and central banks hold a steady hand on interest rates. While foundational growth remains resilient, a noticeable shift toward defensive sectors and high-quality credit is defining the current quarter. **Equity Markets: Tech Volatility and Sector Rotation** Wall Street indices have recently pulled back from record highs as the initial AI hype cycle evolves into a phase of rigorous valuation. The **S&P 500** is hovering around the **6,832** mark, reflecting a **1.6%** decline in the most recent session. Similarly, the **Dow Jones Industrial Average** shed **1.3%** to settle at **49,451**, while the **Nasdaq** tumbled **2%** to **22,597**. Investor sentiment has become increasingly sensitive to the revenue-generating capabilities of AI investments. Consequently, we are seeing a rotation away from communication services and tech, which saw drops of **1.8%** and **2.6%** respectively, toward defensive havens. The **Utilities** sector gained **1.5%**, while **Consumer Staples** rose by **0.9%**. **Interest Rates and Central Bank Policy** Monetary policy remains in a holding pattern. The **Federal Reserve** and other major central banks have largely maintained existing rates following a series of cuts throughout 2025. In India, the **RBI** kept the repo rate unchanged at **5.25%** in its February session, projecting a "Goldilocks" scenario of **7.4%** GDP growth alongside manageable inflation. Global 10-year bond yields are staying range-bound. Market analysts anticipate a brief rally mid-year with potential **50 basis point** cuts if labor data softens, though yields are expected to drift higher by the fourth quarter as AI-related infrastructure financing puts pressure on credit markets. **Commodities: Energy and Metals** Energy markets are currently "flashing red" due to heightening geopolitical friction. **Brent Crude** has crossed the **$71.41** per barrel mark, while **WTI** settled near **$66.11**, marking a sharp climb driven by risk premiums rather than supply fundamentals. Precious metals continue to show immense resilience. International gold prices have touched all-time highs, with spot gold holding near **$5,000** per ounce. In domestic markets, prices have been even more pronounced, with 24K gold reaching approximately **₹1,56,510** per **10 grams** in India, a gain of **0.29%** in the latest trading cycle. **Technology and the "Prototype Economy"** The tech sector is shifting from "writing code" to "expressing intent." AI is no longer an experiment; it has become the backbone of enterprise architecture. However, this has created a "prototype economy" where the speed of development brings new risks in governance and data sovereignty. Cloud 3.0 has emerged as the standard, focusing on hybrid and sovereign models to manage sensitive data for AI training. While AI disruption fears have hit sectors like private equity and logistics—where firms like **Blue Owl Capital** recently froze redemptions—the long-term outlook remains bullish for companies that successfully integrate intelligent operations. **Key Market Indicators (Latest)** * **S&P 500:** 6,832.76 (**-1.6%**) * **Nasdaq Composite:** 22,597.15 (**-2.0%**) * **Brent Crude:** $71.41/bbl * **Gold (Spot):** ~$5,000/oz * **RBI Repo Rate:** 5.25% (Unchanged) * **VIX Index:** 20.82 (**+17.96%**)

Indian Bank: Technical Breakout and Derivatives Market Outlook
Global Luxury Market Brief: February 2026 The global luxury market is entering a phase of stabilization following a period of significant volatility. Total market valuation for 2026 is projected to reach **$484.15 billion**, reflecting a moderated organic growth rate of approximately **4% to 6%**. This represents a shift from the double-digit post-pandemic surges toward a more disciplined, quality-driven expansion model. Key Performance Indicators Sector performance remains polarized. Jewelry is currently the primary growth engine, expanding at a rate of **4% to 6%** due to its perceived investment value. Personal luxury goods, including fashion and leather, have faced steeper resistance, with some segments reporting a **3% decline** in organic sales as consumers show signs of price fatigue. * **Global Market Size (2026):** $484.15 billion * **Projected CAGR (2026–2031):** 4.32% * **Sector Growth Leader:** Jewelry (**+6%**) * **Underperforming Segments:** Shoes and Leather Goods (Softening demand) Regional Dynamics and Trade Geographic performance is fracturing into a "K-shaped" recovery. The United States and Middle East are emerging as the most resilient regions, while China continues a gradual but uneven recovery. Currency headwinds and new trade policies are impacting margins. Luxury groups are navigating **15% tariffs** on many European goods shipped to the U.S., which is expected to pressure profitability throughout the fiscal year. The "Silent Quarter"—regions including Southeast Asia, India, and Latin America—now accounts for nearly **25% of global sales**, matching the scale of mainland China and providing a critical buffer against traditional market slowdowns. Consumer Trends and Shifts The luxury consumer base has contracted from **400 million** in 2022 to approximately **340 million** in 2026. This contraction is driven by the exit of "aspirational" shoppers who have been priced out by aggressive multi-year increases. * **Gen Z Influence:** By 2030, younger cohorts will represent **25% to 30%** of all luxury purchases. * **The Experience Economy:** Spending is shifting away from "conspicuous consumption" toward experiential luxury, including high-end hospitality and fine dining, which saw growth of **5% to 7%** respectively. * **Maximalism vs. Quiet Luxury:** While "Quiet Luxury" remains a staple for ultra-high-net-worth individuals, Gen Z is driving a resurgence in maximalism and "vibe-led" aesthetics. Corporate Outlook and Stock Performance Market bellwethers are signaling caution. Recent earnings reports from major conglomerates like LVMH showed a modest **1% revenue rise**, which fell short of investor expectations for a swifter rebound. This led to a sector-wide recalibration, with major luxury stocks seeing corrections between **2% and 8%** in early 2026 trading. The industry is now focusing on "Hyper-Personalization" and retail optimization. Brands are reducing total store footprints in favor of larger, immersive flagship locations in top-tier cities to foster deeper emotional connections with a smaller, more elite customer base. High-end brands in Japan and the Middle East continue to outperform, while the broader Asian market remains a complex variable for the remainder of the year.

Federal Bank, Waaree Energies, ICICI Pru Life, Zydus, and HUL Lead Market News
Market Brief: Indian Equities Face Sharp Correction The Indian benchmark indices experienced a significant downturn on Thursday, February 19, 2026, snapping a three-day winning streak. A wave of aggressive profit-taking combined with a risk-off sentiment led to a broad-based sell-off across almost all sectors. The **S&P BSE Sensex** plummeted **1,236 points**, or **1.48%**, to close at **82,498.14**. Simultaneously, the **Nifty 50** dropped **365 points**, or **1.41%**, ending the session at **25,454.35**. This single-day decline wiped out approximately **Rs 7.5 lakh crore** in investor wealth. Key Market Drivers The sharp decline was triggered by escalating geopolitical tensions between the U.S. and Iran, which caused global crude oil prices to spike. Uncertainty regarding the U.S. Federal Reserve's interest rate trajectory also weighed heavily on investor sentiment following the release of recent meeting minutes. Market volatility, as measured by the **India VIX**, surged by **10.12%** to reach **13.46**. The broader market mirrored the benchmarks, with the **BSE MidCap** and **SmallCap** indices falling **1.54%** and **1.16%** respectively. Corporate Highlights and Stock Moves **Hindustan Unilever Limited (HUL)** The FMCG major announced a massive investment of **Rs 2,000 crore** over the next two years. This capital is earmarked for expanding manufacturing capacity in premium categories, specifically within Beauty & Wellbeing and Home Care liquids. Despite the market carnage, HUL shares showed resilience earlier in the week, closing at **Rs 2,323.50**. **ICICI Prudential Life Insurance** The insurer is navigating significant tax-related developments. It received an appellate order upholding a tax demand of **Rs 984 crore** related to GST input tax credit reversals from 2017 to 2022. Additionally, a separate GST dispute for the 2018 fiscal year involving **Rs 216.44 crore** saw partial relief, though the company plans to appeal the remaining demand. **Federal Bank** The banking sector faced intense pressure during the session. While specific tax refund news for Federal Bank is being monitored by participants, the broader private banking space saw heavy selling. The **Nifty Bank** index ended the day at approximately **61,200**, down **0.6%**, slightly outperforming the wider market despite the bearish tone. Sectoral Performance Every major sectoral index on the NSE ended in the red. The **Realty** sector led the losses with a **2.5%** drop, followed by **Auto**, **FMCG**, and **Financial Services**, all declining by more than **1%**. Defensive sectors like **IT** provided a minor buffer early in the session, with heavyweights like Infosys and TCS seeing selective interest, though they eventually succumbed to the overarching market pressure. Outlook for February 20 Early indicators from the **GIFT Nifty** suggest a possible technical pullback, with futures trading slightly higher by **0.06%** at **25,844**. Global cues from Asia and Wall Street remain cautiously positive, which may support a modest recovery at the opening. Investors are expected to remain watchful of the **25,300** level for the Nifty 50, which serves as immediate support. Sustained trading below this mark could invite further weakness toward the **25,000** psychological barrier.

Institutional Investors Position Portfolios Against Near-Term Fed Rate Cut Expectations
Major institutional money managers are intensifying their bets against US government bonds as the 2026 economic landscape shifts. While the broader market anticipated a steady cycle of rate reductions, leading funds are now bracing for a "higher-for-longer" reality. The Federal Reserve recently held interest rates steady at a target range of **3.50% to 3.75%**. This pause follows three consecutive cuts at the end of last year. Despite some internal pressure for further easing, the central bank’s recent policy statement shifted to a more hawkish tone, describing US economic growth as "solid" and the labor market as "stabilizing." Inflation remains a primary concern for those betting against a bond rally. Annual consumer price growth slowed to **2.4%** in January 2026, yet core inflation sits at **2.5%**. Many analysts believe structural factors, including recent tariff implementations and supply chain shifts, will keep these figures above the Fed’s **2.0%** target for the foreseeable future. Market pricing currently implies roughly **50 basis points** of total easing for the remainder of 2026. However, skeptics point to a resilient unemployment rate of **4.4%** and robust consumer spending as evidence that aggressive cuts are unnecessary. Some institutional forecasts suggest the Fed may remain on hold for the entire year to prevent an inflationary rebound. The US Treasury market reflects this tension. The 10-year Treasury yield recently hovered around **4.04%**, while the 2-year note stood at **3.40%**. Money managers shortening their bond exposure anticipate that yields will remain elevated or climb higher if the Federal Reserve continues to prioritize inflation control over growth stimulation. Further uncertainty stems from a looming transition in Federal Reserve leadership. The nomination of Kevin Warsh as the next Fed Chair has introduced a new variable. Historically viewed as more hawkish on inflation, his potential appointment has already sparked rallies in the US dollar and added weight to the argument that rate cuts will be more gradual than previously hoped. Investors are now watching the March **17–18** policy meeting. This event will provide updated economic projections and the latest "dot plot," which will clarify if the central bank intends to follow through with the **3.0% to 3.5%** year-end rate range currently projected by some market participants.

MAS Financial Performance and Growth Outlook
MAS Financial Services (MFSL) continues to demonstrate robust fundamental strength, recently outperforming its sector index with a 9% stock gain. The company is currently trading near ₹330–₹340, maintaining a healthy market capitalization of approximately ₹6,000 crore. Latest Q3 FY2026 data confirms an acceleration in growth, with consolidated Assets Under Management (AUM) rising 18.3% year-on-year to reach ₹14,641 crore. This momentum is supported by a 23% increase in total income, which climbed to ₹481 crore for the quarter. Profitability remains a core highlight, with standalone Profit After Tax (PAT) increasing 20% to reach ₹93.5 crore. The company's net interest margins have shown improvement even as the broader NBFC sector faces regulatory tightening. Asset quality remains disciplined, with Net Stage 3 assets stable at 1.72%. The company’s housing finance subsidiary has emerged as a high-growth engine, reporting a 23% AUM surge to ₹859 crore and an impressive 45% growth in profit. The management has reiterated its ambitious "Vision 2036," aiming to scale AUM to ₹1,00,000 crore over the next decade. To support this, they target a sustainable growth rate of 20% to 25% annually, driven by MSME lending and vehicle finance. Market analysts maintain a "Strong Buy" outlook on the stock, with revised price targets reaching as high as ₹395–₹414. These valuations reflect confidence in the company’s capital adequacy ratio of 22.8%, which provides significant headroom for future disbursements. The broader NBFC landscape in India is projected to reach ₹50 lakh crore in total AUM by March 2027. MFSL is strategically positioned to capture this expansion, particularly in the used-vehicle and micro-LAP segments where it holds a competitive edge. Operational efficiency is being further enhanced through technology, with over 50 digital APIs now integrated for loan sourcing. This digital-first approach is expected to keep credit costs within the managed range of 1.35% to 1.50% while expanding the distribution reach to underserved geographies. [MAS Financial Q3 Earnings Analysis](https://www.youtube.com/watch?v=ctjYRjuQTiE) This video provides direct commentary from the management on the latest quarterly results and the progress toward their long-term AUM targets. http://googleusercontent.com/youtube_content/0

Bajaj Finserv to Launch $1 Billion Alternative Investment Platform
Bajaj Finserv has launched its specialized alternative investment vertical, targeting a capital raise of **$1 billion** across high-growth asset classes. This strategic expansion signals a pivot from traditional financial products toward more sophisticated, high-alpha vehicles. The new platform focuses on four core pillars: private equity, liquid alternatives, listed equity, and real estate. This move comes as India’s Alternative Investment Fund (AIF) market experiences a significant surge, with total commitments reaching **₹15.05 lakh crore** by late 2025. Deployment of this capital is scheduled to begin in the next fiscal year. The firm is currently finalizing a 40-member specialized team designed to deliver consistent market outperformance through proprietary investment frameworks. Market conditions for this launch remain supportive. India's GDP growth is forecasted at **6.4%** for 2026, and private equity inflows into real estate are projected to rise **28%** to roughly **$4.4 billion** this year. Bajaj Finserv aims to capitalize on this recovery, particularly in office assets which recently dominated **58%** of sector inflows. The platform is entering a maturing ecosystem where domestic investors now contribute **₹4.74 lakh crore** to AIFs. By integrating liquid alternatives and structured real estate deals, the firm is positioning itself to capture "alpha" in a landscape where traditional long-only strategies have seen moderate returns of **8.7%**. This initiative is part of a broader group strategy to deepen its asset management footprint. With recent moves to consolidate its insurance holdings and expand its mutual fund AUM to over **₹29,500 crore**, the $1 billion alternatives arm represents the next phase of institutional growth for the conglomerate.

Oil Exploration Stocks Rise Amid Supply Concerns
Market Brief: Energy Sector and Geopolitical Volatility Geopolitical tensions in the Middle East have reached a critical threshold, injecting a significant risk premium into global energy markets. As of February 20, 2026, the standoff between the United States and Iran has moved beyond rhetoric, with military posturing near the Strait of Hormuz triggering a sharp revaluation of crude oil. Global benchmarks have surged in response to stalled nuclear negotiations in Geneva. Brent crude has breached the $71 per barrel mark, a level not seen since mid-2025, while West Texas Intermediate (WTI) is trading near $66.50. Market analysts estimate that a "war premium" of approximately $13 per barrel is now embedded in these prices due to the potential for immediate supply shocks. The Strait of Hormuz remains the primary focal point for investors. This maritime chokepoint handles roughly 21 million barrels of oil per day, representing over 20% of global consumption. Recent live-fire naval drills by Iran and the deployment of U.S. aircraft carrier strike groups to the region have raised the probability of a military strike to an estimated 70%, according to some risk models. In the Indian equity markets, this volatility has created a clear divide between upstream explorers and downstream marketers. Upstream giants like ONGC and Oil India have seen their shares buoyed by the prospect of higher realization prices. ONGC stock recently climbed 3.80% to reach 274.65 INR, while Oil India remains a key beneficiary of the uptrend in exploration and production margins. Conversely, oil marketing companies (OMCs) are facing increased pressure. While firms like Indian Oil Corporation (IOCL) reported strong profits in the previous quarter—with a standalone net profit of 12,126 crore INR—rising crude costs threaten to squeeze future marketing margins. The ability of these firms to maintain profitability depends heavily on whether they can pass on these 4-5% price spikes to consumers. The broader economic impact of this energy surge is being closely monitored by central banks. If Brent continues its trajectory toward the $90-$100 range, it could reignite global inflation and delay anticipated interest rate cuts. For now, the market remains in a state of high alert, awaiting definitive signals from the White House regarding potential military intervention. [Strait of Hormuz Oil Tensions](https://www.google.com/search?q=https://www.youtube.com/watch%3Fv%3DFj-E_809S0Y) This video provides a detailed visual explanation of why the Strait of Hormuz is the world's most vital energy chokepoint and how its closure would impact global oil supplies.

Europe Wealthy Investors Shift Toward Daily Liquidity Hedge Funds
Europe's wealthiest investors are pivotally reconfiguring their portfolios as the era of high cash yields draws to a close. With the European Central Bank maintaining a neutral policy stance near 2.00% and real interest rates hovering around zero, the "hunt for yield" has moved beyond traditional fixed income. Liquid alternative UCITS funds have emerged as the primary beneficiary of this transition. These vehicles, which provide hedge fund-style strategies with daily liquidity and strict regulatory oversight, saw a massive 22% rise in assets throughout 2025. This surge reversed several years of outflows, signaling a structural shift in how private wealth is managed across the continent. Net inflows into liquid alternatives reached approximately €6.9 billion in the first half of last year alone. Investor demand has been particularly concentrated in defensive and absolute return strategies. Absolute Return Bond funds led the charge with nearly €3.91 billion in new capital, as investors sought to protect against volatility while capturing returns above the standard 3.1% yield seen in investment-grade credit. Market dynamics in early 2026 show that "Alternative Equity Market Neutral" and "Long/Short" strategies are gaining significant momentum. These products are being utilized to mitigate risks associated with high equity valuations and the potential for market corrections. While the average performance of liquid alternatives was affected by a 14% depreciation of the US dollar against the Euro in late 2025, the asset class maintained its reputation for stability, with many strategies recording smaller drawdowns than global equities. The regulatory environment is also evolving to support this growth. The review of the UCITS Eligible Assets Directive (EAD) and the full implementation of the Markets in Crypto-Assets (MiCA) regulation are creating a more transparent framework for sophisticated retail products. Wealth managers are now integrating these semi-liquid and alternative structures as core "allocation engines" rather than niche additions. High-net-worth individuals are increasingly replacing traditional government bonds with these alternative vehicles to achieve an average performance of 4.6% per annum over a five-year horizon. As €3.5 trillion in European wealth begins to transfer to a younger, more tech-savvy generation, the demand for mobile-accessible, transparent, and high-performing liquid alternatives is expected to accelerate through the remainder of 2026. Current trends indicate that the line between traditional and alternative investing is blurring. With credit spreads remaining tight and volatility persisting in tech-heavy indices, liquid alternatives have become an indispensable building block for the modern European portfolio.

FPIs Record Highest Fortnightly Inflow Since April 2025 as IT Sector Outflows Persist
Foreign portfolio investors (FPIs) have executed a massive tactical pivot in February 2026, rotating capital from the service-oriented IT sector into the "real economy" engines of India. In the first fortnight of February, FPIs injected a net **₹19,675 crore** into Indian equities. This aggressive buying reversed a dismal January that saw outflows of **₹35,962 crore**. This surge represents the highest fortnightly purchase since April 2025, signaling a renewed appetite for domestic growth stories. The capital goods sector emerged as the primary beneficiary, attracting **₹8,032 crore** in foreign inflows. This movement is driven by a record capital expenditure plan in the Union Budget 2026, which prioritizes defense, railways, and semiconductors. Major players like Bharat Heavy Electricals and Dixon Technologies have gained momentum as order backlogs across power and infrastructure platforms accelerate. Financial services and the oil & gas sector also saw substantial interest, with inflows of **₹6,175 crore** and **₹4,678 crore**, respectively. Despite recent volatility in crude prices, the energy sector has been bolstered by stellar refinery earnings, with average gross refining margins (GRMs) jumping **135%** year-on-year to **$11.4 per barrel**. In contrast, the IT sector is grappling with a "perfect storm." Foreign investors offloaded nearly **₹11,000 crore** in IT stocks during the first half of the month. The Nifty IT index has plunged more than **16%** in the last 30 days, hit by fears of "AI revenue deflation." Markets are concerned that advanced AI agents are disrupting the traditional headcount-based billing model, potentially shrinking the billable hours for major firms like TCS and Infosys. Broader market indicators reflect this tug-of-war. The Nifty 50 is currently hovering around the **25,450** level, while the Sensex trades near **83,300**. While institutional selling has created pressure, domestic institutional investors (DIIs) continue to act as a buffer, supported by robust SIP inflows of **₹31,000 crore** per month. The macroeconomic backdrop remains supportive of this sector rotation. India’s GDP growth for Q2 FY26 surprised at **8.2%**, and retail inflation has stabilized at **2.75%**. Furthermore, a landmark trade deal between India and the U.S. has provided a structural boost to export-oriented manufacturing, further encouraging the shift toward tangible industrial assets over software services.

IndusInd Bank CEO States Board Holds Final Authority on Strategic Decisions
**INDUSIND BANK MARKET BRIEF: FEBRUARY 2026** **Executive Leadership and Governance Reset** IndusInd Bank is undergoing a significant structural overhaul to restore investor confidence. Arijit Basu has officially assumed the role of Part-Time Chairman as of **January 31, 2026**, succeeding Sunil Mehta. This transition is part of a broader board restructuring aimed at enhancing oversight following past accounting lapses. MD & CEO Rajiv Anand is leading the operational reset, focusing on accountability and the closure of technology and control gaps. The bank is prioritizing internal stability and balance sheet "right-sizing" before entertaining major strategic mergers or investor entries, which remain under the board's discretion. **Financial Performance and Stock Valuation** The bank returned to profitability in the quarter ended **December 31, 2025**, reporting a net profit of **128 crore**. While this is a recovery from previous losses, it represents a **90%** decline compared to the previous year, primarily due to elevated credit costs and provisioning of **2,096 crore**. As of **February 19, 2026**, the stock was trading at approximately **927.35**, reflecting a **1.84%** daily decline but showing resilience with a **10.4%** gain over the last three months. The bank’s market capitalization stands near **72,243 crore**, with a Price-to-Book (P/B) ratio of **1.14**, indicating the market is valuing the lender close to its fundamental book value. **Strategic Growth Verticals** The bank is pivoting toward a more granular and stable retail franchise. Key growth targets include: * **Gold Loans:** Scaling operations to **500 branches** to capture a share of the rapidly expanding market, which has seen **125%** year-on-year growth. * **MSME Lending:** Aiming to double the current MSME book from **45,000 crore** to **90,000 crore** to leverage high credit demand in the sector. * **Affordable Housing:** Expanding its footprint in the low-cost housing segment to diversify the loan portfolio. **Liability Management and Asset Quality** Efforts to improve liability generation are underway as the bank moves away from volatile bulk deposits. The CASA ratio stood at **30.3%** in December 2025, down from **34.9%** a year prior, highlighting the competitive pressure in attracting low-cost deposits. Asset quality is showing early signs of stabilization. The Gross NPA ratio was reported at **3.56%** for the most recent quarter, with the Net NPA at **1.04%**. Management has guided for a Return on Assets (RoA) of **1%** by the end of **FY27**, contingent on continued recovery in the microfinance segment and cost optimization.

Investors Rotate From AI to Infrastructure Amid Market Shift
As the initial euphoria surrounding consumer AI begins to stabilize, a significant rotation is occurring within the financial markets. Investors are increasingly shifting capital away from software-focused "hyperscalers" and toward the physical "nuts and bolts" of the industry. This move comes as major tech firms prepare to spend over **$700 billion** in capital expenditures for **2026**, with approximately **75%** of that total dedicated specifically to infrastructure. Infrastructure Sector Performance Market participants are now rewarding the companies that receive these massive checks rather than those writing them. While the Magnificent 7 index has faced recent downward pressure, losing roughly **7.3%** in the early months of **2026**, infrastructure-focused portfolios have seen substantial gains. A prominent AI Supercycle ETF has surged **16.87%** year-to-date, reflecting a clear preference for the tangible components of the AI ecosystem. Energy and Power Demand The most dramatic transformation is visible in the utility sector. Once considered defensive havens for dividends, power companies are being revalued as high-growth vehicles. This is driven by an insatiable demand for electricity; a single AI query can consume up to **1,000 times** more power than a standard search. * U.S. data center electricity demand is projected to **triple** by **2030**. * By the end of this decade, these facilities could consume **10%** of total U.S. power. * More than **125 gigawatts** of incremental power demand has already been announced for new projects. Hardware and Construction The physical build-out of data centers is creating an "investment supercycle" that may require up to **$3 trillion** in total investment by **2030**. This demand has kept chipmakers and hardware providers in a strong position despite broader market volatility. The average cost of data center construction has climbed to **$11.3 million** per megawatt in **2026**, a **6%** increase over the previous year. Lead times for critical equipment like turbines and specialized power transformers remain extended, further cementing the pricing power of established infrastructure players. Semiconductors and Networking In the semiconductor space, the focus is expanding from GPUs to networking and memory. Memory revenues are forecast to reach **$200 billion** in **2026**, representing **25%** of the entire semiconductor market. Leading chip firms are reporting revenue commitments exceeding **$500 billion** for their next-generation systems through the end of the year. This shift toward the physical backbone suggests that while the software applications of AI continue to evolve, the underlying infrastructure is where the immediate financial momentum resides.

Strive Asset Management Acquires MAGA ETF
Market Brief: Truth Social ETF Expansion Yorkville America Equities LLC has accelerated its push into values-aligned investing with the strategic acquisition of the **Point Bridge America First ETF (MAGA)**. This move, announced in February 2026, marks the second major consolidation for the Truth Social ETF franchise this year, following the January agreement to acquire the **God Bless America ETF (YALL)**. These acquisitions are part of a broader reorganization aimed at integrating "America First" investment strategies under the **Truth.Fi** fintech brand. Upon completion of the regulatory process in the second quarter of 2026, the funds will be rebranded as the **Truth Social America First ETF** and the **Truth Social God Bless America ETF**, respectively. Asset Impact and Fund Performance The acquisitions provide a significant boost to Yorkville’s managed assets. The God Bless America ETF currently holds approximately **$102 million** in assets under management (AUM), while the Point Bridge America First ETF contributes roughly **$32 million**. Market performance for these funds remains a key focus for investors: * **MAGA** is currently trading near **$55.82**, having gained approximately **4.1%** year-to-date. It maintains a **0.72%** expense ratio and primarily targets mid-cap value companies that align with conservative domestic priorities. * **YALL** is trading at approximately **$44.15** with a net expense ratio of **0.65%**. The fund has demonstrated resilience in the large-blend category, posting a **14.2%** return over the past year. Strategic Outlook The Truth Social ETF franchise is positioning itself to capture the growing demand for politically and socially thematic investments. Beyond equities, Yorkville is actively diversifying its product suite, having filed registration statements earlier this month for two new digital asset ETFs focused on the cryptocurrency market. Under the new structure, Yorkville America Equities will serve as the primary investment adviser. However, to ensure continuity in strategy, the original sub-advisers—Curran Financial Partners for YALL and Point Bridge Capital for MAGA—will continue to oversee day-to-day portfolio management. This consolidation comes at a time when active ETFs are gaining massive traction. In early 2026, active fund inflows have already neared **$400 billion** globally, as investors increasingly seek professional management and thematic precision over traditional passive indexing.

Bain Capital Considering Sale or IPO for Dessert Holdings
Bain Capital is exploring strategic exit options for **Dessert Holdings**, its premium dessert manufacturing platform. The private equity firm is reportedly weighing a direct sale or an initial public offering (IPO) that could value the business at more than **$3 billion**. To manage this dual-track process, Bain has engaged **Goldman Sachs** and **Bank of America**. This move comes as the global dessert grocery market continues its upward trajectory, projected to reach **$26.4 billion** in 2026 with a compound annual growth rate of **6.8%**. Since Bain Capital acquired the company in 2021, Dessert Holdings has undergone significant expansion. Originally operating with three brands, the portfolio has grown to **seven specialized brands**, including The Original Cakerie, Lawler’s Desserts, and the recently acquired **Willamette Valley Pie Company**. The company’s financial profile has strengthened alongside this consolidation. Dessert Holdings now generates approximately **$1 billion** in annual revenue. Its earnings before interest, taxes, depreciation, and amortization (EBITDA) are estimated at over **$200 million** annually. The premium dessert sector is currently being reshaped by two distinct consumer behaviors. While Gen Z and health-conscious buyers are gravitating toward **smaller portion sizes** and "one-bite" formats, there is a simultaneous surge in the **frozen and refrigerated** convenience categories, which are outperforming traditional center-store grocery items. This potential exit follows a broader rebound in the M&A landscape. Global deal values rose **40%** to **$4.9 trillion** in 2025, and current sentiment suggests high activity levels will persist through 2026. Private equity firms are increasingly looking to capitalize on higher valuations by preparing long-held assets for the public markets or strategic buyers. Dessert Holdings is positioned within a competitive landscape of **161 active players**. The company’s focus on high-quality ingredients and a diverse distribution network across North American grocery and food service channels has made it a primary candidate for this multi-billion dollar valuation.

US Trade Goods Deficit Reached Record High in 2025
The United States trade deficit in goods reached an unprecedented **$1.24 trillion** in 2025, according to official Commerce Department data released in February 2026. This record high comes despite the implementation of aggressive, sweeping tariffs during the first year of the current administration’s return to the White House. The effective tariff rate surged to its highest level since the 1930s, yet the appetite for foreign goods remained resilient. Total imports for the year climbed to **$4.33 trillion**, a nearly **5%** increase from the previous year. While the administration aimed to curb the trade gap through protectionist policies, a combination of front-loading by retailers and a massive high-tech spending boom kept import volumes elevated. Technology sectors, particularly those tied to the artificial intelligence build-out, were primary drivers of the deficit expansion. Imports of advanced semiconductors and computer accessories surged to support data center infrastructure. Much of this trade was diverted from traditional partners to new hubs. For instance, while the goods deficit with China narrowed by **30%** to **$202 billion**, the deficit with Taiwan nearly doubled to **$147 billion**, and the gap with Vietnam widened by **44%** to **$178 billion**. The monthly data for December 2025 signaled a sharp acceleration in these trends. The overall trade deficit jumped by **32.6%** in that month alone to **$70.3 billion**. This monthly spike was fueled by a **$12.3 billion** increase in imports, led by industrial supplies and capital equipment, while exports simultaneously fell by **$5 billion**. Despite the record deficit in physical goods, the broader economic picture showed some balance. When services—such as banking, intellectual property, and tourism—are included, the total U.S. trade deficit actually narrowed slightly to **$901.5 billion** for the full year 2025. This was supported by a growing services surplus, which expanded to **$339.5 billion**, up nearly **9%** from the prior year. Current market dynamics suggest that global supply chains are actively rerouting rather than contracting. Companies have shifted sourcing strategies to Southeast Asia and Mexico to mitigate the impact of specific country-targeted tariffs. This "trade diversion" has maintained the overall volume of goods entering the U.S. market, even as the origins of those products shift away from China. Economists note that the persistent strength of the U.S. economy and high consumer demand continue to outpace the impact of rising import costs. With average effective tariff rates now holding near **15%**, the cost of international trade has increased significantly for American businesses, yet the fundamental reliance on global manufacturing remains at an all-time high.

Etsy Shares Rise 10% Following Depop Sale Amid Mixed Results
Etsy shares surged nearly **20%** in premarket trading on Thursday, February 19, 2026, eventually stabilizing at a gain of approximately **10%** following the announcement of a major strategic divestiture. The online marketplace has entered into a definitive agreement to sell its Gen Z-focused fashion resale platform, Depop, to eBay for **$1.2 billion** in cash. Investors appeared to look past mixed fourth-quarter results and a conservative forecast to cheer the company’s return to its "core" marketplace strategy. While Etsy surpassed bottom-line expectations with adjusted earnings of **$0.92 per share**—beating the **$0.85** analyst consensus—its quarterly revenue of **$881.6 million** fell slightly short of the **$884.1 million** expected by Wall Street. The sale of Depop represents a significant pivot for Etsy, which originally acquired the platform in 2021 for **$1.62 billion**. By offloading the subsidiary for **$1.2 billion**, leadership aims to streamline operations and improve overall margins. Depop had been a drag on profitability, contributing to a **350-basis-point** reduction in consolidated adjusted EBITDA margins during 2025 due to high marketing spend and a lower take rate. For eBay, the acquisition is a calculated bet on the "recommerce" boom and younger demographics. Depop currently boasts **7 million** active buyers, nearly **90%** of whom are under the age of 34. The platform generated approximately **$1.1 billion** in gross merchandise sales (GMS) in 2025, showing nearly **60%** year-over-year growth in the United States. eBay plans to integrate Depop’s inventory with its own global logistics and authenticity guarantee programs. Etsy’s core marketplace showed its first signs of stabilization in years. U.S. buyer GMS grew by **0.3%** in the fourth quarter, marking the first positive growth for this segment since late 2021. Consolidated GMS reached **$3.6 billion**, up **2.4%** year-over-year when excluding the divestiture of the music-gear site Reverb. The company expects to close the Depop transaction in the second quarter of 2026. Management intends to use the **$1.2 billion** in proceeds for general corporate purposes, including aggressive share repurchases and reinvestment into its primary platform. Looking ahead to the first quarter of 2026, Etsy guided for GMS in the range of **$2.38 billion** to **$2.43 billion**. This forecast implies a year-over-year growth of **2%** to **4%**. The company also expects a take rate of **25.5%** and an adjusted EBITDA margin between **28%** and **30%** as it exits non-core businesses and focuses on its gifting and handmade categories.

Deere Shares Jump 8% After Company Raises Annual Profit Outlook On Rebounding Sales
Deere & Company has significantly adjusted its fiscal 2026 outlook, signaling a potential bottoming of the agricultural equipment cycle. The machinery giant raised its full-year net income forecast to a range of **$4.5 billion to $5.0 billion**, up from its previous guidance of **$4.0 billion to $4.75 billion**. The updated forecast follows a strong first-quarter performance where the company reported net income of **$656 million**, or **$2.42 per share**. While this represents a year-over-year decline from **$869 million**, it comfortably surpassed analyst expectations of approximately **$2.05 per share**. Total revenue for the quarter rose **13%** to **$9.61 billion**, driven by a sharp divergence in sector performance. The company is leaning on aggressive cost-cutting and a rebound in specific divisions to protect its margins against broader economic headwinds. Construction and Forestry operations emerged as a primary growth engine, with sales surging **34%** to **$2.67 billion**. Operating profit for this segment more than doubled, reflecting robust infrastructure demand and improved production efficiencies. Small Agriculture and Turf units also showed resilience, with sales increasing **24%** to **$2.17 billion**. Operating profit in this category jumped **58%**, supported by higher shipment volumes and strategic pricing adjustments. In contrast, the Large Agriculture sector remains under pressure. The Production and Precision Agriculture segment saw operating profits fall significantly due to a combination of unfavorable sales mix and rising production costs. Global factors continue to impact the bottom line. The company reported that sweeping tariffs have increased the cost of raw materials, weighing on overall operating margins. Additionally, the U.S. Department of Agriculture recently forecast that net farm income could fall slightly in 2026 to **$153.4 billion**, suggesting continued caution among large-scale buyers. Despite these challenges, market sentiment has turned sharply positive. Following the earnings release, Deere shares soared nearly **10%** in intraday trading, reaching an all-time high of approximately **$662**. The stock has rallied roughly **40%** since the start of the year. The company's leadership remains optimistic that the industry is nearing the end of its current downturn. Strengthened order books and a revival in soybean exports have bolstered confidence that 2026 will serve as a foundation for accelerated growth in the coming years.
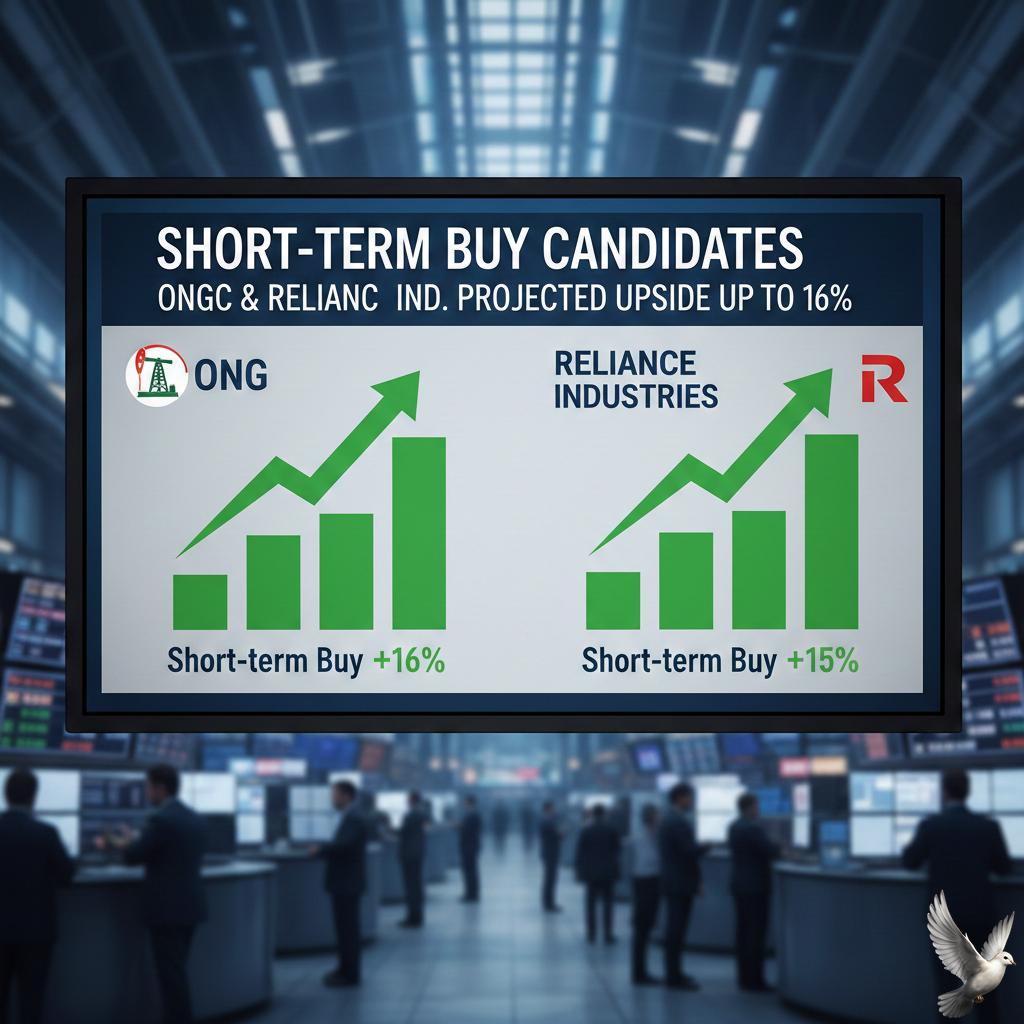
ONGC and One Other Stock Identified as Short-term Buy Candidates with Projected Upside of up to 16%
Market Pulse: Nifty Snaps Streak Amid Global Tensions Indian equity markets witnessed a severe reversal on **February 19, 2026**, as escalating geopolitical friction between the **US and Iran** triggered a wave of risk-off sentiment. The **Nifty 50** plummeted **365 points** or **1.41%**, settling at **25,454.35**. This sharp decline effectively wiped out the gains accumulated over a three-session rally and erased approximately **₹8 lakh crore** in investor wealth. The benchmark **Sensex** mirrored this weakness, tumbling **1,236.11 points** to close at **82,498.14**. Market breadth was significantly skewed toward the bears, with declining stocks outnumbering gainers by a wide margin on the **BSE**. Key Market Triggers Geopolitical instability remains the primary headwind. Reports of a potential military escalation over the weekend, following failed nuclear discussions in **Switzerland**, sent **Brent crude** prices higher, gaining over **1%** to settle near **$71.09 per barrel**. For an import-dependent economy like India, higher oil prices spark renewed inflation fears. Additionally, the latest **US Federal Reserve** minutes suggested a clouded outlook for interest rate cuts, adding pressure to emerging market valuations. The **India VIX**, a key volatility gauge, surged as traders rushed to hedge their portfolios. Sectoral Performance & Outliers Selling pressure was broad-based, hitting almost every major sectoral index. **Nifty Realty**, **Nifty Media**, and **Nifty Auto** were the worst performers, each dropping roughly **2%**. Even the usually resilient **Nifty PSU Bank** and **FMCG** sectors fell by more than **1%**. Despite the carnage, select stocks displayed remarkable resilience: * **ONGC**: Emerged as a standout performer, surging **3.08%** to an intraday high of **₹272.15**. The stock is currently trading above its **20-day**, **50-day**, and **200-day** moving averages, supported by a significant jump in derivative open interest. * **Biocon**: Showed relative strength, closing higher at **₹385.30** (up **1.63%**). Technical charts indicate a potential breakout if the stock sustains levels above **₹389**. Technical Outlook The **Nifty 50** has breached its short-term support zone of **25,600**, which coincided with its **20-day EMA**. Analysts now eye the **25,350–25,400** range as the next critical demand level. Failure to hold these levels could invite further selling toward **25,200**. On the upside, **25,700** now acts as immediate resistance. Traders are maintaining a cautious stance, favoring defensive plays or stocks with high dividend yields, such as **ONGC**, which currently offers a yield of **5.2%**. Short-term strategies remain focused on breakout levels and strict adherence to stop-losses, as the market navigates a high-volatility environment driven by global news flow and crude oil fluctuations.

**US Equity Markets Decline Led by Technology Sector Following Recent Gains**
Indian equity markets faced a sharp downturn on February 19, 2026, as benchmark indices snapped a three-day winning streak. The BSE Sensex plunged **1,236 points** to close at **82,498.14**, while the Nifty 50 dropped **365 points** to settle at **25,413.35**. This heavy sell-off resulted in a loss of approximately **₹7.5 lakh crore** in investor wealth in a single session. The decline was fueled by aggressive profit-booking and heightened volatility, as the India VIX surged. While the IT sector saw a marginal technical rebound of **1%** following news of a major chip deal between Nvidia and Meta, broader market sentiment remained fragile. Leading laggards included Mahindra & Mahindra and IndiGo, which fell over **3%** each, alongside significant drops in the realty and auto sectors. Retail Resilience and Global Dynamics Bucking the broader bearish trend, Walmart delivered a standout performance. The retail giant reported Q4 FY2026 revenue of **$190.7 billion**, a **5.6%** year-over-year increase, driven by a **24%** surge in global e-commerce sales. Strengthening its position, Walmart announced a massive **$30 billion** share buyback program and a **5.3%** dividend hike to **$0.99** per share. The contrast between retail strength and tech jitters is stark. Despite Walmart’s gains, global technology valuations are under pressure as investors question the immediate returns on massive AI infrastructure spending. Major firms like Microsoft and Amazon have seen significant market value erosion since the start of the year, as the "Year of Truth for AI" forces a shift from experimental hype to measurable profit impact. Federal Reserve and Economic Indicators In the United States, the Federal Reserve’s latest meeting minutes revealed a divided committee. While the benchmark rate was held at **3.50%–3.75%**, officials expressed concern over persistent inflation and a "solid" pace of economic growth. Two governors dissented in favor of a rate cut, highlighting the uncertainty surrounding the Fed's trajectory for the remainder of 2026. Labor market data provided a silver lining, as initial jobless claims fell by **23,000** to **206,000** for the week ending February 14. This drop, the largest since November, suggests a stabilizing employment environment. However, for Indian markets, these positives were offset by rising geopolitical risks and Brent crude prices climbing above **$70 per barrel**, stoking domestic inflation fears. Strategic Outlook The market is currently navigating a "low-hire, low-fire" equilibrium in the U.S. and a high-volatility phase in India. Immediate support for the Nifty is watched closely at the **25,300** level. Traders are pivoting toward defensive sectors like oil and gas, as evidenced by ONGC’s **3.65%** gain, while navigating the structural shifts caused by AI disruption in the traditional IT services model.