Bullish News
Collection
US Weekly Jobless Claims Fall More Than Anticipated Amid Labor Market Stability
US Labor Market Brief: February 2026 The US labor market showed unexpected signs of resilience this week as new applications for unemployment benefits fell to their lowest level since November. Initial jobless claims dropped by **23,000** to a seasonally adjusted **206,000** for the week ending February 14. This figure significantly outperformed market expectations, as economists had forecast a much higher volume of **225,000** claims. This sharp decline in filings suggests that layoffs remain historically low across most private sectors. The four-week moving average, which provides a clearer view of long-term trends by filtering out weekly volatility, also edged down to **219,000**. These figures indicate a stabilization in the workforce following a brief spike in claims at the end of January. Employment and Job Growth Recent data confirms that while the labor market is cooling compared to previous years, it remains on a steady footing. Nonfarm payrolls grew by **130,000** in January, far exceeding initial estimates that ranged between **55,000** and **80,000**. The national unemployment rate currently sits at **4.3%**, a slight improvement from December’s **4.4%**. Sector performance remains highly concentrated. The healthcare and social assistance sector accounted for the vast majority of gains, adding **123,500** jobs. Construction also showed strength with **33,000** new positions. Conversely, the federal government saw a decline of **34,000** jobs, continuing a downward trend that has resulted in a loss of over **320,000** public sector roles over the last twelve months. Continuing Claims and Wage Trends While new layoffs are infrequent, the pace of re-employment appears to be slowing. Continuing claims—the number of people already receiving benefits—rose to **1.87 million** for the week ending February 7. This increase suggests that workers who do lose their jobs are taking longer to find new opportunities in a "low-hire, low-fire" environment. Wage growth is also showing signs of moderation. Average hourly earnings rose by **0.4%** in January to reach **$37.17**. On a year-over-year basis, wage inflation has cooled to **3.7%**, down from higher peaks seen in 2025. This deceleration is consistent with broader economic trends as headline consumer inflation recently moderated to **2.4%**. Federal Reserve Outlook The stability of the labor market has shifted expectations for monetary policy. According to recent meeting minutes, the Federal Reserve remains attentive to the balance between maintaining employment and reaching its **2%** inflation target. With job growth proving more resilient than anticipated, market participants have pushed back expectations for interest rate cuts. Many analysts now look toward July 2026 for potential policy easing, rather than earlier summer projections. The central bank continues to monitor whether the concentration of job gains in a few sectors signals a underlying vulnerability or if the broader economy can maintain its current trajectory of modest, steady growth.

Gaudium IVF Secures Rs 49 Crore from Anchor Investors Ahead of IPO
Market Brief: Gaudium IVF Strategic Expansion Gaudium IVF and Women Health Limited has secured **₹49.5 crore** from anchor investors, finalizing allocations at the upper price band of **₹79 per share**. Key participants in this round include Meru Investment Fund, Sanshi Fund I, and Carnelian India Multi Strategy Fund. This placement serves as a precursor to the company's **₹165 crore** Initial Public Offering, which officially opens for public subscription on **February 20, 2026**. The issue is priced between **₹75 and ₹79 per share**, valuing the fertility provider at a post-issue market capitalization of approximately **₹575 crore**. IPO Structure and Utilization The offering consists of a **₹90 crore** fresh equity issue and an Offer for Sale (OFS) of **9.49 million shares** worth **₹75 crore**. Management has earmarked **₹50 crore** from the fresh proceeds for aggressive capital expenditure. This will fund the establishment of **19 new IVF centers** across India through 2029, targeting underserved Tier 2 and Tier 3 markets. Additionally, **₹20 crore** is allocated for the repayment or prepayment of outstanding borrowings. The remaining funds are designated for general corporate purposes to support the company’s hub-and-spoke operational model. Financial Performance The company has demonstrated robust growth leading into the listing. For the fiscal year ending March 2025, Gaudium reported a total income of **₹70.96 crore**, a significant climb from **₹48.15 crore** in the previous year. Profit After Tax reached **₹19.13 crore** for FY25, supported by an EBITDA margin of **38.29%**. Operational efficiency is further evidenced by a Return on Equity (ROE) of **21.25%** and a Return on Capital Employed (ROCE) of **21.03%**. Sector Trends and Outlook Gaudium’s entry marks the first-ever mainboard listing for a specialized fertility services provider in India. This move coincides with a broader structural shift in the healthcare economy, where the domestic IVF market is projected to reach **$4.54 billion** by 2034. Current market dynamics are driven by rising infertility rates—now affecting roughly **13%** of Indian couples—and a growing preference for organized, technology-led clinical platforms. The Nifty Healthcare Index currently reflects a Price-to-Earnings (P/E) ratio of approximately **35.99**, while Gaudium enters the market at a P/E of **25.36** based on its upper price band. Key Dates for Investors * **Subscription Period:** February 20 – February 24, 2026 * **Allotment Finalization:** February 25, 2026 * **Listing Date:** February 27, 2026 (BSE and NSE) * **Minimum Lot Size:** 189 shares (**₹14,931** at the upper band)
Jim Rogers Indicates Market Bottoms Often Reach Multi-Decade Lows
Patience remains the ultimate asset in the modern stock market. True market bottoms are not sudden corrections; they are long, structural cycles that demand a broad time horizon to unlock real value. In early 2026, the Indian market reflects this cyclical nature. The **Nifty 50** is currently hovering near **25,725**, while the **Sensex** trades around **83,450**. These levels follow a period of intense volatility and institutional reshuffling. History proves that major bottoms form after prolonged pessimism, often leaving high-quality assets mispriced. For emerging markets like India, recognizing these cycles is vital for long-term wealth creation. Growth and Liquidity Drivers The Indian economy continues to show structural strength despite global headwinds. The **GDP growth** forecast for **FY 2025–26** stands at a robust **7.4%**, positioning India as a leading growth story among G20 nations. Inflation management has provided significant breathing room. The **CPI inflation** is projected at a stable **2.1%** for the current fiscal year, a sharp drop that has allowed for a more accommodative monetary environment. The Reserve Bank of India has maintained the **Repo Rate** at **5.25%**. This follows a cumulative easing of **125 basis points** through 2025, aimed at supporting productive credit growth and domestic consumption. Shifting Market Psychology The battle between foreign and domestic sentiment is defining current price action. In January 2026 alone, Foreign Institutional Investors (FIIs) pulled out approximately **₹25,000 crore**. However, the "prolonged pessimism" often seen at market bottoms is being countered by massive domestic conviction. Domestic Institutional Investors (DIIs) absorbed this pressure with a record inflow of nearly **₹40,000 crore** in the same period. Monthly **SIP inflows** now exceed **₹15,000 crore**, creating a liquidity cushion that prevents the deep crashes historically associated with foreign sell-offs. Value in the Quality Gap Market cycles are shaped by the interaction of liquidity, interest rates, and investor psychology. Currently, the "fear" of global trade shifts and U.S. tariff uncertainties has kept several sectors at attractive entry points. Public Sector Banks and the IT sector have recently shown signs of a rebound. High-conviction buying is emerging as the market consolidates above the **25,600** support level for the Nifty. The current phase is a reminder that value is found when the crowd is cautious. With corporate earnings showing resilience and the **debt-to-GDP** ratio improving, the long-term outlook for disciplined investors remains exceptionally strong.
Eurozone Bond Yields Trend Higher Amid US Economic Data Anticipation and Geopolitical Risks
Eurozone government bond yields edged higher on Thursday, tracking a similar upward trend in U.S. Treasury yields. Markets are closely monitoring shifting leadership at the European Central Bank and the impact of softening global inflation data on long-term monetary policy. Germany’s 10-year Bund yield, the region's primary benchmark, currently trades at 2.75%. While showing a slight daily increase, it remains near its lowest level in two and a half months. Investors are weighing reports that ECB President Christine Lagarde may consider an early departure before 2027, introducing new political variables into the central bank’s future direction. In France, the 10-year OAT yield recently touched a six-month low of 3.3%. This movement reflects a broader flight to safety as regional investors balance economic growth concerns against the potential for further monetary easing later this year. Current market pricing indicates a significant shift in interest rate expectations. Traders now place the probability of another ECB rate cut before the end of the year at approximately 40%. The deposit facility rate currently stands at 2.00%, having been reduced from 2.25% in June 2025. Inflation across the Eurozone continues to stabilize near the 2% target. Preliminary data for early 2026 shows headline inflation dipping to 1.7%, primarily driven by lower energy costs and a strengthening Euro. This cooling has led many analysts to view the current 2% deposit rate as a potential "neutral level," with little immediate pressure for aggressive cuts. Economic growth remains modest, with GDP projections for the region holding between 1.2% and 1.3% for the 2026 period. While the labor market is resilient with unemployment at a historical low of 6.4%, subdued business investment and global trade uncertainties continue to act as headwinds. Looking ahead, the market is pricing less than a 50% chance of a rate cut occurring in 2026. Most economists anticipate a period of policy stability, though a strengthening Euro could eventually trigger one or two precautionary reductions to around 1.5% if "imported deflation" becomes a significant threat to the recovery.
Tata Steel and four other stocks reach 52-week highs following monthly gains of up to 10%.
Equity benchmark indices faced a sharp correction on February 19, 2026, as the **BSE Sensex plummeted 1,236.11 points** to settle at **82,498.14**. This 1.48% decline mirrored a broader sell-off across the NSE Nifty 50, which shed **405.95 points** to close at **25,413.40**. The downturn was fueled by intense profit-booking in the realty and power sectors, alongside a surge in global Brent crude prices to **$70.58 per barrel**. Markets also contended with a banking holiday and muted foreign institutional activity during the Lunar New Year period. Despite the prevailing gloom, a distinct cluster of BSE 100 stocks defied the trend to reach fresh **52-week highs**. This divergence highlights specific pockets of resilience where company-specific triggers are outweighing macroeconomic headwinds. **Indus Towers** climbed to a peak of **481.05**, benefiting from improved collection visibility and infrastructure scaling. **Tata Steel** also reached a milestone high of **211.10**, supported by recent reports of easing international steel tariffs and a nearly 3% gain in the previous session. In the automotive space, **Eicher Motors** touched **8,119.00** following stellar Q3 results. The company reported a 21% rise in profit to **1,421 crore** and announced a **958 crore expansion** for its Royal Enfield plant to hit a 20-lakh unit annual capacity. **Bajaj Auto** followed suit, hitting a new high of **9,980.00** amid strong demand for premium two-wheelers. **Marico** rounded out the top performers by reaching **798.00**, as investors pivoted toward defensive FMCG plays to hedge against volatility. While the broader Nifty IT index remains under pressure due to global tech concerns, these five stocks signal that sector-specific growth stories continue to attract capital. Market volatility is expected to persist as the India VIX rose 11.78% to **13.66**, reflecting increased nervousness. Traders are now watching the **25,350 level** on the Nifty as a crucial support zone to prevent further sliding.

Indian Stock Market: Top 8 Price Movers on Thursday
Market Alert: Geopolitical Tensions Trigger Sharp Sell-off Indian equity markets faced a severe downturn on **February 19, 2026**, as escalating military tensions between the United States and Iran shattered investor confidence. The benchmark **BSE Sensex** plunged by **1,236.11 points**, or **1.48%**, to close at **82,498.14**. Simultaneously, the **NSE Nifty 50** dropped **365 points**, or **1.41%**, ending the session at **25,454.35**. This correction marks the sharpest single-day decline in over two weeks, effectively wiping out gains from the previous three trading sessions. The sell-off was broad-based, with all **30 Sensex stocks** ending in the red. Global Triggers and Crude Impact The primary driver of the slump is the heightened risk of conflict in the Middle East. Reports of a potential military strike have pushed **Brent crude** prices toward **$71 per barrel**, a significant jump that threatens India’s inflationary outlook. Higher energy costs have put immediate pressure on oil marketing companies, while raising concerns over India’s rising import bill. The volatility has also been felt in the currency market, where the **Indian Rupee** remains under pressure due to the strengthening US Dollar. Sector Performance and Resilience While the broader market struggled, specific pockets showed remarkable resilience. Defensive sectors and high-growth technology firms attracted buying interest despite the surrounding gloom. **Newgen Software Technologies** emerged as a standout performer, surging **20.3%** to reach an intraday high of **618**. The stock has now rebounded roughly **35%** from its recent **52-week low**, supported by strong trading volumes and a recovery in the IT services segment. **Netweb Technologies** also defied the market trend, jumping over **10%** during the session to hit **3,525**. The stock has maintained a strong upward trajectory for three consecutive days, outperforming its peers in the computing and software consulting space. **Tata Investment Corporation** provided another point of strength, gaining over **5%** in intraday trade. The stock touched a peak of **672.8**, benefiting from sustained buying momentum in the non-banking financial sector despite the wider market retreat. Looking Ahead Market participation remains cautious as the **India VIX**, a measure of market volatility, spiked by **10%** today. Institutional activity shows a divide, with **Foreign Portfolio Investors (FPIs)** trimming exposure in IT and heavyweights, while **Domestic Institutional Investors (DIIs)** attempt to provide a floor to the falling prices. Investors are now closely monitoring the **Strait of Hormuz** for any disruptions to global energy supplies. In the absence of immediate positive domestic triggers, the market is expected to remain range-bound with a high sensitivity to news flowing from the Middle East and upcoming **US Federal Reserve** minutes.
10 Large-cap Stocks Trading Above Industry P/E Ratios
Large-cap equities in the Indian market continue to trade at significant premiums, with several top-tier companies positioned well above their historical and industry averages. As of February 2026, the Nifty 50 Price-to-Earnings (P/E) ratio is holding steady near 22.50, reflecting a market that is viewed as slightly overvalued but buoyed by strong domestic growth. In the power and energy sector, companies like Adani Green Energy and Power Grid Corporation are seeing heightened interest. Adani Green Energy, for instance, is trading at a P/E exceeding 115.0, driven by the aggressive transition toward renewable energy. Despite high multiples, investor confidence remains firm due to the massive capital expenditure and infrastructure spending outlined in recent budget cycles. The financial and insurance segments are witnessing a valuation divide. While private banking giants like HDFC Bank and ICICI Bank maintain P/E ratios in the 18.0 to 20.0 range, other financial services are commanding much higher premiums. HDFC Life and SBI Life Insurance are currently trading at P/E multiples above 83.0, signaling that investors are pricing in a long-term surge in insurance penetration across the country. Consumer-focused stocks continue to be the most expensive on a relative basis. Standard-bearers like Hindustan Unilever and Nestle India are trading at P/E levels of 51.0 and 75.0 respectively. This defensive positioning by investors suggests a willingness to pay a premium for stability and brand equity, even as the broader FMCG industry P/E sits near 34.6. High valuations are also evident in niche leaders and "new-age" large caps. Zomato, having achieved consistent profitability, now carries a P/E of approximately 1,159.0, highlighting extreme growth expectations. Similarly, Trent is trading at a P/E of 92.5, reflecting its dominance in the retail and lifestyle segment. The persistence of these high multiples across power, finance, and consumer sectors underscores a market driven by "growth at any price" sentiments. While these levels indicate robust confidence in India's 7.4% GDP growth trajectory, they also leave narrow margins for error should earnings growth fail to meet these elevated expectations in the coming quarters. [Nifty 50 PE Analysis](https://www.youtube.com/watch?v=DrHTGPk-3n8) This video provides an expert breakdown of why certain large-cap valuations are correcting or sustaining high levels in the current 2026 market cycle. http://googleusercontent.com/youtube_content/0

Samco Securities Analyst Forecasts Crude Oil Upswing
Global Commodity Market Brief: February 2026 The commodities sector is witnessing a significant rotation as the multi-year supercycle matures. While precious metals have defined the narrative over the last 24 months, attention is now shifting toward the energy complex. Crude Oil: The Next Growth Phase Crude oil is transitioning into a structural uptrend. Despite a broader global supply surplus, technical indicators suggest a tightening physical market in the immediate term. Prices have shown resilience, with **WTI Crude** recently trading near **$62.38** and **Brent** hovering around **$67.50**. Market analysts have identified bullish chart patterns supported by shifting supply dynamics. Key near-term price targets are now set between **$72** and **$73** per barrel. While long-term forecasts from agencies like the EIA suggest a return to lower averages near **$58** by year-end, current geopolitical risks and OPEC+ production discipline are providing a firm floor for the rally. Precious Metals: Entering Record Territory Gold and silver continue to anchor the commodity supercycle, driven by central bank accumulation and a structural shift away from paper currencies. Gold has maintained its status as a primary reserve asset, with prices recently stabilizing around the **$5,000** per ounce mark after touching intra-month highs near **$5,600**. Silver is exhibiting even higher volatility and remains a top performer due to its dual role as a monetary and industrial metal. Following a massive surge of nearly **120%** in 2025, silver entered 2026 with a target range of **$56 to $65**. Industrial demand—particularly from the solar PV sector and AI infrastructure—continues to outpace global mine supply. Market Drivers and Sentiment The current "Commodity Supercycle 2026" is unfolding in distinct phases. The initial surge in precious metals is now spilling over into the energy and base metals sectors. * **Supply Constraints:** Structural deficits in silver and logistical bottlenecks in energy flows are primary price drivers. * **Monetary Shifts:** Declining trust in fiat currencies and persistent global debt levels favor hard assets. * **Geopolitical Premium:** Ongoing tensions in the Middle East and Eastern Europe keep supply-side risks elevated, preventing significant price corrections. As the market enters this critical phase, the focus remains on the **Gold-Silver Ratio**, which has compressed to approximately **46:1**, and the emerging momentum in the energy sector as it attempts to catch up with the broader rally.

MCX Valuation Analysis: A Comparative Case Study with CME Group
MCX India Market Intelligence Brief February 19, 2026 Shares of the Multi Commodity Exchange of India (MCX) have demonstrated exceptional momentum, delivering returns of **113%** over the past year. This rally has been primarily catalyzed by a historic surge in bullion. In 2025, silver prices soared by **170%** and gold by over **60%**, driving massive trading interest. The momentum extended into early 2026, with silver rising another **70%** before hitting a record high of **₹4.20 lakh** per kg on January 29. However, the market recently underwent a sharp correction, with silver tumbling **42%** and gold slipping **20%** from their respective peaks. Strategic Margin Revisions To manage the resulting volatility, the exchange had previously implemented strict additional margin requirements. As of today, February 19, 2026, MCX has officially withdrawn these extra charges: * **3% additional margin** on gold futures removed. * **7% additional margin** on silver futures removed. This easing is expected to significantly lower the capital outlay for traders, likely boosting liquidity and participation in bullion contracts. The market has reacted positively to this operational shift, with MCX shares jumping over **3.2%** in today's session to trade near **₹2,419**. Trading Volume Dynamics The exchange is witnessing a notable structural shift in how participants interact with precious metals. While high margins recently caused a sharp contraction in futures activity—with gold futures daily turnover falling **41%** month-on-month—options trading has remained resilient. Options premium turnover now represents a growing share of MCX revenue. This follows a pattern seen during previous periods of extreme volatility, where traders favor options to manage risk without the heavy capital requirements of futures. Bullion remains the backbone of the exchange, accounting for roughly **69%** of the average daily turnover. Financial Performance & Valuation The financial health of the exchange remains robust. For the quarter ending December 31, 2025 (Q3FY26), MCX reported: * **₹666 crore** in revenue from operations, up **121%** year-on-year. * **₹401 crore** in consolidated net profit, marking a **151%** surge. * **62.7%** operating profit margin for the fiscal year. Despite these strong fundamentals, the stock's rapid appreciation has raised valuation concerns. MCX currently trades at a price-to-earnings (P/E) ratio of approximately **62x** to **65x**. This represents a significant premium compared to the broader Indian capital markets industry average of **23.4x**. Analysts remain divided on whether the current price levels are sustainable or if the market has already priced in the anticipated growth from the new margin regime and high bullion prices. Immediate technical resistance is identified at **₹2,450**, with a 52-week high of **₹2,705** serving as a key benchmark for future momentum.

Market Volatility Prompts Selective Trading Approach With Focus on PSU Stocks
Indian equity markets are currently demonstrating a robust recovery, successfully absorbing recent volatility to settle above psychological benchmarks. The Nifty 50 has extended its winning streak for three consecutive sessions, closing at 25,819 as of the latest trading data. The index has shown significant resilience by respecting a critical support zone between 25,645 and 25,660. Analysts indicate that as long as the 25,650 level holds, the short-term bias remains positive with a "buy-on-dips" strategy. However, a decisive move above the 26,000 resistance level is required to trigger a fresh upside expansion. State-owned lenders are leading the current market momentum. The Nifty PSU Bank index recently surged by 1.31%, buoyed by improved asset quality metrics and strong institutional interest. Punjab National Bank (PNB) remains a top pick in this space, with its share price recently climbing to 128.17, reflecting a gain of over 2.6%. Market analysts have issued "Buy" ratings for PNB, with some raising price targets toward the 140 to 150 range. Broader economic indicators present a stable yet cautious backdrop. India's consumer inflation is estimated to remain at a benign 2.5% for the current fiscal year, though it is projected to rise to 4.3% in the following year. Meanwhile, wholesale inflation has touched a 10-month high of 1.8%, signaling potential price pressures in the commodity cycle. The India VIX, often referred to as the "fear gauge," has cooled significantly to 12.22. This 3.5% drop suggests that immediate market anxiety is evaporating, paving the way for more stable upward movement. Foreign institutional investors (FIIs) have shown mixed activity, but strong domestic institutional buying, totaling over 1,667 crore in recent sessions, continues to provide a solid floor for equities. Investors are advised to remain selective, focusing on public sector enterprises and high-beta sectors like Metals and FMCG, which have recently outperformed the lagging IT sector. Global cues, including potential U.S. tariff adjustments and shifting commodity demand, remain key factors to monitor for continued market direction.
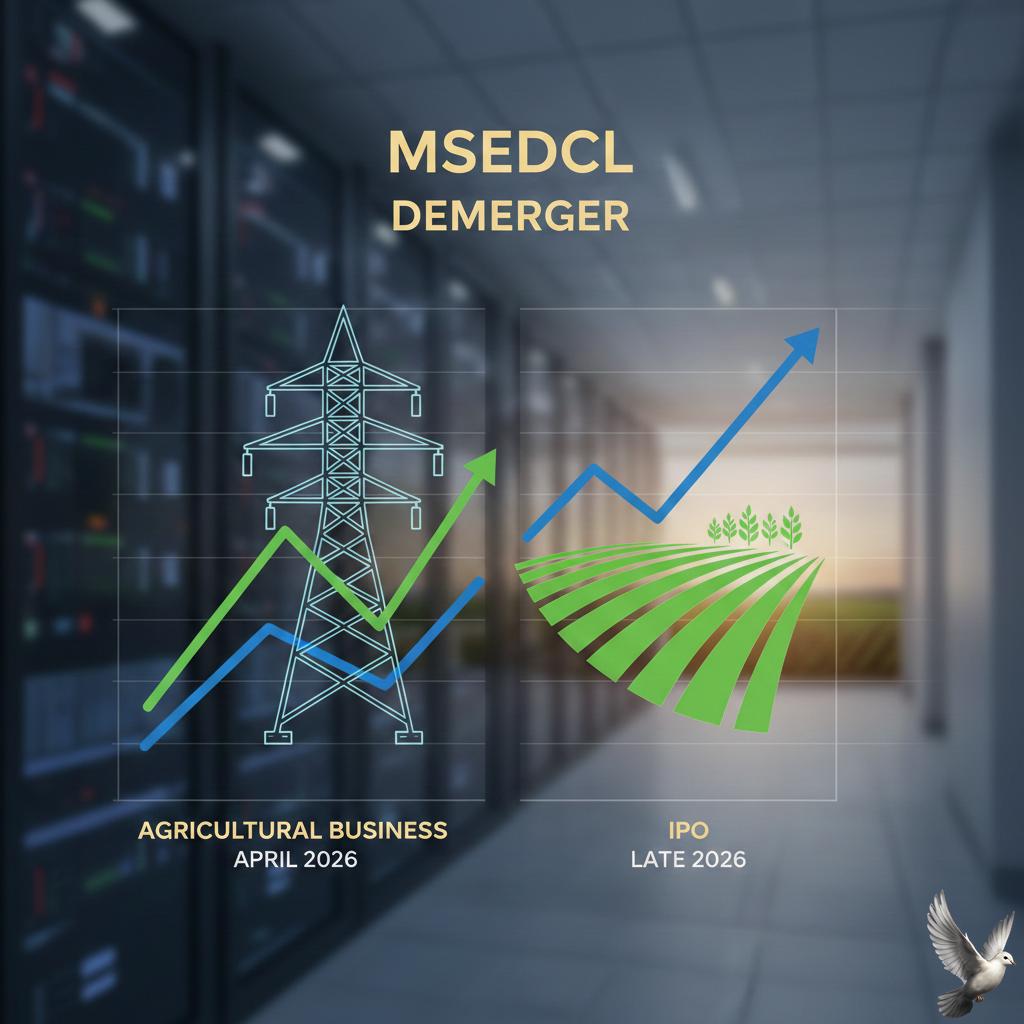
MSEDCL to Demerge Agricultural Business by April Ahead of Late 2026 IPO
Maharashtra State Electricity Distribution Company (MSEDCL) is accelerating its transition into a leaner, market-ready entity through a major structural overhaul. By April 2026, the utility will officially separate its agricultural business into a dedicated subsidiary. This strategic demerger is the primary catalyst for a planned Initial Public Offering (IPO) targeted for December 2026. The restructuring is designed to isolate and resolve the utility's historical financial burdens. The new agricultural entity will absorb approximately 75,000 crore INR in outstanding farmer dues, which currently weigh heavily on the balance sheet. This move allows the parent company to address its total debt of 98,000 crore INR more effectively and present a significantly cleaner financial profile to public market investors. MSEDCL is also executing a massive shift toward renewable energy to slash operational costs. The utility aims to increase its renewable energy share from the current 15% to 52% by 2026. This transition includes a 1.5 trillion INR capital expenditure plan to modernize the transmission network and the installation of 16,000 MW of solar capacity specifically for agricultural use. These solar initiatives, including the deployment of over 10 lakh solar pumps, are expected to save the company nearly 66,000 crore INR in power procurement costs over the next five years. By providing daytime solar power to farmers, MSEDCL will reduce the heavy cross-subsidy burden currently borne by industrial and residential consumers. The financial outlook remains focused on efficiency, with the company targeting a tariff collection rate exceeding 99% for its commercial and residential operations post-listing. This fundamental shift from high-cost thermal power to low-cost solar energy—dropping from 8 INR per unit to roughly 3 INR—is intended to strengthen MSEDCL's valuation and long-term viability as it prepares for its stock market debut.

Pernod Ricard Rules Out Near-Term IPO for Indian Subsidiary
Pernod Ricard is reportedly evaluating a separate public listing for its Indian business, a strategic move that could unlock significant value in one of the company's most vital global markets. Preliminary discussions with advisors are underway, though the French spirits giant maintains that an IPO is just one of several options reviewed annually. This consideration comes at a time when the parent company faces a 7.6% decline in organic net sales across major markets like China and the U.S. The Indian subsidiary currently holds the top spot as the country's largest alcoholic beverage maker by value. In the 2025 fiscal year, it reported record consolidated sales of 27,445.80 crore INR. This performance narrowly outpaced its primary rival, Diageo India, which recorded 27,276 crore INR in revenue. Pernod Ricard India’s net profit grew by 8% to reach 1,734.59 crore INR in 2025. The company’s success is largely driven by a aggressive premiumization strategy. Brands like Jameson Irish Whiskey have seen double-digit growth, making India the brand's second-largest market worldwide by volume. The broader Indian alcohol market is currently valued at approximately 208 billion USD and is projected to reach 312 billion USD by 2036. This growth is supported by a rising middle class and a structural shift toward premium spirits, which now account for 75% of the market share. Despite strong financial performance, the company continues to navigate a complex regulatory landscape. The New Delhi market, which previously accounted for 5% of its domestic sales, remains a challenge due to ongoing license disputes. Legal proceedings related to alleged violations of liquor regulations in the capital are still active. Additionally, the company is managing two antitrust cases and a tax demand of nearly 250 million USD regarding the valuation of imports. In the public markets, Pernod Ricard SA’s shares have shown a recovery trend. The stock is up approximately 12% in Paris since the start of 2026, giving the group a market valuation of roughly 24.4 billion USD. This follows a volatile 2025 where the stock lost nearly a third of its value. A local listing in India would allow the company to capitalize on the high valuation multiples typically awarded to Indian consumer firms. It would also provide the autonomy needed to pursue further innovations in a market expected to grow at a compound annual rate of 7.9% through 2026.
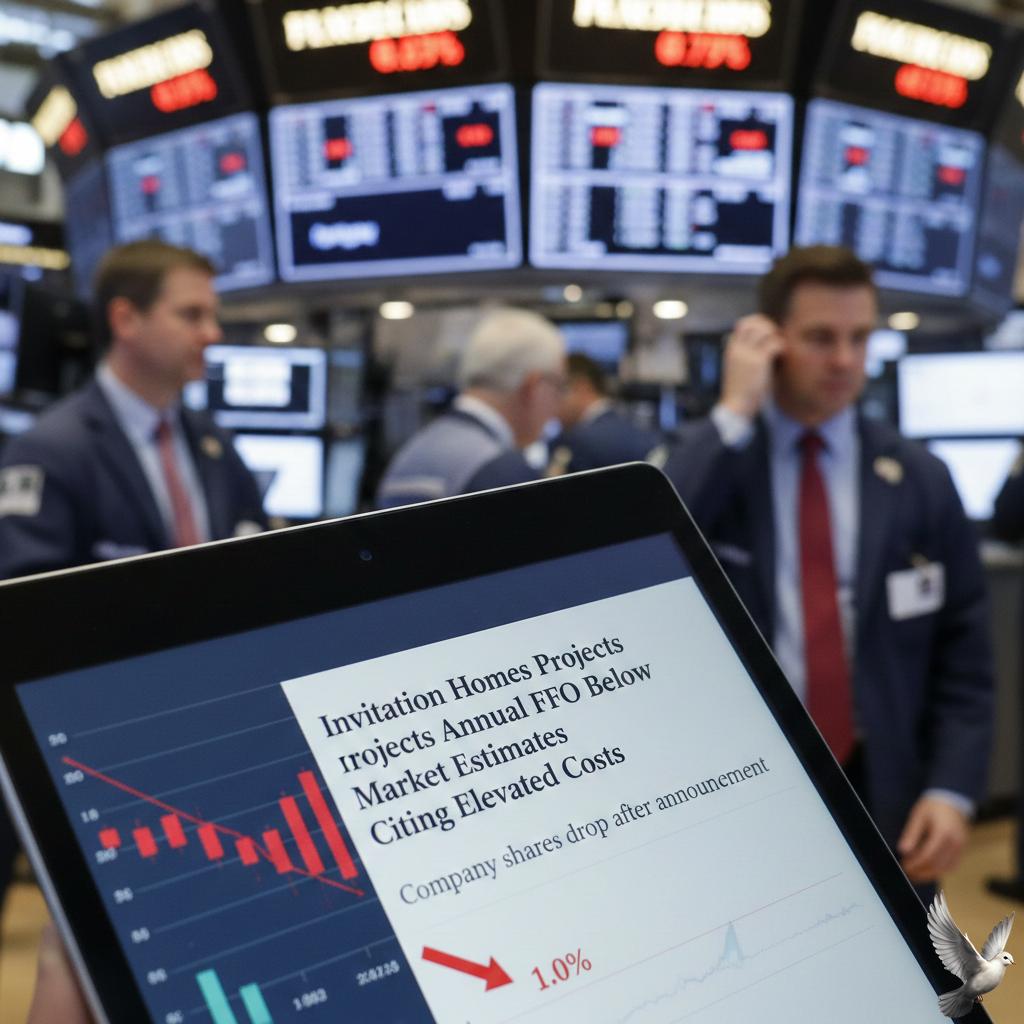
Invitation Homes Projects Annual FFO Below Market Estimates Citing Elevated Costs
Invitation Homes, the largest single-family landlord in the United States, released its fourth-quarter and full-year 2025 financial results on February 18, 2026. The company issued a cautious outlook for 2026, projecting Core Funds From Operations (FFO) per share between $1.60 and $1.68. This forecast fell significantly short of the $1.97 average analyst estimate, as the REIT grapples with rising operational costs and a shifting regulatory landscape. The company’s 2025 performance reflected a market in transition. Total revenue for the fourth quarter rose 4% year-over-year to $685.3 million, supported by steady demand in high-growth markets. However, net income for the quarter stood at $144.3 million, or $0.24 per share, while Core FFO reached $0.48 per share. For the full year 2025, Core FFO per share increased by 1.7% to $1.91, showing marginal growth despite broader economic headwinds. Rental metrics indicate a cooling in the single-family rental sector. Blended rental growth, which combines new leases and renewals, slowed to 1.8% in the final quarter of 2025. While renewal rates remained resilient with 4.2% growth, new lease rates dropped by 4.1%, signaling increased competition and a more balanced market for renters. Same-store average occupancy also experienced a slight decline, ending the year at 95.9% compared to 96.8% in the previous year. Operational expenses continue to pressure the bottom line. Same-store core operating expenses increased by 4% in the fourth quarter, driven by higher maintenance costs and general inflationary trends. To navigate these challenges, Invitation Homes has focused on strategic acquisitions and capital management. In early 2026, the company acquired ResiBuilt for $89 million to enhance its development capabilities and is executing a $500 million share repurchase program, with $100 million already completed. The broader market environment remains complex for residential REITs. National rental trends show asking rents holding steady at an average of $1,895 as of January 2026. While single-family rents are expected to grow by roughly 1.8% throughout the year, the sector faces potential regulatory uncertainty. S&P Global recently revised its outlook for Invitation Homes to "Stable" from "Positive," citing possible national restrictions on institutional housing acquisitions as a potential barrier to external growth. Despite these hurdles, the REIT maintains a solid balance sheet with a debt-to-equity ratio of 0.42 and a net debt-to-EBITDA ratio of 5.3x. No significant debt maturities are scheduled until 2027, providing the company with a stable runway to adjust its strategy. Investors recently received a quarterly dividend of $0.30 per share, representing a 4.5% annualized yield, as the company continues to prioritize capital returns amidst a stabilizing but high-cost housing market.

JGB Yield Curve Flattens Following Strong 20-Year Auction Demand
Japan's sovereign debt market has entered a phase of calculated stability as foreign demand bolsters long-term yields. On Thursday, the 20-year Japanese Government Bond (JGB) auction drew significant interest, effectively stabilizing a market that had recently faced intense volatility. This renewed appetite from overseas investors has helped the yield curve maintain its flattening trend, providing a reprieve after a period of historic pressure. The market recently weathered a significant shock following Prime Minister Sanae Takaichi’s pledge to suspend the 8% consumption tax on food. This fiscal policy shift, aimed at easing cost-of-living pressures, initially sent yields to multi-decade highs. The 10-year JGB yield recently touched 2.13%, while 4-year and 30-year maturities witnessed record-level surges, with some breaking the 4.0% threshold. Investors initially feared a "Truss-style" shock to fiscal discipline, but the successful 20-year auction has begun to restore confidence in the government's funding strategy. Monetary policy remains a critical driver as the Bank of Japan (BoJ) navigates a transition away from decades of accommodation. The central bank raised its short-term policy rate to 0.75% in December 2025, and officials have signaled that gradual hikes toward a neutral rate will continue. Inflation data shows the consumer price index (CPI) hovering around 2.1%, while real GDP growth is projected to remain modest at 0.7% for the current fiscal year. Despite the hawkish lean from the BoJ, the yen remains under pressure, trading near 153 per USD. Fiscal expansion continues to be a central theme under "Sanaenomics." The government plans a stimulus injection of 21.3 trillion yen, approximately 3.7% of GDP, focused on defense, semiconductors, and AI technology. While the Ministry of Finance expects debt-servicing costs to rise to 31.3 trillion yen in fiscal 2026, the current flattening of the yield curve suggests that the market is beginning to price in a more controlled fiscal outlook. Global sentiment is also playing a role. Minutes from the latest Federal Reserve meeting indicate that international policymakers are closely monitoring JGB volatility and its potential spillover into global bond markets. For now, the successful absorption of new long-term debt by foreign participants has mitigated immediate risks of a broader sell-off, allowing for a more orderly repricing of Japanese yields in line with domestic economic shifts. [Japanese Government Bonds explained](https://www.youtube.com/watch?v=Mh5Tmp-v9W4) This video provides expert analysis on why concerns over Japan's fiscal plans may be exaggerated and how the economy is performing relative to its debt levels. http://googleusercontent.com/youtube_content/0

Samir Arora: Market Navigation Requires Patience and Discipline Amid Structural Shifts
Market Brief: India Equity Outlook 2026 The Indian equity market continues to demonstrate resilience as it enters the second half of February 2026. Benchmark indices have maintained a stable trajectory, supported by robust domestic liquidity and a recovery in heavy-weighted sectors. Current Market Performance The **Nifty 50** recently settled at **25,819.35**, while the **BSE Sensex** climbed to **83,734.25**. Market volatility, as measured by the India VIX, has cooled to approximately **12.22**, indicating a shift toward calmer investor sentiment despite global uncertainties. Earnings growth for the broader market is projected to remain healthy at approximately **15%**. This is bolstered by steady GST collections and a constructive macroeconomic backdrop, providing a solid floor for domestic equities. Sectoral Trends and Strategic Positioning Financials and consumption remain the preferred pillars for steady growth. The financial sector, particularly state-owned and private banks, has shown strong momentum with gains of **1.3%** in recent sessions. This is driven by healthy asset quality and credit growth expectations holding near **15%**. The consumption theme is evolving, with a clear tilt toward digital platform companies and quick commerce. These "new-age" players are outpacing traditional staples by capturing channel shifts rather than relying solely on organic demand growth. The IT Sector: A Cautious Stance The Information Technology index continues to face headwinds, recently declining by **1.2%**. Market veterans, including Samir Arora, advise a disciplined and patient approach to this space. Current guidance for major IT firms remains muted at **3% to 5%** growth. Conviction in the sector is expected to return only when visibility improves and companies can demonstrate clear monetization of artificial intelligence against legacy business losses. Key Economic Indicators * **Indian Rupee:** Trading near **90.66** against the US Dollar. * **Repo Rate:** Stabilized at **5.25%** following cumulative cuts in the previous year. * **FII Sentiment:** Foreign flows have stabilized, shifting away from aggressive selling toward selective accumulation. Investors are encouraged to focus on sectors with clear year-to-year visibility, such as hospitals, hotels, and auto ancillaries, while avoiding themes with high technological disruption risks. Maintaining a "buy-on-dips" strategy remains the prevailing approach as the Nifty 50 eyes the **26,000** resistance level.

Omnitech Engineering to Launch ₹583 Crore Mainboard IPO Next Week
Omnitech Engineering is entering the public markets with a Rs 583 crore IPO. The offering consists of a fresh issue of Rs 418 crore and an offer for sale (OFS) of Rs 165 crore by the promoter. Anchor investor bidding is scheduled for February 24, 2026. The main subscription window opens on February 25 and closes on February 27. The Gujarat-based manufacturer will list its shares on both the NSE and BSE. Financially, the company has shown explosive growth. For the fiscal year ending March 31, 2025, revenue from operations reached Rs 343 crore, a 92% increase from the previous year. Profit after tax more than doubled to Rs 43.8 crore, up from Rs 18.9 crore in FY24. Profitability remains a core strength. The company reported a robust EBITDA margin of 34.31% and a Return on Equity (ROE) of 21.55% for the latest fiscal year. This financial health is supported by a massive order book, which stood at Rs 1,764 crore as of September 2025. The business is heavily export-oriented, with nearly 75% of revenue generated from international markets across 22 countries. It serves high-demand sectors including Energy, Motion Control, and Automation. The broader market context is highly favorable for this listing. India’s engineering exports are projected to cross $120 billion in FY26, growing by over 10% in early 2026. The domestic precision machining market is expected to reach a valuation of $16.6 billion by 2033. Proceeds from the fresh issue will likely fund expansion, as the sector pivots toward advanced manufacturing and electric vehicle (EV) components. The company currently employs over 1,800 people and maintains high-precision manufacturing accuracy up to 5 microns. With the IPO dates now locked, investors are tracking the Grey Market Premium (GMP) as a gauge for listing day sentiment. Institutional interest is expected to be high, with 50% of the offer reserved for Qualified Institutional Buyers.

South Korea Stocks Reach Record High Led by Technology Sector Gains
South Korean financial markets reached a historic milestone on February 19, 2026, as the benchmark KOSPI index breached the **5,600** level for the first time. The index closed at a new all-time high of **5,677.25**, surging **3.09%** or **170.24 points** in a single session. This record-breaking rally was ignited by a tech-led rebound on Wall Street and a massive upgrade in corporate earnings forecasts. Domestic sentiment remains highly bullish following the Lunar New Year holiday, with analysts projecting the index could eventually test much higher ceilings as semiconductor profits reach record levels. Tech and Auto Giants Lead the Surge Semiconductor heavyweights were the primary engines of growth. Samsung Electronics jumped **4.97%** to reach **190,200 won**, while SK Hynix climbed **2.73%** to hit **904,000 won**. These gains were fueled by global demand for high-bandwidth memory (HBM) chips and a spillover effect from overnight rallies in major U.S. tech stocks. The automotive and industrial sectors also posted significant gains. Hyundai Motor rose nearly **4%**, and its affiliate Kia advanced **2.50%**. Notable strength was seen in shipbuilders, with HD Hyundai Heavy Industries and Hanwha Ocean both spiking more than **7%** during the session. Currency and Bond Market Shifts Despite the stock market optimism, the South Korean won showed signs of weakness. The local currency opened at **1,451.0 won** against the U.S. dollar, a decline of **6.1 won** from the previous closing rate. By mid-morning, it was trading as low as **1,452.5 won**. Benchmark bond yields moved higher as investors adjusted to a "higher-for-longer" interest rate environment. The 10-year government bond yield climbed to approximately **3.57%**, reflecting faded expectations for immediate rate cuts by the Bank of Korea. Market Participation and Outlook Market dynamics revealed a split in investor behavior. Individual domestic investors were aggressive net buyers, injecting over **1.3 trillion won** into the market. Conversely, foreign investors were net sellers of approximately **1.5 trillion won**, likely engaging in profit-taking at these record valuation levels. The semiconductor sector now accounts for an unprecedented **55%** of total KOSPI net profit forecasts for 2026. This structural shift in earnings, combined with ample global liquidity, suggests that the South Korean market is undergoing a fundamental valuation re-rating despite the pressures of a weaker currency and rising yields.

Over 10 Mutual Funds Acquire 11 High-Growth Stocks in January 2026 Following Significant Annual Gains
Market Brief: Mutual Fund Equity Momentum **Institutional Liquidity & Inflows** Mutual funds extended their aggressive buying streak into early **2026**, with total net investments in Indian equities reaching **₹42,354 crore** for January. While the month saw a tactical **14%** dip in net equity inflows to **₹24,028 crore** compared to December, the overall industry assets under management (AUM) climbed to approximately **₹81 lakh crore**. Passive investment vehicles witnessed a significant surge, with Gold ETFs recording a **106%** month-on-month jump, attracting **₹24,039 crore**. **High-Conviction Stock Additions** Institutional conviction remained concentrated in the banking and financial services sectors. An analysis of portfolio shifts shows that **31 stocks** were added across at least **10** different mutual fund schemes during the last month. Performance metrics for these selections remain robust. Out of the newly added stocks, **11** have delivered returns between **50% and 100%** over the past year. Notably, one selection has achieved multibagger status, reflecting the success of institutional "bottom-up" picking strategies. **Sectoral Rotation & Top Picks** Fund managers significantly increased their exposure to Public Sector Undertaking (PSU) banks, pushing the sectoral weight to a **3-year high**. This rotation was fueled by record-breaking quarterly profits, such as State Bank of India's **₹21,028 crore** net profit for the recent quarter. Key stocks gaining institutional favor include: * **AU Small Finance Bank:** Held by **239** schemes; **104%** annual return. * **Ujjivan Small Finance Bank:** Held by **87** schemes; **99%** annual return. * **Shriram Finance:** Held by **396** schemes; **95%** annual return. * **Union Bank of India:** Held by **149** schemes; **76%** annual return. **Current Market Context** As of **February 19, 2026**, the broader market is navigating a phase of consolidation after a recent three-day winning streak. The Nifty 50 is trading near the **25,609** level, while the BSE Sensex holds around **82,946**. Despite short-term profit-taking in the IT sector, the financial and metal sectors continue to provide a floor for the indices. Mutual fund cash levels have remained stable at **4.8%** of AUM, indicating that fund managers are ready to deploy capital into market dips rather than retreating to safety. **Outlook for Investors** Flexi-cap funds emerged as the most popular category, attracting **₹7,672 crore** in a single month. This trend suggests a strategic shift toward flexible mandates that allow managers to rotate between large-cap stability and mid-cap growth as valuations evolve across different market segments.
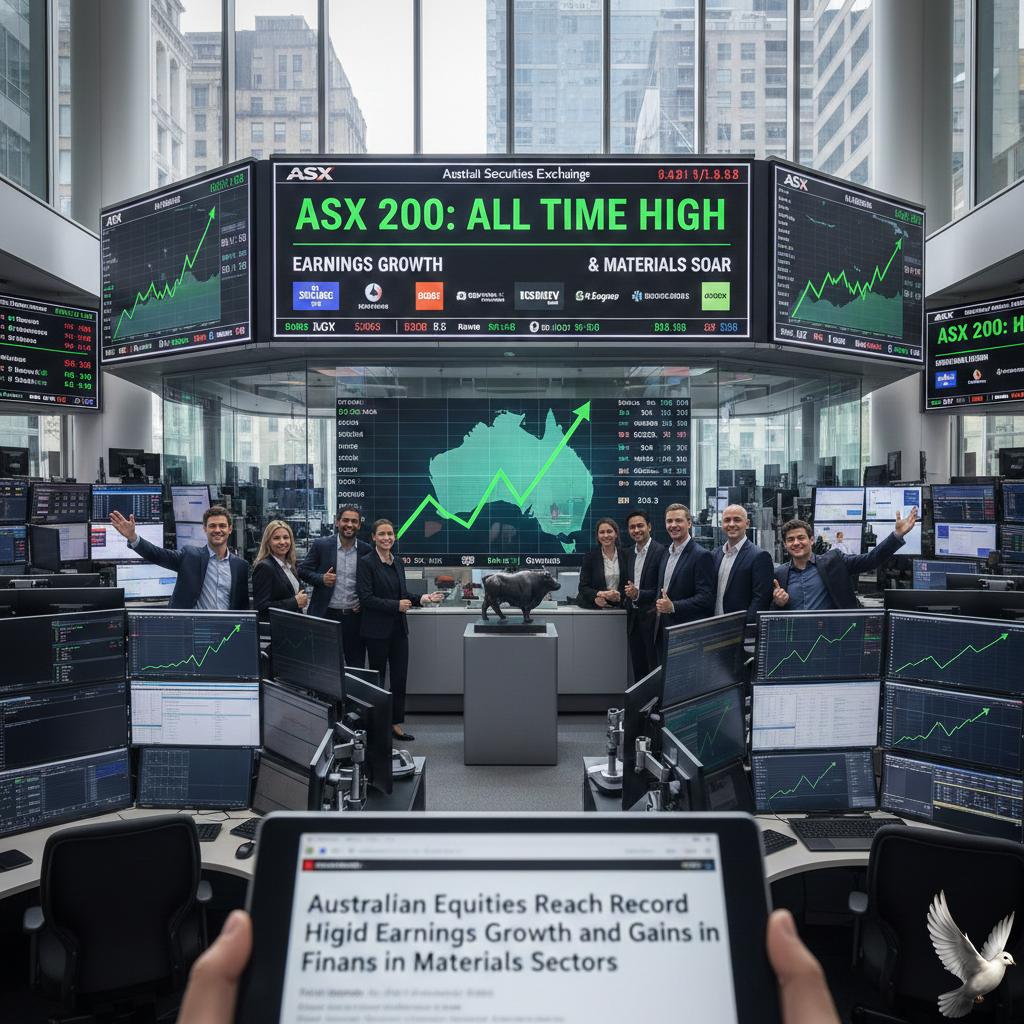
Australian Equities Reach Record High Amid Earnings Growth and Gains in Financial and Materials Sectors
Australian markets reached a historic milestone on Thursday, February 19, 2026, as the benchmark S&P/ASX 200 index surged to a new all-time intraday high of 9,118.3 points. The index ultimately closed at 9,086.2, marking a gain of 0.88%. This performance represents the fourth consecutive day of gains for the local bourse. The rally was largely underpinned by a robust corporate earnings season. Major players in the banking and mining sectors provided significant momentum. National Australia Bank (NAB) recently reported a 16% rise in first-quarter cash earnings to $2.02 billion, supported by a 6% increase in customer deposits and improved lending volumes. Mining giant BHP also contributed to the positive sentiment after delivering a strong half-year profit that exceeded market expectations. The materials sector overall saw a 1.3% boost, further supported by rising copper prices. Copper futures have trended upward, recently trading near $11,822 per tonne on global markets, as supply constraints and industrial demand provide a price floor. Economic data released on Thursday provided additional context for investors. The Australian Bureau of Statistics confirmed the national unemployment rate remained steady at 4.1% for January. While net employment grew by 17,800, the data showed a notable shift as full-time positions jumped by 50,500, offset by a decline in part-time roles. Energy and communication services were the standout performers of the day. Energy stocks soared 3.8% amid geopolitical tensions, while Telstra’s better-than-expected dividend results helped propel the communications sector up by 2.25%. Conversely, the consumer discretionary sector struggled, dropping 2.99% as high-profile retailers faced post-earnings sell-offs. Market participants are now pricing in a 77% chance of a 25-basis-point interest rate hike by the Reserve Bank of Australia in May. This expectation stems from the continued tightness in the labor market and persistent inflationary pressures reflected in the latest wage growth figures.
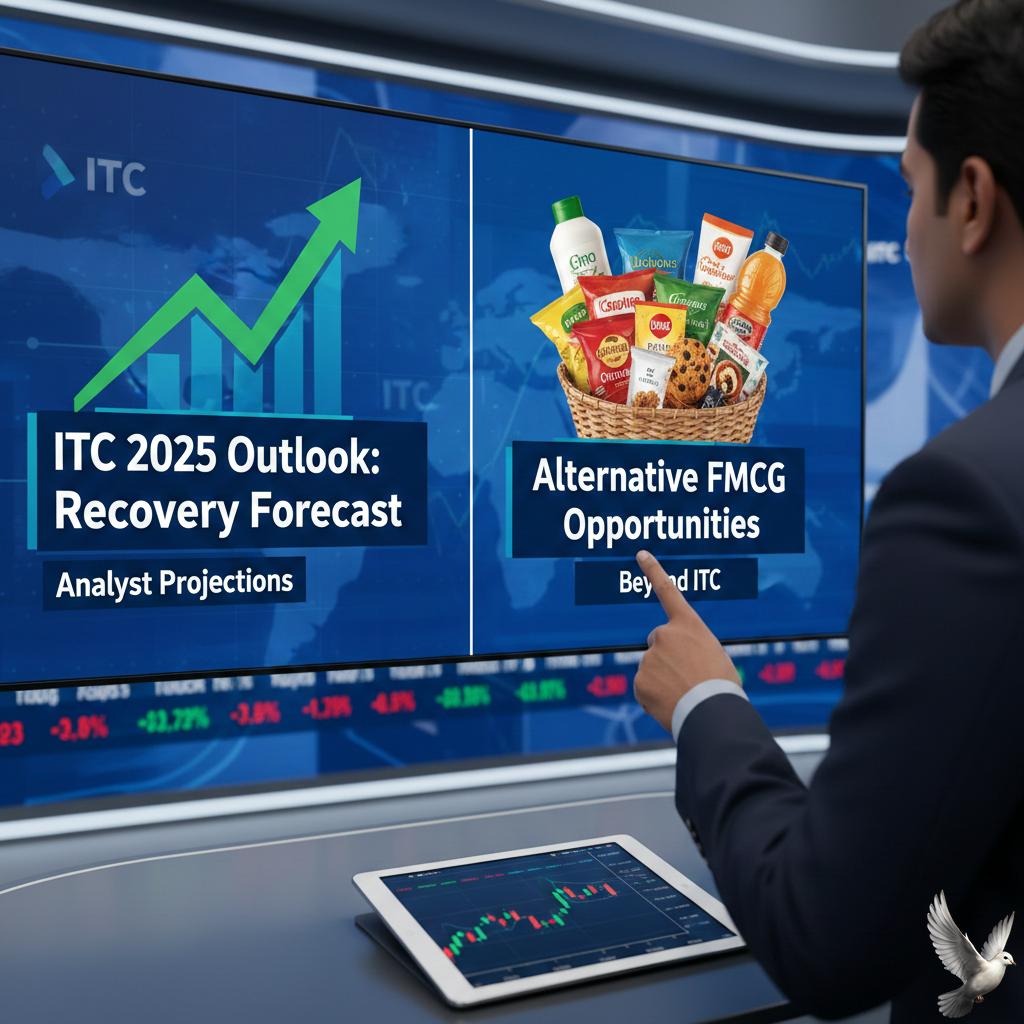
ITC 2025 Outlook: Analyst Forecasts Recovery While Highlighting Alternative FMCG Opportunities
The Indian Fast-Moving Consumer Goods (FMCG) sector is undergoing a definitive structural revival as of February 2026. This turnaround is underpinned by a rare alignment of cooling inflation, strategic tax rationalization, and a robust recovery in both rural and urban demand. Recent data from NielsenIQ confirms that the market expanded by **13.9%** in value and **6%** in volume during the latest quarter. For the sixth consecutive period, rural volume growth has outpaced urban centers, coming in at **7.7%**. This shift signifies a stabilization of the grassroots economy, which had previously struggled with inflationary pressure. Near-Term Market Leaders Analyst Abneesh Roy identifies a cluster of "food-heavy" giants as the primary beneficiaries of this current momentum. Companies like **Nestle India**, **Britannia**, **Marico**, and **Tata Consumer Products** are leveraging high operating leverage and improving consumer sentiment. As of February 18, 2026, **Nestle India** shares closed at **₹1,300.90**, reflecting a **17.07%** gain over the past year. Similarly, **Tata Consumer Products** reached an intraday high of **₹1,173.20** this week, outperforming the broader sector with a **13.9%** annual return. These firms are effectively navigating the transition from price-led growth to volume-led expansion. Structural Shifts and Premiumization **Hindustan Unilever (HUL)** is pivoting toward high-margin "future categories." On February 18, 2026, the company announced a major capital expenditure of **₹2,000 crore** over the next two years. This investment is specifically targeted at expanding manufacturing for premium beauty, wellbeing, and home care liquids. This move into premiumization is viewed as a significant catalyst for a long-term structural re-rating of the stock. The ITC Recovery Play **ITC** remains a unique case in the FMCG landscape. Following a significant "tax shock" that saw its stock dip to a 52-week low of **₹302** on February 2, 2026, the company is now in a recovery phase. The share price has since rebounded **8%** to trade around **₹327.80**. While the new tax burden on cigarettes is steep, the consensus among analysts is that the worst is priced in. ITC is mitigating the impact through phased price hikes and strong performance in its non-cigarette FMCG segment, which recently posted a **12.6%** revenue increase. Experts view ITC as a stable play with a one-to-two-year recovery horizon. Key Sector Indicators * **FMCG Value Growth:** **13.9%** year-on-year. * **Rural Volume Growth:** **7.7%**, leading the national average. * **HUL Capex:** **₹2,000 crore** dedicated to premium manufacturing. * **GST Impact:** Recent rate cuts have driven volume gains in biscuits, snacks, and noodles. * **Quick Commerce:** Now accounts for **70-75%** of e-grocery orders in major cities. The broader industry is moving toward a return to high single-digit volume growth throughout 2026. While a weak rupee and rising costs for commodities like coconut oil and crude derivatives create margin pressure, the overall trend suggests a healthy, consumption-driven cycle for the Indian market.