Bullish News
Collection
Indian Indices End Higher as L&T and RIL Lead Gains
Domestic equity benchmarks staged a recovery on Friday, February 20, 2026, bouncing back from a sharp sell-off in the previous session. Investor sentiment was bolstered by a rebound in heavyweights and a steady outlook for India’s economic growth. The Nifty 50 finished the day at 25,571.25, marking a gain of 116.90 points or 0.46%. The index recovered from earlier lows as broad-based buying offset initial volatility. The BSE Sensex closed 316.57 points higher, or 0.38%, to settle at 82,814.71. Market capitalization of BSE-listed firms grew by approximately 1.74 lakh crore during the session. While the headline indices ended in the green, market breadth remained somewhat cautious, with nearly 2,610 shares declining against 1,449 advancing on the BSE. The Realty sector led the gains, with the Nifty Realty index rising 0.60%. Top performers in the sector included Sobha, up 1.34%, and DLF, which rose 1.23%. Power and infrastructure stocks also showed strength, as NTPC climbed 3% following new solar project commissions, and Larsen & Toubro added 2%. In the industrial space, engineering firms like ABB India and Siemens saw significant traction, surging 8.22% and 5.88% respectively. However, the IT sector remained a laggard throughout the day, facing pressure from global geopolitical tensions and high-interest rate concerns in the US. The Indian rupee edged lower to 90.98 against the US dollar, while the 10-year benchmark federal paper yield rose to 6.715%. In commodities, Brent crude for April settlement climbed slightly to 71.47 per barrel, and MCX Gold futures reached 156,272. Recent economic data continues to support the long-term domestic narrative. ICRA has projected a GDP growth of 7.2% for the third quarter of 2025-26. Manufacturing GVA is showing strong momentum, accelerating toward a 9.13% growth rate, fueled by festive demand and government incentive schemes. Global cues remain mixed as markets weigh escalating US-Iran tensions and US trade deficit data. While Wall Street saw a slight decline in the previous session, Asian markets like the GIFT Nifty provided a positive lead-in for Indian equities today. The IPO market remains active with the opening of Gaudium IVF for subscription. Additionally, dairy firm Milky Mist has confirmed its plans for a 20.35 billion IPO later this year, signaling continued confidence in India’s primary market liquidity despite secondary market volatility.
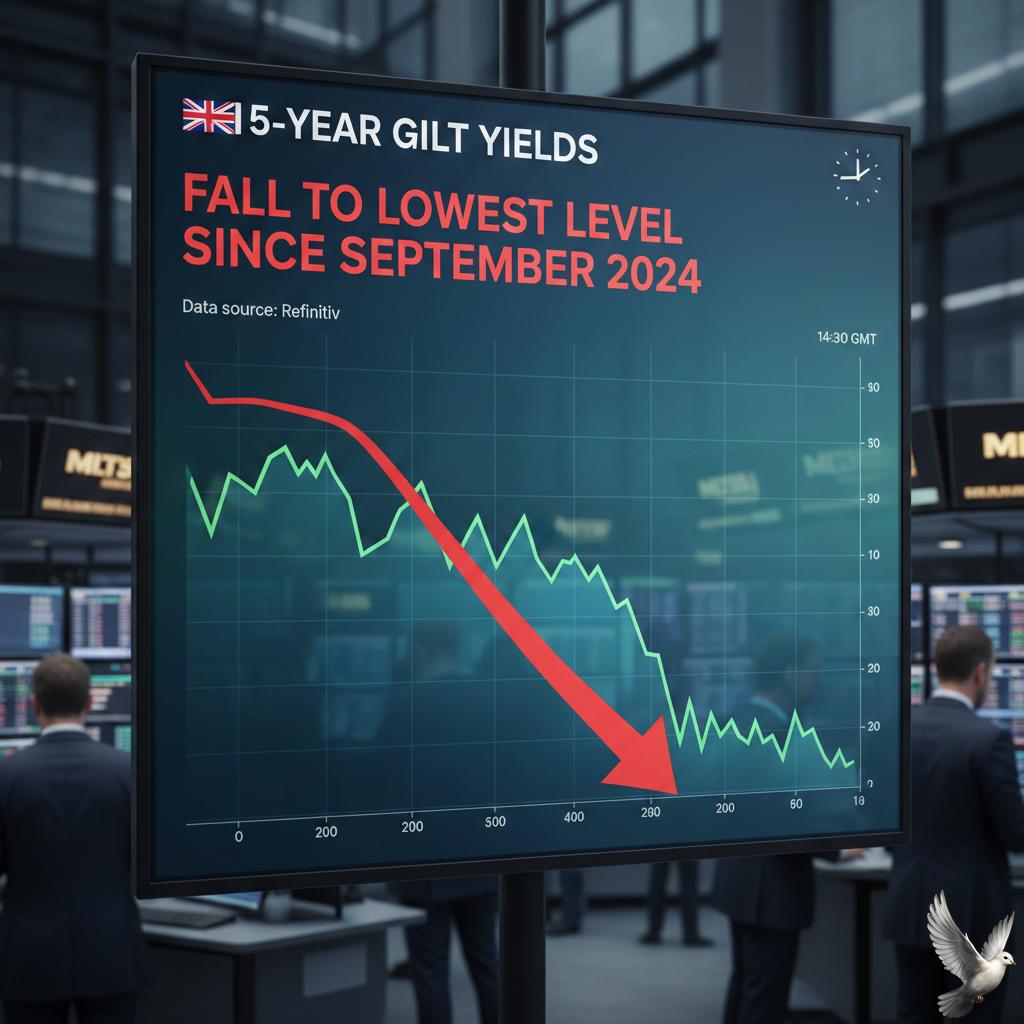
UK 5-year gilt yields fall to lowest level since September 2024
British government bonds are experiencing a notable shift as of late February 2026, with short-dated gilt yields trending lower. This movement comes as investors increase their bets on upcoming interest rate cuts, fueled by a cooling inflationary environment and a loosening labor market. The UK 2-year gilt yield recently eased to approximately 3.57%, reflecting growing market conviction that the Bank of England will transition to a more accommodative stance. Similarly, the 10-year benchmark yield has softened to 4.37%, hitting its lowest level since mid-January. Recent data confirms that headline CPI inflation fell to 3.0% in January, a significant drop from the 3.4% recorded in December. This brings inflation back toward the central bank’s 2% target more quickly than many analysts had anticipated. Core inflation also slowed to 3.1%, marking its lowest point in over four years. Labor market signals are further reinforcing the case for easing. The unemployment rate has climbed to 5.2%, the highest level since early 2021 when excluding the pandemic years. Wage growth is also moderating, with average weekly earnings rising 4.2%—the slowest pace in nearly two years. Despite these cooling indicators, the domestic economy is showing signs of life. Retail sales volumes surged by 1.8% in January, vastly outperforming the modest 0.2% growth forecasted by markets. This represents the largest monthly increase since May 2024, suggesting that household spending is beginning to recover after a period of stagnation. The public sector also reported a record budget surplus of £30.37 billion for January. While seasonally expected, this figure exceeded consensus estimates and provides the government with slightly more fiscal breathing room ahead of the upcoming Spring Statement. The Bank of England’s Monetary Policy Committee remains closely divided. In its most recent meeting, the group voted 5-4 to hold the Bank Rate at 3.75%. However, the narrow margin—with four members already pushing for a 0.25% cut—highlights the intensifying debate over the timing of the next move. Financial markets are currently pricing in a high probability of a rate reduction by the second quarter of 2026. Many traders are now eyeing the March or April meetings for a potential 25-basis-point cut, with expectations that the benchmark rate could fall toward 3.25% by the end of the year. The outlook for the British Pound remains cautiously constructive. While rate cuts typically pressure a currency, the gradual pace of the Bank of England compared to other central banks has helped the Sterling maintain a favorable interest rate differential. Forecasts suggest GBP/USD could stabilize between 1.30 and 1.38 throughout the remainder of 2026.

Axis Direct Selects Nestle and Britannia Among Top Four FMCG and Retail Stock Picks
Market Brief: High-Conviction FMCG and Retail Picks The FMCG and retail sectors are entering a significant recovery phase in 2026, supported by robust quarterly earnings and a shifting macroeconomic landscape. Recent data indicates a steady consumption rebound, with urban markets showing resilience and rural demand beginning to stabilize after a period of volatility. Axis Direct has identified four high-conviction stocks—Nestle India, Britannia, DOMS Industries, and V-Mart Retail—with projected upsides of up to 32%. This optimistic outlook is fueled by cooling inflation, strategic margin expansions, and the structural shift from unorganized to organized retail across India. Nestle India delivered a standout performance for the quarter ending December 2025. The company reported its highest-ever quarterly turnover of 5,643 crore, marking an 18.5% year-on-year revenue growth. Net profit surged 46% to reach 1,018 crore. This growth was largely volume-led, supported by aggressive brand building and a 42% increase in advertising spend. Analysts have raised price targets to as high as 1,450, citing strong momentum in the confectionery and beverage segments. Britannia Industries continues to demonstrate operational efficiency despite cost pressures in raw materials like palm oil and cocoa. The company reported a 9.5% revenue growth in the latest quarter, with a profit after tax of 680 crore. Management is focusing on a "start-up mentality" to drive innovation, particularly in the e-commerce and adjacency product channels. Current market estimates suggest the stock remains a steady pick with a target range between 5,130 and 5,650. DOMS Industries has emerged as a leader in the stationery segment, capturing nearly 30% of the market for core products like pencils. The company reported a 25.8% year-on-year revenue increase to 567 crore in its latest results. Net profit grew by 8.8%, and the company maintains a strong zero-debt position. Recent technical upgrades and institutional buying have boosted investor confidence, with the stock stabilizing around the 2,300–2,600 level as it scales its manufacturing capacity. V-Mart Retail is positioned as a primary beneficiary of rising aspirational spending in Tier-2 and Tier-3 towns. While the company revised its revenue growth forecast slightly to 15–18% following a subdued festive season, its EBITDA margins showed a significant improvement of 200 basis points, reaching 14.5%. With plans to add 75 new stores in the coming year and a narrowing of losses in its LimeRoad digital segment, analysts maintain a strong buy rating with target prices reaching up to 1,040. The broader sector outlook remains favorable for the second half of 2026. Improving disposable incomes, driven by government fiscal support and tax reforms, are expected to push FMCG volume growth into high single digits. Companies are increasingly balancing value-led volume growth in rural areas with premiumization strategies in urban centers to maximize profitability.

Jewellery and Footwear Projected to Drive Consumer Discretionary Growth
The Indian consumer discretionary sector is entering 2026 with a strong focus on high-growth retail segments. Jewellery and footwear have emerged as primary drivers of spending. The domestic jewellery market is valued at approximately **$31.14 billion** this year, maintaining a steady annual growth rate of **6.1%**. Titan remains a market leader, recently achieving a milestone all-time high share price of **₹4,379.95** in early February. The company’s financial health is reflected in its **22.52%** Return on Capital Employed and a significant **50.49%** growth in net profit. Analysts maintain a bullish outlook, with average price targets for the stock hovering around **₹4,409**. The footwear and value retail segments are showing divergent trends. Metro Brands and Lenskart continue to benefit from premiumisation and urban demand. In the value retail space, Vishal Mega Mart is maintaining its presence with a market capitalisation of over **₹58,200 crore**. While it has faced recent price pressure, the company reported a **10.3%** same-store sales growth for the first nine months of the current fiscal year. The Quick-Service Restaurant (QSR) landscape is undergoing a massive transformation. A landmark merger between Devyani International and Sapphire Foods, effective from April 2026, is set to create a retail giant. The combined entity will operate over **3,000 stores** and is projected to generate annual revenues exceeding **₹7,800 crore**. This consolidation aims to tackle rising input costs and improve operating margins, which are currently trending between **11% and 12%**. Investors are monitoring share swap ratios closely, with Sapphire shareholders set to receive **177** Devyani shares for every **100** shares held. Efficiency and cost management are the current themes across the sector. Companies are prioritising "margin engineering" to combat global trade volatility and shifting consumer behavior. Valuations in the broader market remain stable, as experts see limited downside risk despite a recent **1.5%** correction in the Sensex to **82,498** points. Key metrics for the coming quarters include brand-level margins and same-store sales growth (SSSG). With inflation moderating, the focus has shifted to volume growth and capturing market share in Tier-2 and Tier-3 cities. Retailers are adapting with value-driven pricing and digital integration to maintain momentum in an increasingly competitive environment.

Indian IT Sector's Strategic Pivot: Balancing Shareholder Returns with AI R&D Demands
Market Brief: Indian IT Sector Resilience & AI Transition The Indian IT sector is navigating a period of intense structural shift. As of **February 20, 2026**, the **Nifty IT Index** has seen a sharp correction, trading around the **32,200** level. This represents a decline of approximately **15%** over the last month and over **21%** on a year-on-year basis. Investor sentiment remains cautious as the industry moves from traditional service models to AI-driven frameworks. High-profile warnings from global venture capitalists suggest that traditional outsourcing and BPO services could face near-total disruption within the next **5 years** as AI agents begin to outperform humans in core expertise-based tasks. Capital Allocation and R&D Concerns Critical internal debates center on how IT giants utilize their cash reserves. Analysts note a trend of heavy shareholder payouts through dividends and buybacks rather than aggressive reinvestment. Currently, India’s gross expenditure on R&D remains low at roughly **0.65%** of GDP, significantly trailing global peers like China and the US. In the most recent earnings cycle, large-cap firms reported modest performance. Constant currency growth for major players has remained subdued at levels below **5%**. While rupee depreciation provided a marginal benefit of **30 to 40 basis points** to margins, these gains were largely offset by rising wage costs and lower discretionary spending in the global BFSI and high-tech sectors. Strategic Pivots and Infrastructure Despite the stock market volatility, the industry is recalibrating for a **$350 billion** valuation target by **2026**. Government and industry leaders are pushing a "human-centric" AI vision. The Union Budget **FY26-27** has earmarked **2,000 crore** to accelerate AI adoption, alongside a massive push for domestic data centers. India’s AI market is projected to reach **$28.8 billion** by the end of this year. Companies are increasingly focusing on Global Capability Centres (GCCs), which are expected to generate up to **25%** of all new white-collar tech jobs. Current Market Outlook Valuations for the sector have corrected to near their **10-year median**, drawing mixed reactions from institutional investors. While some see an entry opportunity, others point to a "bearish" technical setup across moving averages. Profitability remains the primary metric for the coming quarters. Investors are shifting focus away from simple revenue growth toward deal pipelines and the ability of firms to integrate generative AI into their service deliveries without cannibalizing existing revenue streams.
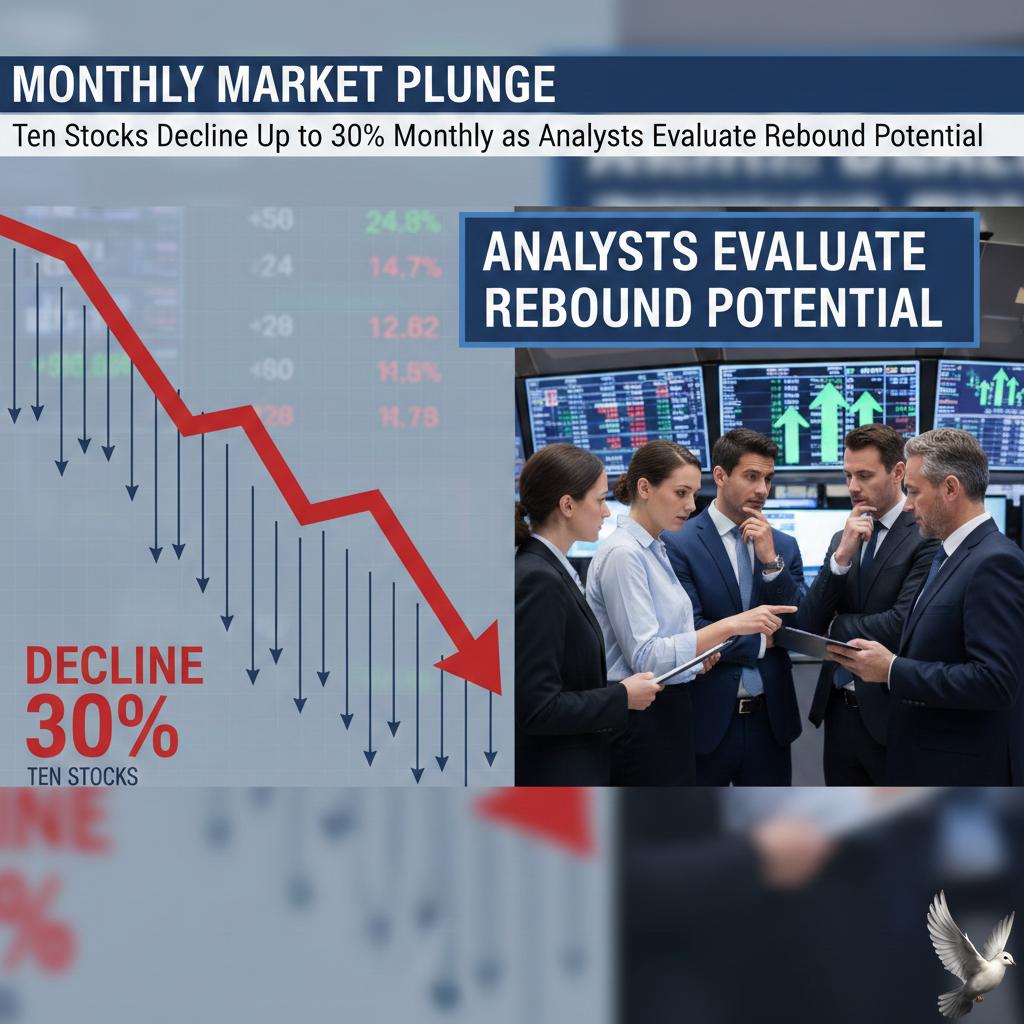
Ten Stocks Decline Up to 30% Monthly as Analysts Evaluate Rebound Potential
**Market Brief: Indian Equities Performance & Outlook** **February 20, 2026** **Current Market Landscape** The Indian equity market is navigating a period of heightened volatility, marked by a significant "sentiment reset" in early February 2026. Following a sharp selloff that wiped out approximately **₹7.55 lakh crore** in investor wealth during a single session on February 19, the market is attempting to stabilize. The **BSE Sensex** is currently trading near the **83,094** mark, while the **Nifty 50** is hovering around **25,655**. Despite recent intraday crashes exceeding **1,200 points**, the underlying economic sentiment remains resilient, supported by strong Q3 corporate earnings and a landmark India-US trade deal that has begun to normalize Foreign Institutional Investor (FII) inflows. **Sectoral Performance and Key Movers** The broader market, specifically the **BSE 500** and mid-cap indices, has faced intense pressure. However, specific sectors are showing signs of a robust rebound: * **FMCG & Defensives:** This sector has emerged as a primary gainer, with **Hindustan Unilever** rising **1.8%** and **Godrej Consumer Products** gaining **1.5%**. * **Banking & Finance:** PSU Banks are outperforming private lenders. **State Bank of India (SBI)** remains a top pick with a target price of **₹1,100**, driven by improved asset quality. * **Metals:** The **Nifty Metal** index recently jumped **1.33%**, led by **Tata Steel** and **Hindustan Copper**, as domestic demand and global trade shifts favor Indian manufacturers. * **Information Technology:** The IT index continues to lag, dropping nearly **1.3%** in recent sessions due to global tech weakness and uncertainty surrounding AI-driven service shifts. **BSE 500 Upside Opportunities** Analysts are identifying high-conviction "buy-on-dip" opportunities within the BSE 500 universe. Several battered stocks are projected to offer substantial double-digit upside: * **Pharma & Healthcare:** **Aurobindo Pharma** is trading with a projected upside of **24%** (Target: **₹1,425**), while **Apollo Hospitals** shows a potential climb of **17%**. * **Hospitality:** **Indian Hotels** is a standout recovery play with analyst targets suggesting a **30%** upside to **₹915**. * **Infrastructure:** **Larsen & Toubro (L&T)** continues to see strong accumulation due to a record order book, with infrastructure bets like **JK Cement** carrying targets near **₹7,000**. * **Telecom:** **Bharti Airtel** is frequently cited as a top wealth creator for 2026, with price targets reaching **₹2,365** behind rising data realizations. **Risk Factors and Economic Indicators** Market participants are closely monitoring several macro variables that contribute to current price swings. **India VIX**, the volatility gauge, recently spiked over **10%** to reach **14.35**, reflecting increased anxiety over global cues. * **Crude Oil:** Brent crude has spiked to **$72** per barrel, creating pressure on oil-importing nations. * **Currency:** The Indian Rupee is trading around **₹90.95** against the US Dollar. * **Manufacturing Strength:** The **HSBC Manufacturing PMI** rose to **57.5** in February, indicating that the domestic industrial engine remains healthy despite equity market turbulence. Investors are largely pivoting toward quality blue-chip stocks with high Return on Equity (ROE), such as **Mazagon Dock** and **Bharat Electronics**, which have maintained strong 5-year compound growth rates above **50%**.

Rahul Shah Advises Using Market Volatility to Accumulate Large-Cap Stocks
Equity markets faced a volatile week ending **February 20, 2026**, characterized by a sharp intraday reversal that erased early gains and sparked intense debate over potential long-term weakness. The volatility peaked on Thursday as the **BSE Sensex** plummeted **1,236 points** to close at **82,498.14**, while the **Nifty 50** dropped **365 points**, sliding below the critical **25,500** level to settle at **25,454.35**. Geopolitical tensions between the U.S. and Iran, combined with a spike in global crude oil prices to **$72 per barrel**, triggered aggressive profit booking. Investor wealth saw a massive erosion of approximately **₹7.5 lakh crore** in a single session, as the **India VIX** surged over **10%** to reflect heightened fear. Despite the immediate correction, the underlying fundamental outlook remains constructive. Corporate India reported a robust **18% year-on-year** profit growth for the latest quarter, marking the fourth consecutive period of double-digit gains. Sectoral performance highlights a "seesaw" phase. While IT and Realty faced pressure, market experts like **Rahul Shah** emphasize that the **BFSI** sector continues to exhibit strength backed by double-digit credit growth and stable asset quality. The **Metals** sector is positioned for a pickup as steel demand stabilizes, while **Consumption**, **Autos**, and **Cement** maintain positive momentum. Cement manufacturers specifically are projected to see operating profits rise between **12% and 18%** throughout **2026**, driven by government infrastructure spending. Investors are advised to utilize these dips for selective accumulation of **largecap stocks** where valuations remain fair. In contrast, the broader market shows signs of froth, with many small and mid-cap names trading at expensive multiples. The focus now shifts to global triggers and the potential for a bounce-back if West Asian tensions de-escalate, allowing markets to realign with India's strong **7% GDP** growth trajectory.
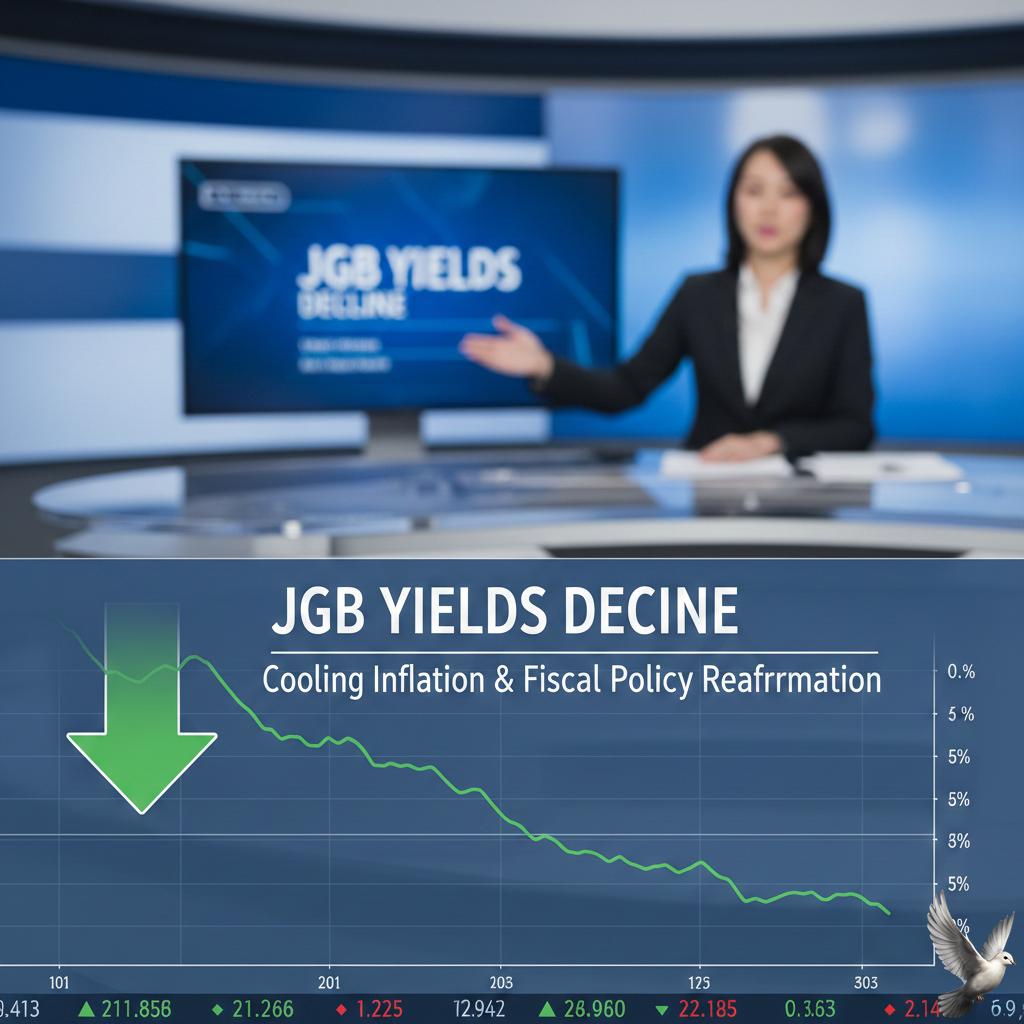
JGB Yields Decline Following Cooling Inflation and Fiscal Policy Reaffirmation
Japanese government bonds rallied on Friday as new economic data signaled a significant cooling in inflationary pressure. The benchmark 10-year JGB yield declined toward 2.11%, hitting a six-week low. This downward movement reflects a shifting outlook for monetary policy as price growth moderates across the archipelago. Headline inflation dropped sharply to 1.5% in January, down from 2.1% the previous month. This represents the lowest level since March 2022. Core inflation, which excludes volatile fresh food, matched the Bank of Japan’s 2% target. This slowdown is the slowest pace of core price growth in two years, primarily driven by government energy subsidies and a stabilization in food costs. The easing data provides the Bank of Japan with critical breathing room. While the central bank recently raised its key interest rate to 0.75%, the cooling CPI suggests there is less immediate urgency for further hikes in the first half of 2026. Markets are now adjusting expectations for the next potential move, previously anticipated for the second quarter. Political stability is further anchoring the bond market. Following her landslide election victory, Prime Minister Sanae Takaichi has reinforced her commitment to a "proactive but responsible" fiscal strategy. Her administration plans to break from years of austerity by boosting strategic investments in semiconductors and AI, while simultaneously vowing to manage the national debt burden. Investor sentiment has also been bolstered by the Prime Minister's proposal for a two-year suspension of the consumption tax on food. This measure aims to protect household purchasing power without triggering the fiscal jitters that unsettled markets late last year. Early auction results for shorter-term debt have shown robust demand as political risk premiums continue to fade. Equities saw a different reaction to the data. The Nikkei 225 Index fell 1.18% to end the session at 56,789 points. The retreat was led by banking and technology stocks, as lower yields weighed on financial profit outlooks and global geopolitical tensions tempered risk appetite. Despite the daily dip, the index remains up significantly over the past year. The broader outlook for the Japanese economy remains resilient. Machinery orders saw a record jump in December, and manufacturing sentiment is rebounding. While the IMF has cautioned against excessive fiscal loosening, the current blend of slowing inflation and steady political leadership has successfully calmed the volatility that characterized the JGB market in recent months.

Global AI Volatility Drives Investor Interest Toward India’s Domestic Growth and Demand
Market Brief: India’s Growth Resilience India’s economy is demonstrating exceptional strength as a global growth anchor. Real GDP expanded by **8.2%** in the second quarter of the current fiscal year, outpacing most major economies. The Reserve Bank of India has maintained an optimistic outlook, with full-year growth projections recently revised upward to **7.3%**. Stock Market and Capital Flows The equity markets reached significant milestones in February 2026. The Nifty 50 has recently stabilized near the **25,800** mark, while the BSE Sensex trades around the **83,700** level. Despite a period of volatility where foreign institutional investors (FIIs) net sold approximately **₹1,374 crore** in early February, domestic liquidity has provided a massive cushion. Domestic Institutional Investors (DIIs) remained aggressive buyers, injecting nearly **₹11,500 crore** month-to-date. This internal capital pool, driven by a surge in systematic investment plans, has reduced the market's historical dependence on foreign outflows. Currency and External Stability The Indian Rupee has shown remarkable resilience against the US Dollar. Bolstered by a landmark trade agreement with the United States that lowered reciprocal tariffs to **18%**, the currency appreciated to **90.27** per dollar in early February. Foreign exchange reserves reached an all-time high of **$701.4 billion** in January 2026. This provides the economy with a robust import cover of roughly **11 months**, shielding the domestic market from global currency shocks and ensuring stability for long-term investors. Sector Performance and Trends While the global technology sector navigates a significant shakeout in AI-related valuations, India’s focus has shifted toward high-growth industrial and financial segments. Manufacturing GVA growth accelerated to **9.13%**, supported by the India Semiconductor Mission 2.0 and a **₹40,000 crore** allocation for electronic component production. Financial services also remain a primary driver, with the banking index outperforming broader benchmarks and gross non-performing assets (NPAs) hitting a multi-decadal low of **2.2%**. Strategic Infrastructure Push The Union Budget 2026-27 has committed a massive **₹12.2 lakh crore** to capital expenditure. This fiscal strategy prioritizes: * **Infrastructure:** Expansion of Vande Bharat sleeper trains and new freight corridors. * **Energy:** A **₹20,000 crore** Nuclear Energy Mission to support small modular reactors. * **Consumption:** Private consumption now accounts for **61.5%** of GDP, the highest level in over a decade. Investors are increasingly viewing India as a diversified alternative to speculative tech bubbles. The transition toward real-sector earnings—spanning metals, capital goods, and domestic consumption—is attracting patient capital looking for sustained, non-disrupted growth.

Australian Equities Decline Following Record Highs While Banking Sector Secures Weekly Gain
Australian shares concluded a volatile trading week with a total gain of **1.8%**, despite a minor dip during the Friday session. The benchmark ASX 200 retreated **4.8 points** to finish at **9,081.4**, snapping a four-day winning streak after touching a record intraday high of **9,118.3** on Thursday. The weekly advance was largely fueled by a robust corporate reporting season. Banking heavyweights acted as the primary anchor for the market, with the sector rising **2.8%** over the five days. National Australia Bank and other major lenders delivered results that exceeded analyst expectations, prompting a wave of earnings upgrades and discouraging a widely anticipated rotation into mining stocks. The mining sector faced downward pressure on Friday, sliding **0.7%**. This move was led by Rio Tinto, which saw its shares fall **3.1%** after reporting annual profits that missed market estimates. While BHP managed a slight daily gain of **0.2%**, the broader materials index remained sensitive to iron ore prices, which have recently hovered near six-month lows. In contrast, the gold sector provided a bright spot for investors. As gold prices pushed toward **US$5,022** an ounce, major producers like Evolution Mining and Northern Star saw significant buying interest. Gold remains a standout performer in the commodities space, with some forecasts projecting continued record highs through the remainder of the year. Retail and energy sectors are moving into the spotlight as investors prepare for upcoming results from Woodside Energy, Woolworths, Coles, and Qantas. There is high anticipation surrounding these reports to see if consumer-facing businesses can maintain margins against a backdrop of "stubbornly high" inflation and a recent interest rate hike by the Reserve Bank of Australia to **3.85%**. The most dramatic individual move occurred in the fast-food sector. Guzman y Gomez shares plummeted as much as **16.5%** on Friday, hitting a record low of **$17**. Despite reporting a **45%** increase in net profit to **$10.6 million**, the market focused on weaker-than-expected same-store sales growth and significant losses in its United States operations. Economic indicators released throughout the week suggest a cooling but still resilient economy. The Composite PMI slipped to **52.0** in February, indicating continued expansion at a more moderate pace. Meanwhile, the Australian Dollar remained steady near **70.3 US cents**, supported by the central bank's hawkish stance and the possibility of further rate tightening in May. The current market environment reflects a delicate balance between strong corporate earnings and the persistent pressure of elevated interest rates. While the ASX 200 remains near historic peaks, the focus for the coming week will stay firmly on the final stretch of the February reporting season to determine if the rally has further room to run.

Markets Await New Catalysts Despite Steady Fundamentals, According to Karthikraj Lakshmanan
Market Outlook: Resilience Amid Volatility The Indian equity market is demonstrating remarkable stability as of **February 20, 2026**, characterized by a tug-of-war between strong domestic fundamentals and shifting global sentiments. While geopolitical tensions in West Asia and a tech-sector slowdown have introduced intermittent friction, the underlying economic engine remains robust. Economic Indicators and Growth India continues its reign as the fastest-growing major economy. The **FY26 GDP** growth is estimated at **7.4%**, and projections for **FY27** remain healthy between **6.8% and 7.2%**. This expansion is fueled by a "double engine" of resilient private consumption and aggressive public capital expenditure. Inflation has entered a new era following the 2024 base year revision. Retail inflation for January 2026 stood at **2.75%**, firmly within the Reserve Bank of India’s target band of **2%–4%**. While a low base in 2025 initially suppressed figures, expectations for **FY27** see inflation normalizing toward **4.3%**, allowing the central bank room to maintain a supportive monetary stance. Market Performance and Indices Recent trading sessions highlight a recovery phase. On **February 18, 2026**, the **Nifty 50** closed at **25,819.35**, while the **BSE Sensex** settled at **83,734.25**. Although large-caps faced pressure earlier in the month due to a **7%–8%** weekly decline in the IT index, financial and metal sectors have led a subsequent rebound. The broader market shows a significant performance gap. While the Nifty 50 has defended key levels, the **Nifty Smallcap 100** rose by **0.56%** in mid-February, outperforming benchmarks that were more exposed to the global "tech meltdown." Sectoral Trends and Earnings Corporate health is expected to stay strong into **FY27**, with sales growth in sectors like healthcare and pharmaceuticals projected at **13%–14%**. The banking sector remains a primary pillar of strength, with the **Nifty Bank** hovering around the **60,180** mark, supported by steady credit growth and healthy asset quality. Financials and select mid-caps are currently the preferred segments for investors adopting a bottom-up approach. Despite the **BSE Midcap index** showing a weak advance-decline ratio recently, specific stocks in industrials and energy—such as those gaining over **5%** in single sessions—indicate that value is being found in individual business fundamentals rather than broad themes. Strategic Outlook Investors are navigating a market that has matured beyond simple valuation expansion. With the **Nifty 50** fair value for March 2026 estimated near **27,300**, returns are increasingly tied to actual earnings growth rather than speculative multiples. Foreign exchange reserves remain a critical buffer, standing at approximately **$701.4 billion**. This provides an 11-month import cover, insulating the rupee—currently trading near **90.66** against the dollar—from external shocks and ensuring a supportive environment for long-term equity accumulation.

GMDC Shares Rise 4% Following India's Inclusion in Pax Silica AI Initiative
India has formally entered the US-led Pax Silica strategic alliance, a move designed to decouple global supply chains from external dependencies in the semiconductor, AI, and critical mineral sectors. This partnership places India alongside key economies like Japan, South Korea, and the UK, focusing on the end-to-end technology stack—from raw mineral extraction to the deployment of advanced AI infrastructure. Gujarat Mineral Development Corporation (GMDC) has emerged as a central player in this transition. The company's shares recently surged by 4.4%, part of a broader 121% gain over the past 12 months. Investors are increasingly focused on GMDC’s strategic shift toward rare earth elements (REE), which are essential for high-tech manufacturing and defense. Market activity in late 2025 and early 2026 has been further energized by the Cabinet’s approval of a ₹7,280 crore incentive plan for Rare Earth Permanent Magnets. This scheme aims to establish an annual production capacity of 6,000 metric tonnes. GMDC is positioning itself to be a primary beneficiary, planning a massive capital expenditure of ₹13,000 crore by 2030 to develop an integrated REE value chain. Financially, the company remains stable despite mixed quarterly signals. For the quarter ended December 2025, GMDC reported a net profit of ₹133 crore. While operational sales saw a 11.37% dip to ₹579 crore, the company's bottom line was previously bolstered by a significant exceptional gain of ₹474 crore following tax structure adjustments. Operating as India’s second-largest lignite producer, GMDC is diversifying rapidly to meet new industrial demands. Current projections suggest 10% to 15% volume growth in lignite for the 2026 fiscal year. Furthermore, the company’s expansion into coal mining in Odisha and copper projects in Ambaji are expected to begin contributing to revenue by 2027 and 2028 respectively. The National Critical Mineral Mission, backed by a ₹16,300 crore government allocation, provides a robust policy tailwind for these efforts. By eliminating customs duties on 25 critical minerals, the Indian government is lowering the cost of domestic processing. GMDC is leveraging this environment to transition from a traditional mining firm into a high-value critical minerals hub. With a market capitalization holding steady near ₹18,400 crore and a debt-free balance sheet, the company is well-equipped to fund its ambitious 2030 growth targets. The convergence of international diplomacy through Pax Silica and domestic industrial incentives has turned GMDC into a focal point for India’s technological self-reliance.
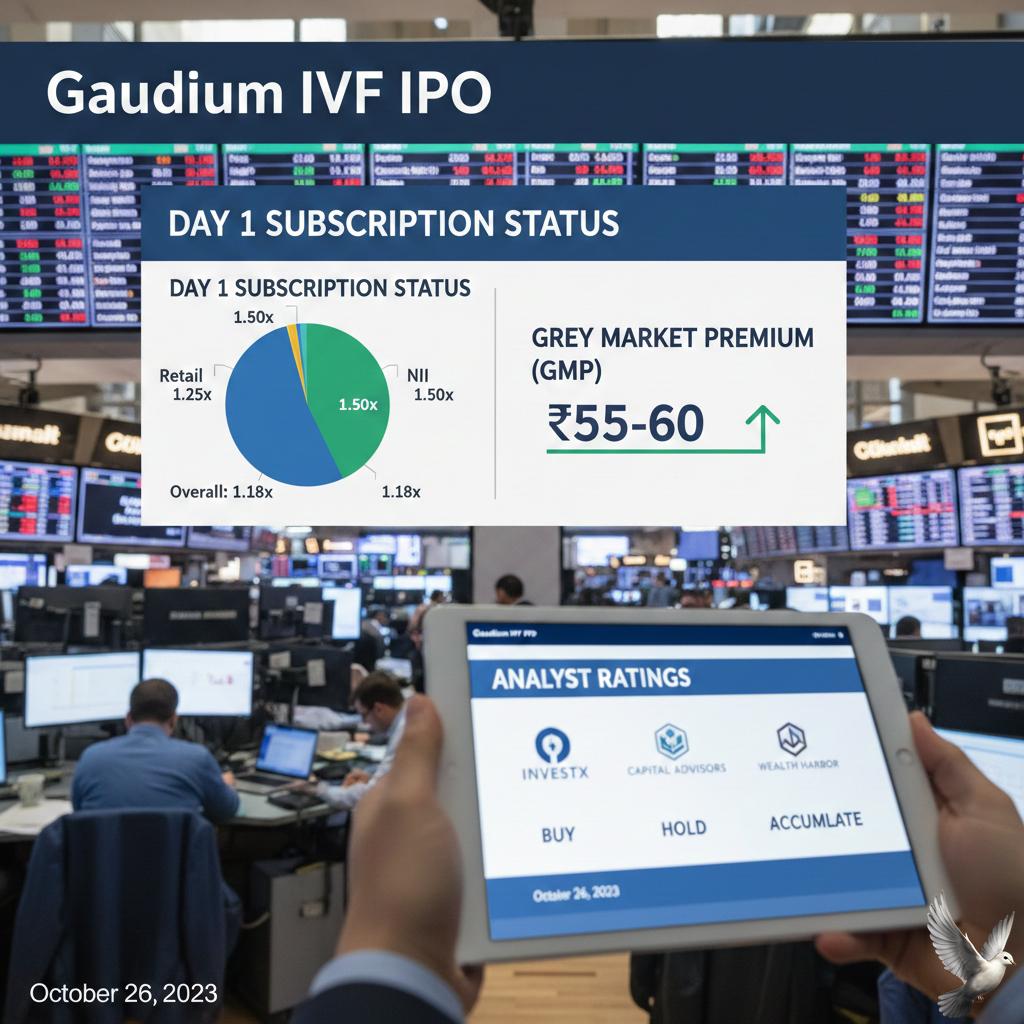
Gaudium IVF IPO: Day 1 Subscription Status, Grey Market Premium, and Analyst Ratings
Gaudium IVF and Women Health Limited has launched its Initial Public Offering (IPO), marking a significant entry for the specialized fertility sector into the Indian primary market. The issue opened for subscription on February 20, 2026, and is scheduled to close on February 24, 2026. The company has established a price band of ₹75 to ₹79 per equity share, aiming to raise a total of ₹165 crore through a mix of fresh issuance and an offer for sale. **Initial Market Response** On the first day of bidding, the IPO saw a steady start with an overall subscription of approximately 40%. The demand was primarily led by retail investors, who subscribed to roughly 34% of their reserved portion within the early hours. In the grey market, the premium (GMP) currently hovers around ₹8 to ₹9, suggesting a potential listing gain of approximately 10% to 11% over the upper price band. **Financial Performance and Growth** Gaudium IVF has demonstrated robust financial health, reporting a total income of ₹70.96 crore for the fiscal year ending March 2025. This represents a significant year-on-year growth, with Profit After Tax (PAT) surging by over 85% to reach ₹19.13 crore in the same period. The company maintains healthy operational efficiency with EBITDA margins near 40% and a Return on Equity (ROE) exceeding 41%. **Industry Outlook** The Indian fertility services market is on an aggressive growth path, valued at approximately $1.54 billion in 2024. Experts project the sector to expand at a compound annual growth rate (CAGR) of 16% to 17%, potentially reaching $9 billion by 2035. Drivers for this expansion include rising infertility rates, delayed parenthood, and increased societal acceptance of Assisted Reproductive Technology (ART). **Strategic Use of Proceeds** The company plans to utilize ₹90 crore from the fresh issue to fuel its expansion. Specifically, ₹50 crore is earmarked for establishing 19 new IVF centers across India between 2027 and 2029. Additionally, ₹20 crore will be used to reduce debt, which currently stands at approximately ₹22.5 crore, helping to strengthen the balance sheet for future scalability. **Investment Considerations** Brokerages have largely provided a positive outlook, citing the company's asset-light "hub-and-spoke" model and its leadership in a high-demand niche. At the upper price band of ₹79, the stock is valued at a P/E ratio of approximately 25.3x based on FY25 earnings, which is seen as competitive compared to broader healthcare peers. However, investors are advised to monitor a pending tax dispute involving ₹31 crore and the geographic concentration of existing centers as potential risk factors. **Key IPO Timeline** - Subscription Closes: February 24, 2026 - Basis of Allotment: February 25, 2026 - Credit to Demat: February 26, 2026 - Listing Date: February 27, 2026 The shares will be listed on both the BSE and NSE, providing a new entry point for investors looking to capitalize on the medical tourism and domestic fertility growth story in India.

Reliance Industries’ $110 Billion AI Strategy: Implications for Investors and India's Tech Sector
Reliance Industries has announced a transformative 110 billion dollar (10 lakh crore rupees) investment cycle focused on building India’s sovereign AI and data center infrastructure over the next seven years. This capital commitment is designed to transition the conglomerate from a traditional energy leader into a deep-tech powerhouse. A central pillar of this strategy is the integration of cheap renewable energy with high-scale computing. The company is currently constructing a multi-gigawatt AI-ready campus in Jamnagar, Gujarat. The first phase of this project is scheduled to bring 120 megawatts of capacity online in the second half of 2026. By 2030, the group aims to reach a total data center capacity of 1 gigawatt. This scale is expected to generate approximately 1.5 billion dollars in annual revenue, with projected EBITDA margins between 40 percent and 50 percent. The cost advantage is anchored by a massive 10 gigawatt green power surplus from solar installations in Kutch and Andhra Pradesh. This vertical integration allows for significantly lower operational costs for AI training and inference. Financially, the group maintains a robust position with an annual consolidated EBITDA exceeding 2 lakh crore rupees. Recent S&P Global ratings have upgraded the company to A- with a stable outlook, reflecting confidence in its cash flow. Shareholders are anticipating significant value unlocking through planned demergers. The Jio platform demerger is expected to proceed shortly, followed by the retail business and potential renewable energy monetizations. As of February 2026, the company’s market capitalization remains near 19.5 lakh crore rupees. The current strategy aims to democratize AI by reducing the cost of intelligence as effectively as the firm previously disrupted the mobile data market. [Deven Choksey on Reliance's $110 billion AI bet](https://www.youtube.com/watch?v=kgJ-6xUVeA4) This video provides an expert analysis of the financial impact and strategic reasoning behind the massive investment in AI and data centers. http://googleusercontent.com/youtube_content/0

Godfrey Phillips Shares Decline 5% Following Recent 26% Rally
Godfrey Phillips India experienced a sharp reversal in today’s session, with shares plunging to an intraday low of **2,401**. This **4.84%** decline marks a significant shift in sentiment after a robust three-day winning streak that had previously pushed the stock higher. The sell-off occurred despite a generally resilient broader market, where the Sensex climbed over **600 points** to finish at **82,892.13**. Investors engaged in aggressive profit booking, causing the cigarette maker to underperform the FMCG sector by a substantial **4.59%**. The tobacco industry is currently navigating a major fiscal overhaul following the implementation of a new excise duty structure on February 1, 2026. This regime has replaced the old compensation cess with a length-based duty, pushing retail prices up by **22% to 28%** for standard segments. While peers like ITC and VST Industries have initiated strategic price hikes to offset these costs—raising some pack prices by **25 to 55**—the market remains concerned about volume elasticity. Premium long-stick variants have faced the steepest tax impact, with duties reaching approximately **5.40 per stick**. Technically, Godfrey Phillips maintains support above its short-term **5-day and 50-day** moving averages. However, the stock continues to trade below its **200-day** moving average, a key long-term indicator that historically separates bullish and bearish phases. The company's recent Q3 results showed a **6.40%** rise in net profit to **353.61 crore**, but analysts are closely watching for signs of demand shifts toward illicit products or cheaper alternatives as legal cigarette prices climb toward **21 to 22** per stick. Market liquidity remains high, with nearly **7.82 lakh** shares changing hands today, reflecting a total traded value of approximately **190.10 crore**. This high-volume activity suggests that while institutional interest is present, the immediate path for the stock is defined by volatility. Looking ahead, the sector faces a structural shift. While the Indian cigarette market is projected to reach **66.2 billion USD** by 2034, near-term valuations for individual players remain capped by regulatory overhang and the ongoing transition to the new 2026 tax landscape.

NSE to Impose 15% Additional Margin on 18 F&O Stocks Effective March
Market dynamics are shifting as we enter the March 2026 series, with the National Stock Exchange (NSE) implementing a stringent 15% additional exposure margin on 18 specific stocks within the Futures and Options (F&O) segment. This regulatory move targets securities where the top 10 clients collectively hold more than 20% of the Market Wide Position Limit (MWPL). By increasing capital requirements for these concentrated positions, the exchange aims to curb excessive leverage and safeguard against systemic shocks in volatile equity derivatives. The list of affected securities includes high-profile names such as Vodafone Idea, SAIL, DLF, Bandhan Bank, and RBL Bank. Traders in these scrips will face the higher of either this new 15% exposure margin or existing surveillance margins, determined by three months of rolling data. In contrast to the tightening in equities, the NSE and MCX have moved to provide relief in the commodities space. Effective February 19, 2026, additional margins on gold and silver futures have been withdrawn. Gold futures saw the removal of a 3% additional margin, while silver futures benefited from a 7% reduction. This easing follows a period of extreme price swings where silver hit a peak of 3,50,000 per kg earlier in the month before retracing. As of February 20, 2026, the equity benchmarks are navigating a cautious environment. The Nifty 50 is holding steady near the 25,470 level, while the BSE Sensex remains positioned around 82,500. Market sentiment is currently balanced between strong domestic corporate earnings and rising geopolitical tensions in West Asia. These global uncertainties have pushed Brent crude prices toward the 72 dollar mark, adding a layer of risk for oil-importing economies. Precious metals are showing signs of a tentative recovery. Gold is trading near 1,56,640 per 10 grams, rebounding from recent lows. Silver has also regained ground, currently hovering around 2,70,100 per kg, as investors engage in bargain hunting following the significant margin relief. Institutional activity shows a trend of caution. Recent data indicates that Foreign Institutional Investors (FPIs) were net sellers to the tune of 880 crore, while Domestic Institutional Investors (DIIs) also recorded net sales of approximately 596 crore in the latest sessions. The combination of higher margins for concentrated stock positions and relaxed requirements for bullion indicates a strategic pivot by regulators to stabilize the broader financial ecosystem as the new month approaches.

Oil Prices and Geopolitical Stability Drive Market Outlook, Says Andrew Freris
Market participants are showing increased resilience toward geopolitical shocks, with investors largely overlooking international conflicts unless they present a direct threat to global growth or inflationary stability. While regional tensions remain a critical variable, markets have increasingly priced in these risks as part of the broader macroeconomic landscape. Crude oil continues to be the primary indicator of geopolitical stress. West Texas Intermediate (WTI) futures recently climbed toward $67 per barrel, reaching a six-month high amid heightened tensions in the Middle East. Despite these price spikes, global supply remains relatively balanced. This stability is underpinned by record-breaking U.S. production, which reached 13.74 million barrels per day in February 2026, alongside strategic output decisions from OPEC. Investor attention has shifted toward domestic economic resilience. Recent U.S. data remains mixed but firm, with weekly jobless claims falling to a five-week low of 206,000 and the Philadelphia business outlook survey unexpectedly rising to a five-month high of 16.3. These figures suggest a labor market and manufacturing sector that are holding steady despite restrictive monetary conditions. The Federal Reserve's policy path remains the central focus for capital markets. Current interest rates are held at a range of 3.50% to 3.75%. Although the Fed delivered three rate cuts in 2025, the outlook for further reductions in 2026 has been delayed. Policymakers have signaled a patient approach, as core inflation metrics—specifically the Personal Consumption Expenditures (PCE) price index—show a persistent climb toward 2.8% to 2.9%. Equities have reflected this "higher-for-longer" sentiment through increased volatility. The S&P 500 is currently hovering near 6,843, while the Nasdaq Composite sits around 22,578. While major indices have touched record highs, gains are increasingly concentrated in sectors like healthcare and utilities, as tech-heavy benchmarks face pressure from rising Treasury yields. The 10-year Treasury yield has edged up to 4.07%, reflecting the market's expectation that the central bank will not rush into further easing. Global demand for oil is forecast to rise by 850,000 barrels per day in 2026, driven almost entirely by non-OECD economies. However, with global supply projected to increase by 2.4 million barrels per day in the same period, the long-term outlook for energy prices remains tempered. This supply-side cushion provides a buffer that allows broader financial markets to maintain a constructive outlook even as regional instabilities persist.

ABB India Shares Rise Following Record Orders and Q4 Demand
Market Brief: ABB India Performance Update ABB India shares surged **6.78%** on February 20, 2026, reaching an intraday high of **₹6,119.00** on the National Stock Exchange. The stock movement followed the release of the company’s financial results for the quarter and full year ending December 31, 2025. This rally positioned the stock near its **52-week high** of **₹6,260.00**, significantly outperforming the broader Nifty 50 and Sensex indices during the session. Record Order Inflows and Backlog The company reported its highest-ever order intake for the 2025 financial year, totaling **₹14,115 crore**, an **8%** increase year-on-year. The fourth quarter was particularly robust, with order inflows jumping **52%** to **₹4,096 crore**. This surge marks a five-year peak for December quarter orders, driven by intense activity in high-growth sectors. Key demand drivers included data centers, railways, automotive, metals, and infrastructure. As of year-end 2025, the order backlog stood at **₹10,471 crore**, reflecting a **12%** increase over the previous year. This backlog provides the company with substantial revenue visibility as it enters the 2026 fiscal cycle. Revenue Growth and Dividend Announcement Annual revenue reached a historic high of **₹13,203 crore**, growing **8%** compared to 2024. For the final quarter of the year, revenue climbed **6%** to **₹3,557 crore**. Growth was broad-based, with all business segments contributing positively, led by strong export performance in the electrification division. In a move to reward shareholders, the Board of Directors recommended a final dividend of **₹29.59** per equity share. This brings the total dividend for the 2025 financial year to **₹39.36** per share. The record date for the final dividend is set for May 2, 2026, with payment scheduled following the Annual General Meeting on May 9. Profitability and Cost Pressures Despite the record top-line performance, profitability faced headwinds from inflationary pressures. Profit After Tax (PAT) for the fourth quarter fell **18%** to **₹434 crore**, while full-year PAT declined **11%** to **₹1,669 crore**. Operating margins were squeezed by higher material costs, increased labor expenses, and volatility in metal prices and currency exchange. The Profit Before Tax (PBT) margin for the quarter contracted to **16.2%** from **21%** in the prior year. The company noted that these costs were partially offset by commodity hedging and operational efficiency gains. Strategic Restructuring Parallel to its financial reporting, ABB India announced a strategic restructuring of its robotics operations. On February 10, 2026, the company executed an agreement to divest its shareholding in ABB Robotics India Private Limited to ABB Robotics Schweiz AG. This transaction is expected to conclude by February 27, 2026, as part of a global alignment within the ABB group. The company maintains a strong liquidity position with cash and equivalents totaling **₹5,694 crore**. Moving into 2026, management indicated a focus on disciplined execution to navigate volatile input costs while capitalizing on India's accelerating industrial automation market, which is projected to grow at a **14%** CAGR through 2031.

Brainbees Solutions Shares Rise 13% Following Four-Session Decline
**Market Brief: Brainbees Solutions (FirstCry)** Brainbees Solutions shares staged a sharp intraday recovery today, February 20, 2026, surging **10.27%** to reach a high of **₹232.75**. This rally effectively breaks a punishing four-day losing streak that saw the stock plummet following its third-quarter earnings release. Trading activity remained intense throughout the morning session, with volumes significantly exceeding recent averages. The bounce follows an all-time low of **₹207.05** hit earlier this week, providing a temporary floor for investors after a period of aggressive selling. **Financial Highlights and Q3 Performance** The recent volatility stems from a mixed Q3 FY26 earnings report. While the company grew its operating revenue by **11.6%** year-on-year to reach **₹2,423.6 crore**, its bottom line remains under pressure. * **Net Loss:** Widened to **₹38.4 crore** from **₹14.7 crore** in the same period last year. * **Revenue Growth:** A steady **11.6%** YoY increase, though growth in the core India Multi-channel (IMC) segment moderated to **9%**. * **EBITDA:** Adjusted EBITDA rose **11.1%** to **₹153.8 crore**, showing some resilience in operational efficiency despite higher costs. The widening loss is primarily attributed to increased expenses related to the expansion of "RocketBees," FirstCry’s rapid-delivery initiative, which now operates in **22 cities**. **Market Trends and Competitive Pressures** The stock continues to face headwinds from "quick commerce" competition. New entrants and established horizontal players have increased promotional spending, particularly in the diaper and consumables categories, leading to a **220 basis point** decline in gross margins. In international markets, revenue growth slowed to **7%**, as the company focused on reducing EBITDA losses—which improved by **25%**—rather than chasing low-margin growth. **Technical and Long-Term Outlook** Despite today’s double-digit percentage bounce, the technical structure remains fragile. The stock is currently trading below all its major moving averages, including the **50-day** and **200-day** markers. * **One-Year Return:** Down approximately **42.4%**. * **Market Capitalization:** Currently hovering around **₹11,280 crore**. * **Resistance Levels:** Analysts identify **₹235** and **₹260** as key immediate hurdles for a sustained trend reversal. Market sentiment is divided. While technical analysts remain cautious due to the breakdown of previous support at **₹260**, some institutional brokerages maintain "Buy" ratings with long-term price targets exceeding **₹390**, citing FirstCry's dominant market share in the mother-and-baby care vertical. The company still holds roughly **₹826 crore** in unutilized IPO proceeds, which are earmarked for further store expansion and marketing through FY27. For now, the market is closely watching if the stock can sustain its position above the **₹210** support zone.
**Sanjeev Bikhchandani Critiques Flawed Comparison of Google Market Cap to India GDP**
Market Brief: Valuation vs. Real Economic Output A viral claim comparing the market capitalization of Alphabet (Google’s parent company) to India’s Gross Domestic Product (GDP) has sparked a debate on the correct metrics for measuring economic scale. Tech entrepreneur Sanjeev Bikhchandani recently debunked the comparison, labeling it a fundamental misunderstanding of "stock" versus "flow" variables. The Misalignment of Metrics Market capitalization represents the total market value of a company's outstanding shares. It is a **stock variable** reflecting future expectations of profit. In contrast, GDP measures the total value of goods and services produced within a country over a specific period—typically one year. It is a **flow variable** reflecting actual economic activity. India’s Economic Standing in 2026 As of February 2026, India’s nominal GDP is estimated at approximately **$4.51 trillion**. The Indian economy continues to be the fastest-growing major economy globally, with a projected growth rate of **7.4%** for the 2026 fiscal year. This growth is largely driven by a surge in manufacturing and robust private consumption, which now accounts for **61.5%** of the GDP. Alphabet’s Financial Scale Alphabet’s current market capitalization fluctuates around **$3.70 trillion**. While this figure appears close to India’s GDP, the actual "size" of the company’s business operations is better reflected in its revenue. In 2025, Alphabet’s annual revenue surpassed the **$400 billion** milestone for the first time, reaching **$402.84 billion**. Key Data Points * **India GDP (2026 Est):** $4.51 trillion * **India GDP Growth:** 7.4% * **Alphabet Market Cap:** ~$3.70 trillion * **Alphabet Annual Revenue:** $402.84 billion * **Alphabet AI Infrastructure Spend (2026):** Up to $185 billion Deepening Integration Despite the flawed valuation comparison, the tech giant’s influence in India is expanding through physical and digital infrastructure. Alphabet recently announced a **$15 billion** investment over five years to establish an AI infrastructure hub in southern India. Furthermore, the new "US-India Connect" initiative involves deploying subsea fiber-optic routes to enhance connectivity. These investments align with India’s push for "open-source AI," a strategy aimed at democratizing technology access for its **1.4 billion** citizens while maintaining digital sovereignty.