Bullish News
Collection
Emerging Market Growth and Increased Asian Investment: February Update
Asian markets closed February 2026 on a historic high, marking the region's strongest performance for the month since 1998. The MSCI Asia Pacific Index surged 6.3% throughout the month, consistently outperforming the S&P 500 for the third consecutive period. Global capital has aggressively rotated into the region, driven by a massive build-out in artificial intelligence infrastructure. Asset managers overseeing more than 20 trillion dollars have increased their long positions in emerging markets, viewing Asian firms as the primary providers of the "picks and shovels" for the global AI supply chain. South Korea emerged as the global standout. The KOSPI index shattered records by crossing the 6,000-point milestone on February 25, just 18 trading days after it first breached 5,000. This representative gauge has gained 20% in February alone and is up 46% year-to-date. The rally is supported by a 37% upward revision in operating profit estimates for the KOSPI 200, primarily fueled by semiconductor giants Samsung Electronics and SK Hynix. Japan also reached unprecedented levels, with the Nikkei 225 climbing 4.5% this month to trade above 57,000. Investor confidence has been bolstered by Prime Minister Sanae Takaichi’s 135 billion dollar monetary easing package and a landslide election victory. Despite trade tensions with China, Japanese tech stocks continue to attract significant inflows, outperforming the S&P 500 by over 200% on a 12-month trailing basis. China’s market sentiment is showing signs of recovery through innovation in high-tech manufacturing and AI. For the first time, Chinese AI model usage surpassed that of the United States in February, with token call volumes reaching 5.16 trillion. Major indices like the Hang Seng and Shanghai Composite remain focal points as the MSCI China Index undergoes quarterly adjustments to include new AI and technology-driven listings. The broader emerging market rally is supported by softening US inflation and a stabilizing dollar, which have encouraged hedge funds to increase Asian stock purchases at the fastest rate since 2016. Buying volume from institutional investors has outpaced short covering by a ratio of 8.4 to 1, indicating a high-conviction shift toward regional growth. While momentum remains strong heading into March, some caution remains. Analysts are monitoring potential profit-taking following the vertical ascent in Seoul and Tokyo. Additionally, the 10-year Treasury yield hovering around 4% and ongoing geopolitical discussions between the US and Iran may introduce volatility. However, the current trend suggests that any pullbacks are being treated as entry points by global allocators.

Nintendo Shareholders and Kyoto Bank to Sell $1.9 Billion Stake: Report
Nintendo is preparing for a massive restructuring of its shareholder base as major Japanese financial institutions move to offload their stakes. In a significant market event, MUFG Bank and the Bank of Kyoto are reportedly planning to sell shares worth approximately 300 billion yen ($1.9 billion). This liquidation is part of a sweeping national effort among Japanese corporations to dismantle decades-old cross-shareholding arrangements. To stabilize its market valuation during this transition, Nintendo is expected to launch a significant share buyback program. A formal decision on this buyback is anticipated as early as today, aiming to absorb the sudden influx of shares and prevent downward price volatility. The timing of this financial shift coincides with strong operational performance from the Kyoto-based gaming giant. In its most recent earnings report, Nintendo posted a net profit of 358.8 billion yen for the nine-month period ending December 31, 2025—a 51.3% increase year-over-year. Revenue also surged nearly 100% to 1.9 trillion yen, driven by the sustained momentum of the Switch 2 console. Despite these figures, Nintendo’s stock has faced pressure recently, trading around 8,734 yen after a 15% decline over the last month. Market analysts are closely watching the upcoming hardware cycle, as the company maintains a full-year sales forecast of 19 million units for its flagship Switch 2. Looking ahead, Nintendo is doubling down on its "transmedia" strategy. The upcoming Super Mario Galaxy movie is expected to serve as a major revenue catalyst in 2026, echoing the success of the 2023 film which nearly doubled the brand’s licensing income. The market brief remains focused on the following key metrics: - 300 billion yen: Estimated value of the strategic share sale. - 1.9 trillion yen: Year-to-date revenue for fiscal 2026. - 51.3%: Growth in net profit. - 19 million: Annual unit sales target for Switch 2. The upcoming days are critical for Nintendo as it navigates both corporate governance reforms and the next phase of its global IP expansion. Investors should watch for the immediate confirmation of the buyback terms, which will likely dictate the stock’s short-term trajectory.
Shriram Finance: Bull Call Spread Strategy
Shriram Finance continues to demonstrate significant bullish momentum, reaching fresh milestones as it breaks out near all-time highs. As of late February 2026, the stock has touched a 52-week high of 1,108.00, reflecting a staggering 82% return over the past year. The market capitalization has surged past 2.07 trillion, cementing its position as a dominant force in the NBFC sector. Current price action shows a steady climb, with the stock recently closing near 1,104.60, supported by a 1.73% intraday gain and robust trading volumes exceeding 5.2 million shares. Technical indicators suggest the rally has further potential. The Relative Strength Index (RSI) currently sits at 63.82, a neutral-to-bullish zone that indicates strength without the immediate risk of being overbought. Key moving averages provide a strong safety net; the 50-day SMA is positioned at 1,001.17, while the 200-day SMA lags significantly at 765.29, confirming a long-term uptrend. Immediate support is established at 1,090.46, with secondary cushions at 1,076.33. On the upside, traders are watching resistance levels at 1,113.36 and 1,122.13. Analysts maintain a highly optimistic outlook, with nearly 94% of tracked experts issuing "Buy" ratings. Price targets have been revised upward, with some institutional forecasts reaching as high as 1,175.00. Fundamentally, the company is benefiting from improved asset quality and expanding margins. Net Interest Margins (NIM) have expanded to 8.58%, while Gross Stage 3 assets improved to 4.54%. AUM growth remains resilient at 15% year-on-year, driven by strong demand in passenger vehicles and farm equipment. Strategic partnerships, including a significant potential equity infusion from MUFG, and recent credit rating upgrades from agencies like S&P and Moody’s, are expected to lower funding costs by approximately 100 basis points over the next two years. Market participants are currently utilizing Bull Call Spread strategies to capitalize on this upside while managing risk. With a 26.7% CAGR in profit over five years and a healthy dividend yield of 0.90%, Shriram Finance remains a preferred pick for both momentum traders and long-term investors in the financial services space.

China Adjusts Currency Rules and Eases Foreign Exchange Forward Requirements to Stabilize Yuan
The People’s Bank of China (PBOC) has launched a strategic intervention to temper the yuan’s rapid appreciation against the US dollar. In a decisive move announced on February 27, 2026, the central bank confirmed it will slash the foreign exchange risk reserve requirement for forward contracts from 20% to zero. This policy shift, effective March 2, 2026, is specifically designed to lower the cost for financial institutions and enterprises to purchase foreign currency, thereby easing the upward pressure on the renminbi. The intervention follows a sustained rally that has pushed the yuan to a 35-month high. Recent market data shows the USD/CNY exchange rate falling for 14 consecutive weeks, recently breaking through the 6.83 level. This surge reflects a broader "debasement trade" affecting the US dollar and a record-breaking $1.2 trillion Chinese trade surplus reported for 2025. While a strong currency signals economic resilience, PBOC officials are increasingly concerned that excessive gains will erode the competitiveness of Chinese exports and fuel speculative "one-way" market bets. By removing the 20% reserve "penalty," the PBOC is effectively encouraging dollar buying to balance market supply and demand. This adjustment reverses emergency measures first implemented in September 2022 when the yuan was facing rapid depreciation. The return to a 0% ratio signals a transition toward policy normalization, suggesting the central bank now views the market as sufficiently stable to function without artificial barriers. Broader economic indicators provide the backdrop for this move. China's GDP is projected to grow by approximately 4.8% to 5.0% in 2026, despite a lingering property sector downturn. The PBOC's focus remains on maintaining the currency at a "reasonable and balanced" level to support this growth. In addition to the reserve ratio cut, the central bank recently injected 300 billion yuan of net liquidity through its Medium-Term Lending Facility (MLF) to ensure ample banking system support during this period of high seasonal demand. Market analysts view these steps as a clear warning against currency overshooting. The PBOC has signaled it will continue to monitor the exchange rate as an automatic stabilizer, but remains ready to deploy further tools—such as "window guidance" or adjustments to the Foreign Exchange Reserve Requirement Ratio (FX RRR)—if the yuan's climb continues at an unsustainable pace. [Chinese Yuan at 35-Month High as Dollar Weakens](https://www.youtube.com/watch?v=7peJ-PHsZe8) This video provides an in-depth look at the recent surge of the Chinese yuan and the factors driving its value against the US dollar. http://googleusercontent.com/youtube_content/0

Block to Reduce Workforce by 4,000 in AI Shift as Shares Rise 25% After Hours
Block is undergoing a historic transformation, slashing over 4,000 jobs to reduce its global workforce by nearly 40%. The company is pivoting from a headcount of over 10,000 to just under 6,000 employees. This aggressive restructuring signals a total commitment to an AI-native operating model. CEO Jack Dorsey informed shareholders that the move is not a reaction to financial distress but a strategic shift. He argues that smaller, flatter teams powered by internal intelligence tools can achieve higher product velocity. The company is specifically leveraging a proprietary AI tool called "Goose" to automate complex workflows across engineering and customer service. Market reaction has been swift and overwhelmingly positive. Block’s stock surged 25% in late February 2026 trading following the announcement. Investors are clearly rewarding the pivot toward higher operating leverage and the promise of AI-driven cost savings. The financial results for the end of 2025 support this lean strategy. Block reported a full-year gross profit of $10.36 billion, marking a 17% increase year-over-year. Cash App remains a primary engine of growth, with gross profit rising 33% to $1.83 billion in the final quarter. Monthly active users for the app reached 59 million. To execute this transition, Block expects to incur restructuring charges between $450 million and $500 million. Most of these costs will hit the books in the first quarter of 2026. The funds are primarily allocated for severance packages, which include 20 weeks of base pay and transition stipends. Management has significantly raised its outlook for 2026. The company now targets $12.20 billion in gross profit and $3.20 billion in adjusted operating income. This represents an expected 54% growth in adjusted earnings per share compared to 2025. The strategy marks a "bellwether moment" for the fintech industry. It demonstrates that even profitable, growing companies are willing to significantly reduce human staff in favor of automation to maximize shareholder value and operational efficiency. [Jack Dorsey's Block Slashes 4,000 Jobs in AI Push](https://www.youtube.com/watch?v=eml2imnhwZg) This video provides a detailed breakdown of the recent job cuts at Block and explains how the company is using AI tools to transform its business model. http://googleusercontent.com/youtube_content/0

US Judge Rules Binance Cannot Compel Arbitration in Cryptocurrency Loss Claims
**Crypto Market Brief: Binance Legal Pressure and Recovery Signals** A significant legal shift has emerged for the world’s largest cryptocurrency exchange. A federal judge recently ruled that customers may proceed with a class-action lawsuit against Binance over the sale of unregistered tokens. This decision follows the court's rejection of Binance's request for mandatory arbitration. The ruling hinges on the finding that Binance failed to provide adequate notice regarding changes to its terms of use. These changes originally sought to force users into private arbitration and waive their right to join class-action litigation. The court's decision now clears a path for investors who suffered losses on seven specific tokens to seek damages through the public judicial system. **Market Performance and Indicators** The broader digital asset market is currently navigating a period of high volatility characterized as a "relief rally" after weeks of intense selling pressure. Bitcoin has recently reclaimed the **$69,000** level, marking a sharp recovery from local lows near **$63,000**. Despite this 7% daily bounce, the leading asset remains down approximately **21%** over the past month. Analysts are closely watching the **$70,000** psychological resistance to determine if this momentum is sustainable. Ethereum is showing signs of stabilizing around **$1,925** after a period of significant underperformance. The asset faced additional pressure this week following reports of substantial liquidations from prominent ecosystem wallets, though it has gained roughly **4%** in the last 24 hours. **Sector Trends and Regulatory Landscape** Solana has emerged as a frontrunner in the recent recovery, surging nearly **14%** to trade above **$82**. This move was fueled by more than **$31 million** in institutional inflows into Solana-based investment products, even as Bitcoin and Ethereum funds experienced net outflows. The total crypto market capitalization now sits at approximately **$2.27 trillion**. While short-term sentiment has improved—liquidating over **$460 million** in short positions—the Fear & Greed Index remains at **11**, indicating "Extreme Fear" among the general retail public. On the regulatory front, the industry is transitioning from policy design to active enforcement. In the U.S., a joint 60-day pause was recently requested in the SEC’s ongoing case against Binance to allow both parties to assess the impact of a newly formed crypto task force. This move suggests a potential pivot toward a more structured resolution or settlement framework. Globally, the European Securities and Markets Authority (ESMA) has issued fresh warnings regarding leveraged "perpetual" contracts, signaling that regulators are tightening their grip on derivative products marketed to retail investors. These developments indicate a market that is maturing under increased scrutiny, even as price action attempts to find a stable floor.

**Silver Surges to Near 2.7 Lakh While Gold Holds Steady Amid Geopolitical and Trade Uncertainty**
Precious Metals Market Brief: February 27, 2026 Silver and gold prices recorded significant upward momentum on the Multi Commodity Exchange (MCX) this Friday. The surge comes as global investors weigh the outcomes of critical US-Iran nuclear negotiations in Geneva and persistent concerns over revised US trade tariffs. MCX Futures Performance Gold futures for April 2026 delivery climbed by **₹482**, trading at approximately **₹1,60,191** per 10 grams. This modest 0.3% gain reflects a steady safe-haven demand despite a firm US dollar. Silver futures for March 2026 delivery witnessed a more aggressive rally. Prices soared by **₹8,340**, or 3.2%, bringing the metal close to the **₹2,68,009** per kilogram mark. This sharp recovery follows a period of intense volatility earlier in the month. Key Market Drivers Geopolitical developments remain the primary catalyst for price action. While mediators report "some progress" in US-Iran talks, the lack of a definitive breakthrough and a continued military buildup in the Middle East have kept risk premiums high. Additionally, the US administration's recent shift toward a **10%** global tariff—with potential escalations to **15%** for specific regions—has fueled economic uncertainty. These trade jitters typically benefit bullion as a hedge against market instability. Physical Gold Rates in India Retail prices for physical gold showed slight variations across major metropolitan hubs, maintaining levels near record highs: * **Delhi**: 24K gold is priced at **₹1,61,960** per 10 grams. * **Mumbai**: 24K gold stands at **₹1,61,160** per 10 grams. * **Chennai**: Prices remain higher due to regional premiums, at **₹1,62,880** per 10 grams. * **Hyderabad**: 24K gold is trading at approximately **₹1,61,680** per 10 grams. Expert Outlook Market analysts suggest the underlying trend for precious metals remains positive. While short-term profit-taking may occur, experts recommend a "buy on dips" strategy. Immediate support for MCX Gold is identified at **₹1,58,100**, while Silver finds strong technical support near the **₹2,53,500** level. Investors are closely monitoring the Federal Reserve's stance, as persistent inflation may lead to an extended hold on interest rates, potentially capping the upside for non-yielding assets like gold.
Mixed Performance for IT Stocks Amid Wall Street Tech Volatility and Rising ADRs
Indian IT stocks remain a focal point for global investors, even as a sharp tech sell-off on Wall Street creates short-term volatility. While the Nifty IT index recently plunged **4.7%** to a 30-month low of **38,245**, heavyweights like Infosys and Wipro have shown resilience in their American Depositary Receipts (ADRs). During recent sessions, Wipro ADRs climbed **2.27%** to **$2.25**, while Infosys maintained steady interest despite broader market pressure. The sector has faced a challenging February, with a cumulative decline of roughly **21%**—the steepest monthly drop for the industry since 2003. This pullback has erased nearly **$50 billion** in market capitalization across the sector. The primary driver of this volatility is the perceived threat of Generative AI to traditional outsourcing models. However, industry forecasts suggest the disruption may be overstated in the short term. The Indian IT sector is on track to grow **6.1%** to reach a total revenue of **$315 billion** in FY26. AI is rapidly evolving from a threat into a revenue engine. Experts estimate that AI-led services will contribute **$10–$12 billion** to industry revenue this year, accounting for about **3% to 6%** of total earnings for major players. This shift is turning AI from an experimental tool into a fundamental component of enterprise proposals. Growth is also being supported by Global Capability Centers (GCCs), which are projected to lead salary hikes with a **10.4%** increment in 2026. Overall IT spending in India is expected to surge **10.6%** to **$176.3 billion**, driven by massive investments in data centers and AI-enabled software. Despite a moderation in headcount growth, the industry remains a net hirer, adding **135,000** jobs this year to reach a total workforce of **5.95 million**. The demand is shifting toward specialized roles in AI, machine learning, and cybersecurity, where skill premiums now range between **30% and 40%**. Market analysts view the current price correction as a potential opportunity for the gradual accumulation of blue-chip stocks. With Tata Consultancy Services (TCS), Infosys, and HCLTech signaling stronger demand for FY27 and robust contract bookings, the sector's long-term outlook remains tied to its ability to scale AI-native capabilities.

360 ONE Asset Manager Identifies Four Sector Opportunities for FY27
Market performance currently reflects a transition toward structural growth, with the Nifty 50 stabilizing near **25,550** and the Sensex holding above **82,400**. Despite recent volatility, liquidity conditions have eased significantly. Credit growth has rebounded to the **13%–14%** range, supported by a shift into surplus system liquidity. Foreign Portfolio Investors (FPI) are showing renewed interest, particularly in debt markets with recent weekly inflows of **₹51.39 billion**. Equity flows remain selective but are buoyed by the recent Indo-US trade deal. Strategic Sector Outlook **Financials and Banking** The sector continues to show resilience as credit growth accelerates and balance sheets remain robust. Large private banks are attracting institutional interest as they navigate a stable interest rate environment. **Telecommunications** Average Revenue Per User (ARPU) is a primary growth driver, with expectations for the sector to reach **₹220–₹225** by late 2026. Premiumization through 5G adoption is offsetting the lack of broad tariff hikes, while upcoming IPOs in the space provide a valuation floor. **Commercial Vehicles** Demand is rebounding with projected volume growth of **4%–6%** for the 2026-27 fiscal year. Heavy commercial vehicles are benefiting from a resurgence in infrastructure projects and mining activities, while the bus segment anticipates **7%–9%** growth due to replacement cycles. **Solar Manufacturing** The industry is shifting toward vertical integration. India aims for **100 GW** of module capacity and **40 GW** of cell capacity by mid-2026. While recent US countervailing duties of **126%** have impacted exporters, domestic demand remains insulated by the **ALMM** mandate. Risk and Valuation Constraints **IT Services** The sector faces structural headwinds from AI-driven disruption. While some recovery is visible, many incumbents are trading at valuations that imply skepticism regarding legacy labor-arbitrage models. **FMCG and Defence** Valuations in these defensive and policy-driven pockets remain rich. Moderate volume growth in consumer goods and high entry multiples in defense stocks suggest a more balanced risk-reward profile compared to high-growth cyclicals. **Currency Stability** The Rupee has shown relative strength, trading near **90.40–90.89** per US Dollar. This stability, supported by steady domestic and foreign inflows, is helping contain imported inflation and providing a calm backdrop for equity markets.

Netweb Technologies Partners With Vertiv on AI and Data Center Solutions
Netweb Technologies India Ltd has officially entered a strategic collaboration with NYSE-listed Vertiv to pioneer liquid-cooled, GPU-based AI infrastructure. This partnership merges Netweb’s high-performance Tyrone compute platforms with Vertiv’s advanced thermal management to address the extreme power and heat demands of next-generation data centers. **Market Performance and Valuation** Netweb Technologies is currently demonstrating exceptional market momentum. As of late February 2026, the company’s stock is trading near **3,630 INR**, reflecting a robust gain of over **17%** in the last month alone. The firm recently reported record-breaking financial results for Q3 FY26, with revenue surging **141%** year-on-year to reach **805 crore INR**. Profitability has followed a similar trajectory, with Net Profit jumping **146.7%** to **73.3 crore INR**. A significant **64%** of this revenue is now driven directly by the AI systems segment, highlighting the company’s successful transition into a dominant AI hardware provider. **Infrastructure and Technical Synergies** The collaboration focuses on rack-scale integration, essential for modern AI training and inference. Netweb’s locally designed GPU platforms will now utilize Vertiv’s end-to-end liquid cooling systems, including coolant distribution units (CDUs) and free-cooling chillers. These integrated solutions are engineered to support high-density environments where IT loads can exceed **200 kilowatts** per rack. By shifting from traditional air cooling to liquid systems, data center operators can reduce Power Usage Effectiveness (PUE) from historical levels of **1.5** down to approximately **1.1**, representing a massive gain in energy efficiency. **Sector Trends and Outlook** The Indian AI data center market is entering a phase of explosive growth, projected to reach a revenue of **41.7 billion USD** by 2033 with a compound annual growth rate of **28.2%**. This expansion is being met by Vertiv’s global scaling; the company recently reported a record order backlog of **15 billion USD**, driven by a **252%** surge in organic orders. Key sector drivers include: - Rising rack power densities surpassing **40 kW** in GPU clusters. - Government-led "Make in India" sovereign AI initiatives. - National grid constraints favoring high-efficiency liquid cooling. This partnership positions both firms to lead the domestic manufacturing of AI-ready hardware. By validating complete rack configurations, Netweb and Vertiv are shortening deployment cycles for hyperscalers and enterprise clients, directly supporting India's goal of becoming a global hub for high-technology manufacturing.

Indian IT Stocks Face Valuation Shift Following 20% Decline
The Indian IT sector is navigating a volatile period as the Nifty IT index faces its most challenging month in nearly 23 years. The index recently plunged 4.74% in a single session, hitting a 30-month low. This sharp decline has wiped out significant market capitalization, with the index down approximately 20% over the last 30 days. Investor sentiment is being tested by the "Anthropic Effect"—the rapid emergence of agentic AI tools like Claude Cowork. These systems can autonomously handle code maintenance, legal documentation, and complex analytics. This poses a direct threat to the traditional labor-arbitrage model where Indian firms bill by the hour. Key market indicators reflect deep anxiety: - Nifty IT index hit a low near 30,797 points - Sectoral valuations have corrected to 14–18x P/E multiples - Foreign portfolio investors remain net sellers of IT stocks in 2026 - Industry giants like TCS and Infosys have led the erosion in absolute market value Despite the downturn, a sharp divide has emerged between "doomsday" and "deep value" perspectives. Some analysts argue that the market has overreacted to the AI threat, creating a rare entry point for long-term investors. They suggest that while traditional "bread and butter" services like ERP implementation face cannibalization, AI will eventually spawn a larger ecosystem of complex projects. The structural shift is already visible in corporate strategies. While IT services underperform, global "Big Tech" firms are projected to spend a record $650 billion on AI infrastructure in 2026. Domestic leaders are also pivoting; Reliance Industries recently pledged 10 trillion rupees over seven years to build local AI infrastructure, signaling a move toward sovereign technology capacity. For the Indian workforce, the transition is demanding. Estimates suggest that 60–65% of the current IT workforce will require significant upskilling within the next five years. The sector is moving toward "human-on-the-loop" oversight, where productivity gains from automation must offset the loss of billable junior-level hours. In the near term, the Nifty IT index remains under pressure as it tests key support levels near 30,000. Resistance is currently capped at the 31,500 range. Markets are now focusing on Q4 FY26 earnings and margin commentary to see if firms can successfully transition from labor-heavy models to high-value, outcome-based AI services.

Hindalco Shares Monitored Amid U.S. Government Shutdown Delay of AluChem Transaction
Hindalco Industries is navigating a complex regulatory environment in the United States as its strategic $125 million acquisition of AluChem Companies faces unexpected delays. The Committee on Foreign Investment in the United States (CFIUS) has temporarily suspended its review of the transaction. This pause is a direct result of the ongoing partial US government shutdown, which has tolled all statutory timelines for regulatory approvals. Hindalco has submitted both short-form and long-form declarations, but a definitive conclusion date remains unavailable until federal operations resume. The acquisition is a cornerstone of Hindalco’s strategy to double its specialty alumina capacity to 1 million tons by 2030. AluChem’s portfolio of ultra-low soda and tabular alumina is critical for high-tech sectors, including semiconductors and electric mobility. While the deal remains in a holding pattern, Hindalco has reaffirmed its commitment to the transaction, which was originally slated for a quick closure. Financial performance for the latest quarter presents a mixed picture. Hindalco reported consolidated revenue of 66,521 crore, a 14% increase year-on-year. However, net profit fell sharply by 45% to 2,049 crore. This decline was largely driven by exceptional items and operational challenges at its US subsidiary, Novelis. Novelis is dealing with the aftermath of fire disruptions at its Oswego plant and a net negative impact from US tariffs. The unit’s adjusted EBITDA per tonne dropped 8% to $448. Higher aluminum scrap prices and an unfavorable product mix have further pressured margins. To counter these headwinds, the company is targeting a cost-reduction run rate of over $150 million by the end of the 2026 fiscal year. In contrast, the Indian upstream aluminum business continues to deliver record-breaking results. The segment achieved an EBITDA of 4,832 crore, up 14%, with industry-leading margins of 45%. This domestic strength has provided a critical buffer against global volatility and the operational setbacks in North America. The broader aluminum market remains in a high-volatility phase. Aluminum futures are holding near a three-year high, trading around $3,100 to $3,150 per tonne. Prices have surged over 22% compared to last year, driven by supply tightness in China and rising energy costs in Europe. While there is potential for prices to test the $3,200 level, market sentiment is cautious as the industry monitors evolving US trade policies and the potential scaling back of certain metal tariffs. Hindalco’s focus remains on maintaining its 1.3x net debt-to-EBITDA ratio while pushing forward with major capital expenditures, including the Bay Minette expansion. Investors are closely watching for a resolution to the US regulatory logjam to gauge the timing of the company's next phase of global growth.
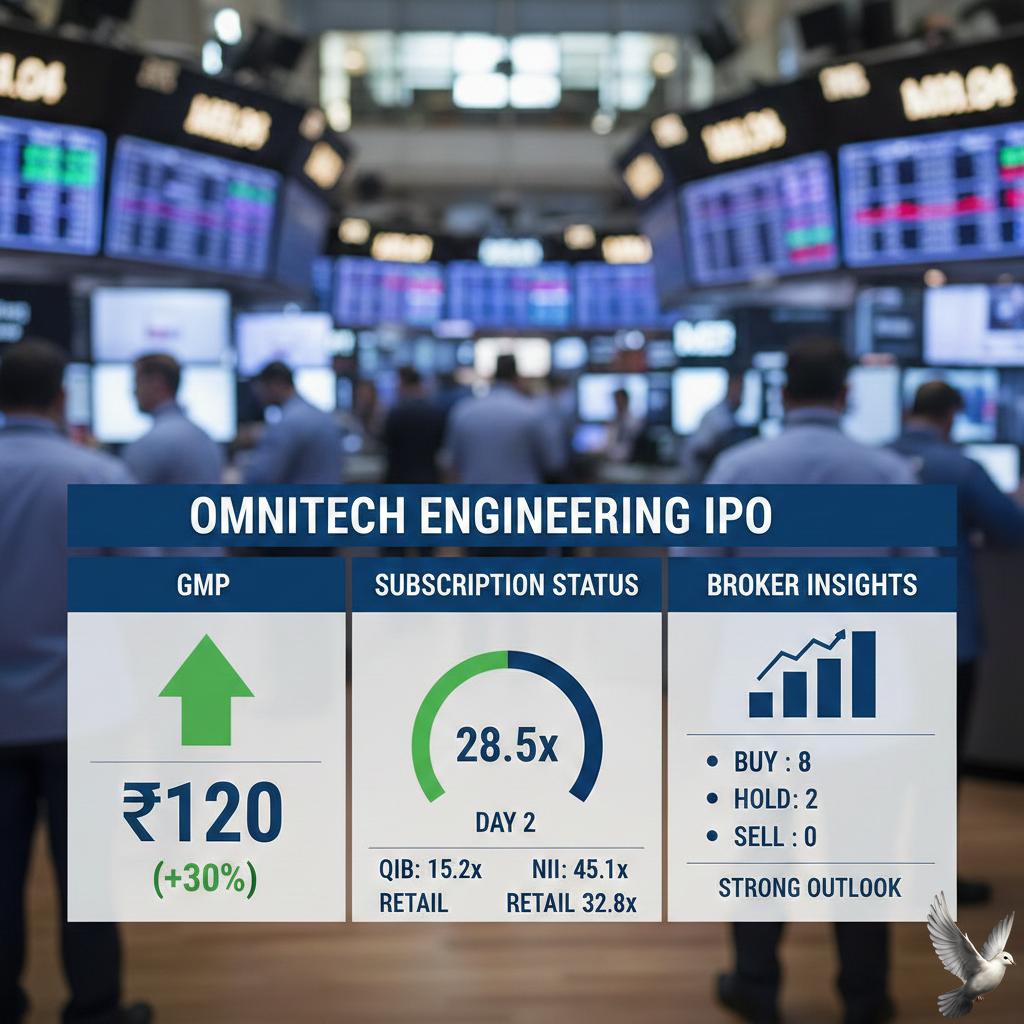
Omnitech Engineering IPO: GMP, Subscription Status, and Broker Insights
Omnitech Engineering Limited is finalizing its ₹583 crore Initial Public Offering as the subscription window closes today, February 27, 2026. The issue has met with a measured response from the broader market, characterized by cautious optimism and steady, if not explosive, demand across various investor categories. The IPO consists of a fresh issue of 1.84 crore shares valued at ₹418 crore and an offer for sale totaling ₹165 crore. Priced within a band of ₹216 to ₹227 per share, the company has positioned itself as a growth-oriented player in the high-precision engineering sector. Grey market activity reflects this tempered sentiment. The current Grey Market Premium (GMP) is hovering around ₹3 to ₹7, suggesting a potential listing price near ₹230 to ₹234. This indicates a modest listing gain of approximately 2% to 3% above the upper price band, provided market conditions remain stable through the debut on March 5, 2026. Subscription data as of the final bidding day shows the issue has been subscribed approximately 0.13 to 0.15 times overall. Retail investors and Qualified Institutional Buyers (QIBs) have shown similar levels of interest, each hovering around 13% of their respective quotas. Notably, the employee segment has demonstrated significant internal confidence, with an oversubscription of 2.59 times. Financially, Omnitech has reported a robust revenue surge, climbing 92% to ₹349.71 crore in FY25 compared to ₹181.95 crore in the previous fiscal year. Net profit also witnessed a substantial rise to ₹43.87 crore. The company maintains healthy EBITDA margins of over 33%, though its debt-to-equity ratio of 1.62 remains a point of observation for analysts. The precision engineering market in India is currently valued at approximately $7.1 billion and is projected to reach $11.1 billion by 2028. This growth is driven by a 11.5% CAGR as the industry shifts toward automation and advanced manufacturing under the "Make in India" initiative. Proceeds from the fresh issue are earmarked for strategic expansion. Specifically, ₹132 crore and ₹100 crore are allocated for setting up two new manufacturing facilities in Gujarat, while approximately ₹50 crore will be utilized for debt repayment. Additional funds will support solar panel installation and general corporate requirements. Final allotment of shares is expected to be completed by March 2, 2026, with the official listing on the BSE and NSE scheduled for March 5, 2026. Investors are now focused on the post-listing performance of the company as it scales its operations in the global energy, motion control, and automation markets.
Vishal Mega Mart Shares Eyed Amid Reported 6.5% Block Deal Stake Sale by Promoter
Vishal Mega Mart is drawing significant market attention as promoter Samayat Services LLP, a special-purpose vehicle for Kedaara Capital and Partners Group, executes a major stake sale. The promoter is offloading a 6.5% stake, equivalent to approximately 30.5 crore shares, through a block deal valued at nearly 3,508 crore. The floor price for this transaction is set at 115 per share, representing a 9.8% discount to the previous closing price. This move follows a larger divestment in June last year and includes a 150-day lock-in period for the promoter’s remaining 54.09% equity. The stock has shown resilience despite the deal, recently trading around 127.53. It has gained 6.48% so far in 2026 and over 23% in the last 12 months. Trading volumes have surged, reaching 2.9 crore shares in a single session, significantly outperforming the broader retail sector. Financial performance for Q3 FY26 highlights a strong growth trajectory. The company reported a 19.1% year-on-year increase in net profit, reaching 312.9 crore. Revenue from operations climbed 17% to 3,670 crore, fueled by robust festive demand and a steady expansion of the retail network. Operational efficiency remains a core strength. EBITDA rose 20% to 605.4 crore, with margins expanding to 16.5% from 16.1% a year ago. Adjusted same-store sales growth (SSSG) stood at 9.6%, even after accounting for a shift in the festive calendar. Expansion continues at a rapid pace. Vishal Mega Mart added 29 new stores in the third quarter alone, bringing the total for the first nine months of the fiscal year to 80. The company is on track to hit its annual target of 100 new stores, focusing on high-growth regions like Kerala, Gujarat, and Maharashtra. The company is also scaling its digital and private-label presence. Own-brand products now contribute 74.5% of total revenue, while quick commerce services have expanded to 723 stores across 485 cities, serving 12 million registered users. This strategy of "affordable aspirations" has successfully driven premiumization, with higher-priced fashion segments growing at 14%. Market sentiment remains largely positive, with 13 out of 15 analysts maintaining a "buy" rating. Analysts point to the company’s conservative balance sheet—carrying zero long-term debt—and its ability to convert top-line growth into consistent bottom-line results as key drivers for long-term value.

IDFC First Bank and Four Other Stocks Exhibit Bullish Indicators
Market dynamics shifted noticeably on February 26, as technical scanners highlighted five prominent Nifty 500 stocks displaying the "White Marubozu" candlestick pattern. This rare formation occurs when a stock opens at its intraday low and closes at its peak, signaling that buyers remained in absolute control throughout the entire trading session. IDFC First Bank emerged as a key participant in this bullish trend. The bank closed at 72.80, reflecting a steady 3.69% gain. This movement aligns with a broader recovery in the private banking space, where high-growth institutions are seeing renewed interest. The bank currently maintains a market capitalization of 62,611 crore and has delivered a consistent five-year profit growth of 20.3%. Broader market indices reflected a more complex environment during the same period. While technical breakouts occurred in specific names, the Nifty 50 traded with caution, finishing near the 22,545 level. The Nifty 500 index, however, showed pockets of outperformance, particularly within the financial and metal sectors. In the banking segment, HDFC Bank also saw gains, rising 1.06% to settle at 1,700.15. Sectoral performance was highly divided. Banking and financial services were the primary drivers of stability, supported by recent regulatory adjustments concerning risk weights for NBFC lending. In contrast, the Nifty Auto index struggled, dropping 1.8% due to global trade concerns. Infrastructure and utility stocks like UltraTech Cement faced selling pressure, with the cement giant falling 5% to 10,330.60. Technical analysts view the emergence of the White Marubozu in these five stocks as a strong signal of sustained upward momentum. When such a pattern appears in high-volume Nifty 500 constituents, it often suggests that institutional accumulation is outweighing retail distribution. Aside from IDFC First Bank, other stocks identifying with bullish setups include Lloyds Metals & Energy, which closed significantly higher at 1,251.80, a 7.53% jump. Investors are currently navigating a market characterized by selective buying. Despite a flat close for the major benchmarks, the advance-decline ratio remains a critical indicator. On the latest trading day, 414 stocks advanced while 2,181 declined across the National Stock Exchange, indicating that while specific stocks like IDFC First Bank are showing strength, the wider market remains under localized pressure. Economic indicators provide a supportive backdrop for the financial sector. With credit growth remaining robust and net interest margins stabilizing for new-age private banks, the technical breakout in the Nifty 500 pack may reflect improving fundamental expectations for the upcoming fiscal quarter. Current volatility remains low, but the concentration of buying in specific technical patterns suggests a shift toward quality momentum plays.
Tejas Networks and Four Other Stocks Exhibit Bullish RSI Trends
Market Brief: Nifty 500 Momentum Play The **Nifty 500** index demonstrated resilience toward the end of February 2026, closing at **23,448.50**. Despite broader market volatility and flat performance in major benchmarks like the Sensex, a select group of stocks has emerged with strong bullish momentum. Technical scans identify a "Trending Up" pattern where the **Relative Strength Index (RSI)** has crossed above the **50** mark. This shift typically indicates that buying pressure is outweighing selling interest, potentially marking the start of a sustained uptrend. KSB Limited The industrial pump manufacturer surged **12%** in late February, hitting an eight-week high of **₹806**. The rally follows a robust quarterly report showing a **10.8%** year-on-year increase in net profit to **₹81 crore**. Operating efficiency improved significantly, with EBITDA margins expanding to **16.6%**. The company also announced a final dividend of **₹4.40** per share, further boosting investor confidence. Tejas Networks Shares of the telecom equipment maker jumped over **16%** in a single session, reaching **₹371.05**. The primary driver was a strategic international contract with NEC Corporation to supply **5G Massive MIMO** radios. This collaboration aligns with global 5G infrastructure expansion. The stock’s RSI has surged as it moves away from its 52-week low of **₹294**, reflecting renewed accumulation by market participants. Vishal Mega Mart The retail giant outperformed its sector by more than **4%** during recent sessions. The stock hit an intraday peak of **₹129.50** amid an exceptional volume surge of **2.90 crore** shares. Currently trading above its **5-day and 20-day moving averages**, the stock shows strong short-term bullishness. Delivery volumes have increased by over **40%** compared to the 5-day average, suggesting a shift from speculative trading to long-term holding. IFCI Limited This term-lending institution saw its share price rise to **₹60.18**, gaining approximately **3.1%** in recent trade. The stock has maintained a positive trajectory with monthly returns near **6.8%**. A key technical trigger was the **20-day moving average crossover**, a signal that has historically preceded price gains for this counter. While the company reported a recent quarterly loss, the market is focusing on its high beta and long-term recovery potential. Aadhar Housing Finance The low-income housing financier gained **3.51%** to close at **₹473.85**. While it has faced year-to-date pressure, its one-year return of **25.16%** remains more than double the benchmark Sensex’s performance. The stock is currently in a consolidation phase. Analysts maintain a **"Strong Buy"** consensus, with price targets ranging between **₹525** and **₹600**, supported by a **5.5%** growth in quarterly profit after tax.

Gold Prices Stable Amid Ongoing US-Iran Negotiations
Market Brief: Gold and Macroeconomic Outlook Gold prices are demonstrating significant resilience, maintaining a robust upward trajectory despite minor daily fluctuations. Market activity in late February 2026 shows bullion holding near record levels, specifically consolidating around the **$5,185** mark for spot gold. In domestic futures, prices reached a fresh monthly high of **₹162,050** per 10 grams before experiencing a slight technical pullback. Geopolitical Drivers and Nuclear Negotiations The primary catalyst for price action remains the high-stakes diplomacy in Geneva. U.S. and Iranian officials have concluded a third round of nuclear talks without a definitive agreement. While mediators noted "significant progress," the lack of a final deal—combined with the buildup of naval assets in the region—has sustained a persistent "fear premium" in precious metals. Geopolitical tensions are further amplified by fresh regional conflicts, notably border clashes between Pakistan and Afghanistan. These events have reinforced gold’s status as a primary safe-haven asset, as investors hedge against the risk of broader military escalation. Currency and Labor Market Dynamics The U.S. Dollar Index (DXY) has shown modest strength, trading near **97.60**. This recovery was supported by the latest labor data, which indicated that the U.S. job market remains unexpectedly firm. * **Initial Jobless Claims:** Rose to **212,000** for the week ending February 21. * **Market Impact:** This figure was lower than the **216,000** predicted by economists. * **Labor Sentiment:** The modest increase suggests that while hiring has slowed, widespread layoffs have not yet materialized. The relative strength of the dollar usually creates a headwind for gold, but the current environment of trade uncertainty and tariff jitters has neutralized this traditional inverse relationship. Federal Reserve and Interest Rate Path Investors are currently navigating a "wait-and-see" period regarding monetary policy. There is no Federal Reserve meeting scheduled for February, leaving the market focused on the upcoming **March 17–18** FOMC session. Current expectations suggest the Fed will hold interest rates steady in the **3.50% to 3.75%** range. While earlier forecasts anticipated more aggressive cuts, steady economic growth and a "hotter" PCE inflation print of **3.0%** have tempered those outlooks. Traders are now pricing in a slower pace of easing, with the next potential rate reduction likely delayed until the second quarter of the year. Technical Outlook and Support Levels Gold's technical structure remains bullish on the weekly charts. Analysts identify **$5,150** as a critical resistance level; a sustained close above this point could open the path toward **$5,450**. On the downside, the **$5,000** psychological floor is the primary pivot point. As long as prices hold above this level, the short-term trend is considered constructive. Domestic support in India is firmly established around the **₹156,000** level for 24K gold, supported by steady physical demand during the current wedding season.

Australian Dollar Appreciates and Yen Weakens Amid Diverging Interest Rate Expectations in February
Global Currency Market Brief: Shifting Policy Winds The global currency landscape has entered a new phase of divergence. Investors are pivoting away from the universal expectation of rate cuts, focusing instead on which central banks will be forced to resume hiking cycles to combat sticky inflation. Australian Dollar Performance The Australian dollar (AUD) is currently one of the strongest performers in the G10 space. As of late February 2026, the AUD/USD pair has stabilized around **0.71**, marking a significant recovery from 2025 averages of **0.64**. This **10%** appreciation is fueled by a "hawkish tilt" from the Reserve Bank of Australia (RBA). Recent data showed January inflation hitting **3.8%**, exceeding market forecasts. The RBA’s cash rate currently stands at **3.85%**, and markets are pricing in a **76%** probability of a further hike to **4.10%** by May 2026. This positive carry advantage is drawing significant capital inflows into the Aussie dollar. Japanese Yen Volatility In contrast, the Japanese yen (JPY) has faced intense downward pressure, recently sliding to roughly **157 per dollar**. While the Bank of Japan (BoJ) remains technically on a tightening path—with the policy rate currently at **0.75%**—political friction has clouded the outlook. Prime Minister Sanae Takaichi recently voiced public concerns regarding further rate increases, triggering a sharp yen sell-off. Despite this, BoJ Governor Kazuo Ueda has maintained a hawkish stance, signaling that rates could reach **1.5%** by late 2026 if inflation stays above the **2%** target. The AUD/JPY cross has surged to approximately **111**, reflecting the widening policy gap between the two nations. Shifting Global Benchmarks The era of synchronized central bank movement is over. The US Federal Reserve is expected to reduce rates twice in 2026, targeting a terminal rate of **3.25%**, while the European Central Bank (ECB) signals a prolonged hold at **2.0%**. * **US Dollar Index (DXY):** Trading near **103.42**, showing resilience despite looming cuts. * **British Pound (GBP):** Hovering around **1.35**, facing pressure as the Bank of England considers a March cut to **3.5%**. * **Gold (XAU):** Surged to **$5,174**, supported by geopolitical tensions and a softening US dollar. Economic momentum is now the primary driver of currency valuations. Markets are rewarding currencies backed by resilient growth and proactive central banks, while punishing those mired in political uncertainty or weakening labor data. This shift underscores a return to relative yield differentials as the dominant force in the forex market.

Acetech E-Commerce IPO: Key Details and Market Status
Acetech E-Commerce has officially launched its Initial Public Offering today, February 27, 2026, marking a significant entry into the NSE SME segment. The issue is priced between 106 and 112 per share, with the subscription window remaining open until March 4, 2026. The company aims to raise approximately 48.95 crore through a 100% fresh issue of 43.70 lakh shares. The funds are earmarked for critical growth drivers, including 1.70 crore for brand building and digital marketing, 7.00 crore for working capital, and a substantial 37.30 crore for strategic inorganic acquisitions. Operating in the high-growth dropshipping and teleshopping sectors, Acetech has built an asset-light model that leverages global fulfillment networks. Its financial performance shows strong momentum, with FY25 revenue reaching 70.41 crore, a 17% increase year-on-year. Net profit for the same period stood at 6.88 crore, reflecting a healthy 9.79% margin. The broader Indian e-commerce market is currently valued at approximately 12.50 lakh crore and is projected to scale to 34.50 lakh crore by 2030. Within this space, niche segments like Ayurvedic wellness and eco-friendly homecare—where Acetech operates through brands like Motherveda and The Good Planet—are seeing double-digit growth. Investor sentiment in the SME sector has turned selective in early 2026. While the grey market premium for this issue has remained flat at 0% during the pre-opening phase, the company’s high Return on Net Worth of 73.75% and its price-to-earnings ratio of 21.2x suggest a competitive valuation compared to the industry average of 30x. The minimum investment for retail participants is set at 2,68,800 for a lot of 2,400 shares. Following the close of the bidding process, the basis of allotment is expected on March 5, with the official debut on the NSE Emerge platform scheduled for March 9, 2026.

Gaudium IVF IPO Listing Today: Gray Market Premium and Market Debut Expectations
Gaudium IVF and Women Health officially enters the Indian stock market today, February 27, 2025. The company is debuting on the BSE and NSE following a successful subscription period that highlighted significant interest from specific investor segments. The listing price is expected to be closely aligned with the upper end of the price band at 79 rupees. Current grey market trends indicate a flat premium, suggesting a stable or muted opening for the shares on their first day of trading. The initial public offering raised a total of 165 crore rupees. This was achieved through a fresh issue of equity valued at 90 crore rupees and an offer for sale totaling 75 crore rupees. The price band for the issue was set between 75 and 79 rupees per share. Investor demand was notable, with the total issue being subscribed 7.27 times. The Non-Institutional Investors (NII) category led the demand with a 14.05 times subscription. Retail investors also showed healthy interest, oversubscribing their portion by 7.60 times, while Qualified Institutional Buyers (QIB) subscribed 1.62 times. Financially, the company has shown consistent growth. In the fiscal year 2025, Gaudium IVF reported a total income of 70.96 crore rupees and a profit after tax of 19.13 crore rupees. The company maintains a strong EBITDA margin of approximately 40.48 percent. The capital raised from the fresh issue is earmarked for strategic growth. Specifically, 50 crore rupees will be used to establish 19 new IVF centers across India. Another 20 crore rupees will be directed toward the repayment or prepayment of existing loans to strengthen the balance sheet. Gaudium IVF operates through a hub-and-spoke model, currently managing over 30 locations, including 7 hubs and 28 spokes. The expansion plan aims to tap into the rising demand for fertility services and medical tourism in India, serving both domestic patients and international clients from the UK, USA, and Africa. The stock will initially be traded in the Trade-for-Trade segment for the first 10 days to manage volatility. Market participants are watching the opening session for signs of long-term stability in the fertility healthcare sector.