Bullish News
Collection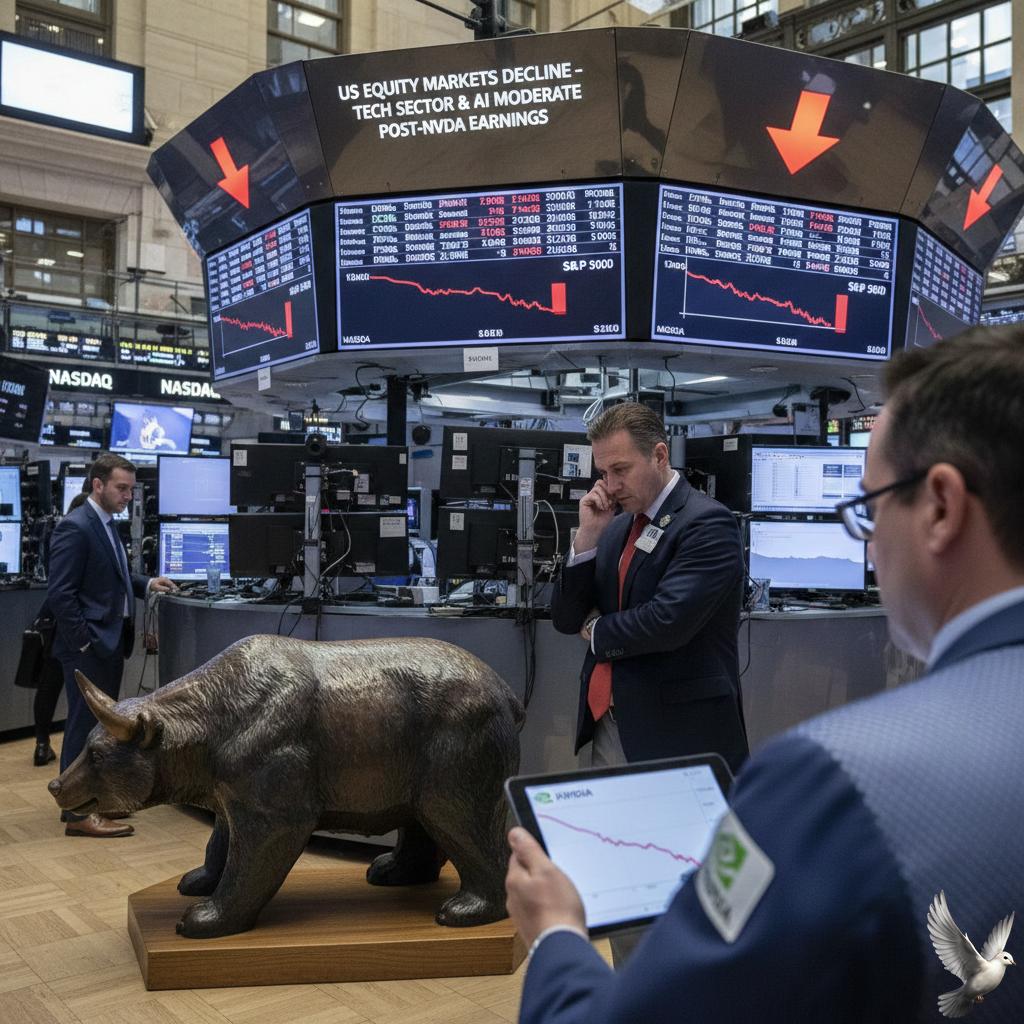
US Equity Markets Decline as Technology Sector and AI Momentum Moderate Following Nvidia Earnings
U.S. equity markets experienced significant volatility on Thursday, February 26, 2026, as a sharp tech selloff overshadowed record-breaking financial results from industry bellwether Nvidia. While the Dow Jones Industrial Average managed a fractional gain of **0.03%** to close at **49,499.20**, the broader market struggled under the weight of profit-taking in the semiconductor sector. The tech-heavy Nasdaq Composite bore the brunt of the decline, falling **1.18%** to finish at **22,878.38**. This downward pressure was mirrored in the S&P 500, which slipped **0.54%** to end the session at **6,908.86**. Nvidia’s fourth-quarter earnings report, released late Wednesday, surpassed expectations with record revenue of **$68.1 billion**—a **73%** increase year-over-year. Despite guiding for **$78 billion** in the upcoming quarter, the stock tumbled **5.5%** on Thursday. Analysts noted that the "pump-and-dump" price action reflected exhaustion among investors who had already priced in a perfect result. The Philadelphia SE Semiconductor Index (SOX) dropped significantly, threatening to snap an **11-week** winning streak. This retreat highlights growing skepticism regarding the long-term return on investment for artificial intelligence. While hyperscalers are projected to spend over **$500 billion** on AI infrastructure in 2026, concerns about a potential "AI bubble" are driving rotation into defensive and cyclical sectors. The software sector also faced headwinds, with Salesforce falling **3.5%** following a conservative revenue outlook. Volatility has been exacerbated by the high costs of maintaining AI models and fears that automation may disrupt traditional software seat demand. Market participants are increasingly focused on how sustained infrastructure demand will translate into tangible corporate productivity gains. Trading volume reached **351 million** shares for Nvidia alone, more than double its three-month average. While the majority of S&P 500 constituents actually traded higher, the sheer market capitalization of the declining tech giants pulled the major indices lower. Looking ahead, the market remains rangebound as it approaches the end of February. Traders are closely monitoring a widening gap between record earnings and stock price sustainability, particularly as the VIX volatility index climbed nearly **4%** to **18.63** during the session.

Indian Markets Head for Lower Open Amid Weak Global Cues
Global Market Brief: February 27, 2026 Global equity markets are showing a distinct split as February concludes. While the **S&P 500** remains supported by a robust profit outlook, Asian indices have retreated from recent record highs. Investor sentiment is navigating a complex landscape of shifting tech earnings and persistent geopolitical negotiations. The **S&P 500** currently trades near **6,908**, down slightly by **0.54%** in recent sessions. Despite the dip, analysts remain positive for 2026, citing double-digit growth forecasts. This optimism is fueled by aggregate earnings per share in the tech sector growing by approximately **25%** over the past year. Tech and Innovation Drivers The technology sector continues to be the primary engine of market activity, though volatility has increased. **Nvidia** shares recently saw a **5.55%** correction, trading at **$184.71**, as the market recalibrates after a historic run. In contrast, companies like **Block Inc.** surged over **20%** in after-hours trading following a strategic pivot toward infrastructure automation. Hardware providers like **Dell** are also benefiting from a shift toward "inference" computing, with shares outperforming broader benchmarks. Commodities and Digital Assets Gold and silver have stabilized after recent price swings. **Spot Gold** is currently trading at **$5,182.66** per ounce, a marginal daily gain of **0.35%**. **Silver** has settled near **$88.03**, recovering from a period of high volatility earlier in the month. **Bitcoin** is attempting a recovery after a significant January sell-off. The leading digital asset is currently testing the **$70,238** resistance level. Analysts suggest a close above this mark is required to sustain the current upward momentum, with immediate support resting at **$62,795**. Central Bank Policy and Rates The **U.S. Federal Reserve** held interest rates steady in the range of **3.5% to 3.75%** at its latest meeting. Market expectations for a rate cut in March have cooled, though one reduction is still anticipated later in 2026. This steady rate environment has allowed the **30-year fixed mortgage rate** to slip below **6%** for the first time since late 2022, currently averaging **5.98%**. The **10-year Treasury yield** sits at **4.02%**, reflecting a cautious but stable bond market. Energy and Macro Indicators Oil prices are trending lower as international tensions ease. **Crude Oil** is trading at **$65.45**, while **Brent** is at **$70.87**. This decline follows extended diplomatic talks between the U.S. and Iran, which have reduced concerns over supply disruptions in the Middle East. Global inflation is projected to reach **2.8%** by the end of 2026. However, a divergence is appearing between regions: **U.S. inflation** is expected to stay elevated at **3.2%**, while **Euro area** inflation is moderating toward **1.9%**. This gap is likely to drive different monetary policy paths for central banks in the coming months.

12 stocks cross 200-day moving average
Market Overview: Trend Analysis and Benchmarks The **S&P 500** continues to serve as the primary barometer for long-term market health. As of late February **2026**, the index remains positioned above its **200-day Simple Moving Average (SMA)**, a technical threshold traditionally used to distinguish broad uptrends from bearish cycles. Currently, the **S&P 500** is trading near **6,908**, maintaining a buffer over its **200-day SMA** situated at **6,548**. This placement confirms that despite recent short-term volatility and a retreat from the **7,000** psychological barrier, the macro-directional bias for equities remains positive. Technical Momentum and Participation While the long-term trend is intact, short-term momentum has faced headwinds. The index recently slipped below its **50-day SMA** of **6,896** following a **1.16%** decline in late February sessions. This suggests a period of consolidation or "sideways" movement within a range of **6,700** to **7,000**. Market breadth remains moderate. Approximately **64.8%** of the **S&P 500** constituents are trading above their own **200-day SMA**. This indicates that the uptrend is supported by a majority of stocks, though participation has eased slightly from the highs seen in January. Sector Performance and Economic Drivers Sector divergence is a defining theme for **2026**. The technology sector, which surged **15.7%** year-to-date, recently encountered selling pressure. High-profile semiconductor and software leaders saw declines, such as a **5.5%** drop in major chipmakers, as investors re-evaluated valuation premiums. In contrast, cyclical sectors and commodities have shown resilience. **WTI Crude Oil** is trading near **$65.45**, reversing its previous bearish trend by crossing above its own **200-day SMA**. Gold also remains in a clear uptrend, holding levels above **$5,180**, well clear of its long-term moving average. Economic Indicators The broader economic backdrop remains supportive of the current equity trend. **U.S. GDP** grew by **1.3%** in **2025**, with a **1.4%** growth forecast for **2026**. Although inflation remains a focus at **3.0%**, it has retreated significantly from prior peaks, allowing for a more stable interest rate environment. Global growth is projected at **3.3%** for **2026**, bolstered by continued investment in infrastructure and technology. As long as the **S&P 500** stays above the **200-day SMA** of **6,548**, the technical outlook suggests that pullbacks are likely to be viewed by participants as consolidation rather than a trend reversal.

Manilam Industries India IPO: GMP Signals and Listing Outlook
Manilam Industries is scheduled to make its market debut on the NSE SME platform today, February 27, 2026. The initial public offering, which closed on February 24, saw an overall subscription of 6.25 times. Investor interest was led by Non-Institutional Investors (NIIs), who subscribed 12.49 times their allotted portion. Retail individual investors followed with a subscription of 5.88 times, while the Qualified Institutional Buyers (QIB) segment recorded 2.24 times coverage. The IPO was priced at the upper end of its 65 to 69 INR price band. The company raised a total of 39.95 crore INR through this issue. This capital is earmarked for strategic operational upgrades, including 1.25 crore INR for new equipment and 2.20 crore INR for the installation of solar panels at its manufacturing facility. Additionally, 3.50 crore INR will be used for loan repayments, while 16.65 crore INR is allocated to bolster working capital. Financial performance has shown significant growth leading up to the listing. In the 2025 fiscal year, Manilam reported a total income of 142.16 crore INR, yielding a profit after tax of 7.38 crore INR. This marks a sharp increase from the 3.10 crore INR profit recorded in 2024. The company's EBITDA stood at 17.75 crore INR with a healthy margin of 12.67%. Market sentiment for the debut remains neutral, with the grey market premium (GMP) holding at 0 INR as of the listing morning. This suggests the stock may open near its issue price of 69 INR. The listing comes at a time when the broader SME IPO market is experiencing a reset; in 2026, roughly 60% of new listings have traded below their issue price, with average listing gains cooling to approximately 8%. The Indian decorative laminates sector continues to expand, currently valued at approximately 8.88 billion USD. Trends indicate a shift toward premium, eco-friendly products and digital design customization. Manilam operates a 20,650 square meter plant in Bareilly and maintains experience centers in Bangalore, Delhi, and Chennai to capture this growing demand in the B2B segment.

PNGS Gargi Fashion Jewellery IPO: Allotment Status, GMP, and Listing Details
**MARKET BRIEF: PNGS REVA DIAMOND JEWELLERY IPO & SECTOR UPDATE** **IPO Allotment and Listing Timeline** The ₹380 crore IPO of PNGS Reva Diamond Jewellery concludes its primary market phase today, February 27, 2026, with the finalization of share allotment. Investors can check their status through the registrar, Bigshare Services. Unsuccessful bidders will see refund initiations on March 2, while credited shares will appear in demat accounts the same day. The official listing on the BSE and NSE is scheduled for March 4, 2026. **Subscription Performance** The public issue closed with a moderate overall subscription of 1.23 times. Strongest demand came from Non-Institutional Investors (NII) at 1.54 times, followed by Retail Individual Investors at 1.37 times. Qualified Institutional Buyers (QIB) showed a more cautious interest, subscribing 1.04 times. Ahead of the public launch, the company secured ₹170.58 crore from anchor investors, reinforcing institutional backing despite the quiet retail response. **Grey Market and Listing Sentiment** Current grey market activity suggests a neutral to cautious opening. The Grey Market Premium (GMP) has fluctuated between ₹9 and ₹17 per share over the bidding period but recently turned flat, with some reports even indicating a marginal negative premium of -₹1. At a price band of ₹367 to ₹386, the market is bracing for a potential listing near the issue price, offering limited immediate gains for short-term flippers. **Financial and Operational Profile** PNGS Reva operates 34 stores across Maharashtra, Gujarat, and Karnataka, specializing in diamond and gemstone-studded jewellery. The company reported a robust 32% year-on-year revenue growth in FY25, reaching ₹258.2 crore with a Profit After Tax (PAT) of ₹59.5 crore. However, recent H1 FY26 data shows a dip in margins to 12.8% due to inventory expansion and store launch costs. The IPO proceeds are primarily earmarked for the rollout of 15 new brand-exclusive stores to reduce its 90% revenue dependency on Maharashtra. **Gold and Market Context** The jewellery sector faces a backdrop of record-high precious metal prices. As of February 26, 24K gold is trading near ₹16,168 per gram, while 22K gold stands at ₹14,820 per gram. This price volatility, combined with rising competition from lab-grown diamonds, remains a key risk factor for retailers. In the broader market, the Nifty Consumer Durables index remains stable at approximately 37,520, reflecting a wait-and-watch approach by investors in the high-ticket retail segment.

Pre-Market Trading Analysis and Session Outlook
Market Brief: Domestic Resilience Amid Range-Bound Volatility The Indian equity markets continue to exhibit a range-bound character as February 2026 draws to a close. Technical indicators suggest a period of consolidation, with the **Relative Strength Index (RSI)** softening toward **48**, reflecting a mild bearish pressure in the immediate term. Market participants are currently navigating a high-volatility environment, with the **India VIX** hovering around **13.06 to 14.35**. While global cues remain mixed, domestic institutional investors (DIIs) have provided a crucial cushion, recently injecting over **5,032 crore** in a single session to offset persistent foreign portfolio investor (FPI) selling. Index Levels and Technical Floors The **Nifty 50** is currently oscillating near the **25,496** mark. Technical analysts have identified a crucial structural base at **25,380 – 25,350**, which aligns with the 200-day moving average. On the higher side, a significant hurdle persists at **25,650 – 25,700**. A decisive move above this resistance is required to trigger fresh momentum. The **BSE Sensex** remains steady near **82,248**, having seen a narrow trading range in recent sessions. Support for the blue-chip index is firmly established near the **81,970** level, while resistance is capped at **82,600**. Sectoral Focus: The Domestic Pivot Investment strategies are increasingly pivoting toward domestic-facing sectors that offer clearer demand visibility. **PSU Banks** continue to lead the charge, with the **Nifty PSU Bank Index** recording weekly gains of over **5.4%**. Strength in this sector is supported by stable credit growth and improving asset quality, highlighted by major players like **Canara Bank** raising **5,000 crore** via Tier-II bonds at a **7.24%** coupon. **Healthcare and Pharma** have emerged as strong defensive plays. The **Nifty Pharma** index has shown resilience, with key stocks like **Dr. Reddy’s** and **Aurobindo Pharma** gaining traction as investors seek earnings stability. **Automobiles and Capital Goods** remain in focus due to domestic infrastructure tailwinds. Despite component inflation—specifically a **55% to 64%** rise in mobile DRAM prices affecting tech-heavy segments—the broader industrial and auto sectors are benefiting from a projected **7.4%** real GDP growth rate for the **2025-26** fiscal year. Macroeconomic Indicators The broader economic backdrop remains supportive of long-term stability. Under the new **2024 base year** series, retail inflation (**CPI**) was recorded at **2.75%** for January, comfortably within the central bank's target band. The **Reserve Bank of India (RBI)** has maintained the repo rate at **5.25%**, signaling a neutral stance. Meanwhile, the Indian rupee has remained relatively flat, trading near **90.91** against the US dollar. Commodity markets are seeing localized action, with **MCX Gold** trading near **1,58,740 per 10 grams**, while **Brent Crude** has eased slightly to approximately **70.40 per barrel** on hopes of diplomatic progress in international talks.

Market Watch: Bharti Airtel, BPCL, Indian Oil, Bandhan Bank, and Vishal Mega Mart in Focus
**Market Pulse: Range-Bound Action and Strategic Shifts** Indian equity markets witnessed a volatile session on Thursday, February 26, 2026, eventually ending with minimal changes. The BSE Sensex closed at 82,248, down just 27 points, while the Nifty 50 finished marginally higher by 14 points at 25,496. Investors remained cautious ahead of key GDP data releases and shifting global cues. Despite intraday pressure, sectors such as healthcare, PSU banks, and select auto stocks like Tata Motors provided support, counteracting losses in the heavyweight financial space. **Vishal Mega Mart: Major Block Deal Imminent** The retail sector is in focus as Samayat Services LLP, the promoter entity of Vishal Mega Mart, prepares to offload a 6.5% stake. The planned sale involves 30.5 crore shares with a floor price set at 115 INR per share. This price represents a 10% discount from the recent closing price of 127.53 INR. The deal is valued at approximately 3,508 crore INR and includes a 150-day lock-in period for the remaining promoter holding. **Bharti Airtel: Scaling the NBFC Horizon** Bharti Airtel is positioning its NBFC arm, Airtel Money, as a primary growth engine. The company plans to infuse 20,000 crore INR into the subsidiary over the next few years to scale digital lending operations. Bharti Airtel will contribute 70% of this capital, with the remainder coming from the promoter group. The move leverages the company’s vast database and 500+ data scientists to target India’s underserved credit market. **Bandhan Bank: Regulatory Green Light** In the banking sector, Bandhan Bank shares rose nearly 2% following a significant regulatory update. The Reserve Bank of India has granted approval for SBI Mutual Fund to acquire an aggregate holding of up to 9.99% in the lender. The approval is valid for one year and requires SBI Mutual Fund to maintain its stake within the stipulated 9.99% ceiling. This strategic investment is seen as a vote of confidence in the bank’s long-term stability and growth prospects. **Global Indicators and Commodities** Global markets showed a mixed performance as tech stocks recovered following strong results from major US chipmakers. Locally, the Indian Rupee remained steady, closing at 90.90 against the US Dollar. In the energy market, Brent crude prices hovered around 70.93 USD per barrel. Gold prices on the MCX saw a slight cooling trend, trading near 159,700 INR per 10 grams for the latest contract.
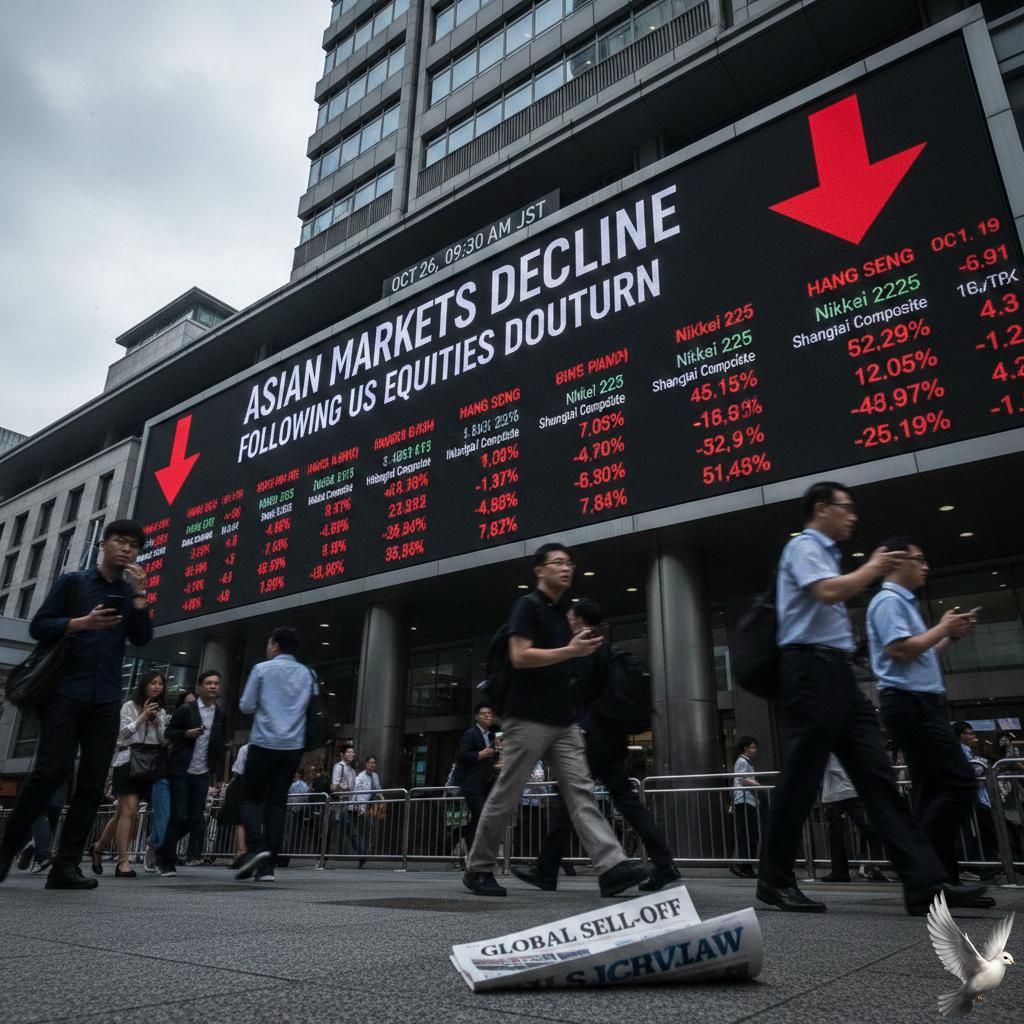
Asian Markets Decline Following Downturn in US Equities
Asia Market Brief: AI Resilience Amid Global Volatility Asian equity markets are demonstrating significant structural strength, consistently outperforming global peers in the first quarter of **2026**. While Wall Street has grappled with high valuations and a "scare trade" driven by concerns over AI monetization, the Asia-Pacific region has emerged as a preferred destination for global capital rotation. AI Supply Chain Dominance Investors are increasingly viewing Asian chipmakers as the essential "picks and shovels" of the artificial intelligence era. Unlike the software-centric volatility seen in the U.S., Asia controls the physical choke points of the industry. * **South Korea’s KOSPI** surged **3.7%** recently, hitting new record highs above the **6,200** mark. * **Samsung Electronics** and **SK Hynix** both reached all-time high valuations, driven by a projected **79%** jump in aggregate earnings for South Korean benchmarks this year. * **Taiwan’s Taiex** remains a top global performer, with **TSMC** maintaining a dominant **12.4%** weight in regional indices as it scales next-generation production. Nvidia’s Impact and Sector Performance Nvidia’s latest fiscal report acted as a fundamental anchor for the region. The company reported fourth-quarter revenue of **$68.1 billion**, a **73%** year-over-year increase. Despite a muted immediate reaction in New York, the results reinforced confidence in Asian hardware providers. * **Japan’s Nikkei 225** crossed the historic **59,000** threshold for the first time in February. * **SoftBank Group** saw gains of **3.5%** as its AI-focused portfolio attracts renewed interest. * **MSCI Asia Pacific Index** has climbed roughly **13%** year-to-date, far outstripping the **2%** gain seen in the Nasdaq 100. Regional Trends and Economic Shifts The broader market landscape is being shaped by supportive domestic policies and shifting interest rate expectations. In Japan, the nomination of dovish central bank members has cooled fears of aggressive rate hikes, keeping the Yen near **155 per Dollar** and supporting exporters. * **Hong Kong’s Hang Seng** remains resilient near **26,600**, though it faces occasional profit-taking after a **28%** surge in the prior year. * **China’s** tech sector is showing signs of a "catch-up" rally, with expectations of **20%** gains as domestic AI models begin to compete on global benchmarks. * **India’s Sensex** continues its steady climb, trading **0.3%** higher as it benefits from the regional shift toward hardware and infrastructure. The global semiconductor industry is on track to hit **$1 trillion** in sales by the end of **2026**. With Asian firms positioned at the center of this **$500 billion** generative AI chip market, the region’s valuation discount—currently trading at **15 times** forward earnings versus **22 times** for the S&P 500—presents a compelling narrative for sustained outperformance.

SEBI Mandates Disclosure of Identification Details in Social Media Posts by Market Participants
The Securities and Exchange Board of India (Sebi) has finalized new transparency mandates for all market intermediaries and their agents. Effective May 1, 2026, regulated entities must prominently display their registered name and Sebi registration number on all social media platforms. This directive covers a wide range of participants, including stock brokers, mutual funds, research analysts, investment advisers, and portfolio managers. The rule applies to content shared across major platforms such as WhatsApp, Telegram, Instagram, X (formerly Twitter), and LinkedIn. For entities with a single registration, these details must appear on their profile homepage and at the start of every post or video. Entities holding multiple registrations are required to provide a dedicated web link on their profile that lists all their credentials. This regulatory tightening arrives as the Indian equity markets show steady resilience. As of February 27, 2026, the Nifty 50 remains positioned near the 25,500 level, while the Sensex trades around 82,250. Recent data indicates a cautious but positive trend, with the Nifty IT index outperforming many sectors with gains nearing 1%. Market stability is currently supported by strong domestic institutional activity. Domestic Institutional Investors (DIIs) have recently infused over 1,100 crore into the market, balancing global volatility and fluctuating foreign flows. The new social media norms are specifically designed to curb the rise of "finfluencers" and unregistered advisors who may promote high-risk or manipulative "pump-and-dump" schemes. By mandating clear identification, Sebi aims to help retail investors distinguish between verified professional advice and unregulated claims. Failure to comply with these disclosure norms by the May 1 deadline may lead to administrative action, including penalties or the suspension of registration. This move is a core part of the broader "Ease of Doing Investment" initiative, prioritizing investor protection in an increasingly digital financial landscape. In the current high-interest rate environment—with India's repo rate at 5.25%—investors are encouraged to remain vigilant. Verifying the registration of any entity providing market tips is now a critical step for individual capital safety.

NSE Initiates Investment Bank Selection Process for Initial Public Offering
The National Stock Exchange of India (NSE) has accelerated its march toward a landmark initial public offering, estimated at approximately ₹23,000 crore. After a decade-long wait, the exchange recently secured a crucial no-objection certificate from SEBI, clearing the path for what is expected to be one of the largest public issues in the history of Indian capital markets. Recent reports indicate that NSE has invited around 15 top-tier investment bankers, including JPMorgan Chase and Kotak Mahindra Capital, to pitch for lead management roles. Rothschild & Co. has been appointed as the independent adviser to oversee this selection process. The exchange aims to finalize its syndicate of advisers by mid-March 2026. Current projections suggest the Draft Red Herring Prospectus (DRHP) will be filed by June 2026. The issue is primarily an Offer for Sale (OFS), where existing institutional shareholders are expected to offload a stake of 4% to 4.5%. This provides an exit for early backers while opening the doors to a base of approximately 1.77 lakh current shareholders. NSE enters this phase with robust financial momentum. For the quarter ended December 2025, the exchange reported a consolidated profit after tax of ₹2,408 crore, reflecting a 15% sequential increase. Total income for the same period rose to ₹4,395 crore, driven by high trading activity. Transaction charges remain the dominant revenue pillar, accounting for 69% of the total income. Market dominance continues to be a key highlight for investors. The exchange maintains a near-monopoly in the equity derivatives segment, despite recent regulatory shifts and a hike in the Securities Transaction Tax (STT) aimed at curbing speculative retail participation. In the cash market, average daily traded volumes recently hovered near ₹99,000 crore. Valuation in the secondary unlisted market has surged, with the exchange now commanding a grey-market valuation exceeding ₹5 lakh crore. This premium is supported by a standalone PAT margin of 59% and a significant contribution to the national exchequer, which totaled ₹41,842 crore in taxes and levies during the first nine months of the current fiscal year. Operational focus has now shifted to the newly formed IPO committee, which met in early February to formalize the listing structure. This committee will handle the legal and regulatory complexities of the transition from a closely held institution to a publicly listed entity, marking the end of a regulatory era defined by the co-location challenges of the past.

HDFC Bank Updates Bank Locker Access Policy
HDFC Bank has implemented a rigorous overhaul of its safe deposit locker protocols to strengthen asset protection and align with the latest Reserve Bank of India (RBI) safety standards. Enhanced Biometric Security The bank has transitioned to a fully paperless and digital access system. Access now requires mandatory biometric authentication, such as fingerprint or iris scanning, directly linked to the user's Aadhaar. This shift is designed to eliminate unauthorized access through key duplication or identity theft. Operational Monitoring To ensure end-to-end security, a bank representative is now stationed at the locker room exit to verify that each unit is properly locked before the customer leaves the premises. Furthermore, under current mandates, branches must maintain 180 days of continuous CCTV footage of the vault area to facilitate audits and investigations. Fee Structure Revision Annual locker rentals have seen a sharp upward revision as of 2026. These adjustments reflect the increased costs of advanced security infrastructure and insurance premiums. * **Metro & Urban Branches:** Small locker fees have jumped to **₹5,000** annually, up from the previous **₹2,250**. * **Large Lockers:** Fees for large units in metro areas have reached **₹15,000**, compared to the earlier **₹10,000**. * **Rural Locations:** Entry-level extra-small lockers now start at approximately **₹550** plus applicable taxes. Liability and Compliance Under the revised framework, HDFC Bank's liability for loss due to negligence—including fire, theft, or employee misconduct—is capped at **100 times** the annual locker rent. For a locker priced at **₹5,000**, the maximum compensation is currently set at **₹5,00,000**. Strict storage guidelines are now in effect. Prohibited items include cash, weapons, hazardous chemicals, and perishable goods. Failure to comply with these storage norms or neglecting to sign the updated 2026 locker agreement can result in restricted access or termination of the facility.
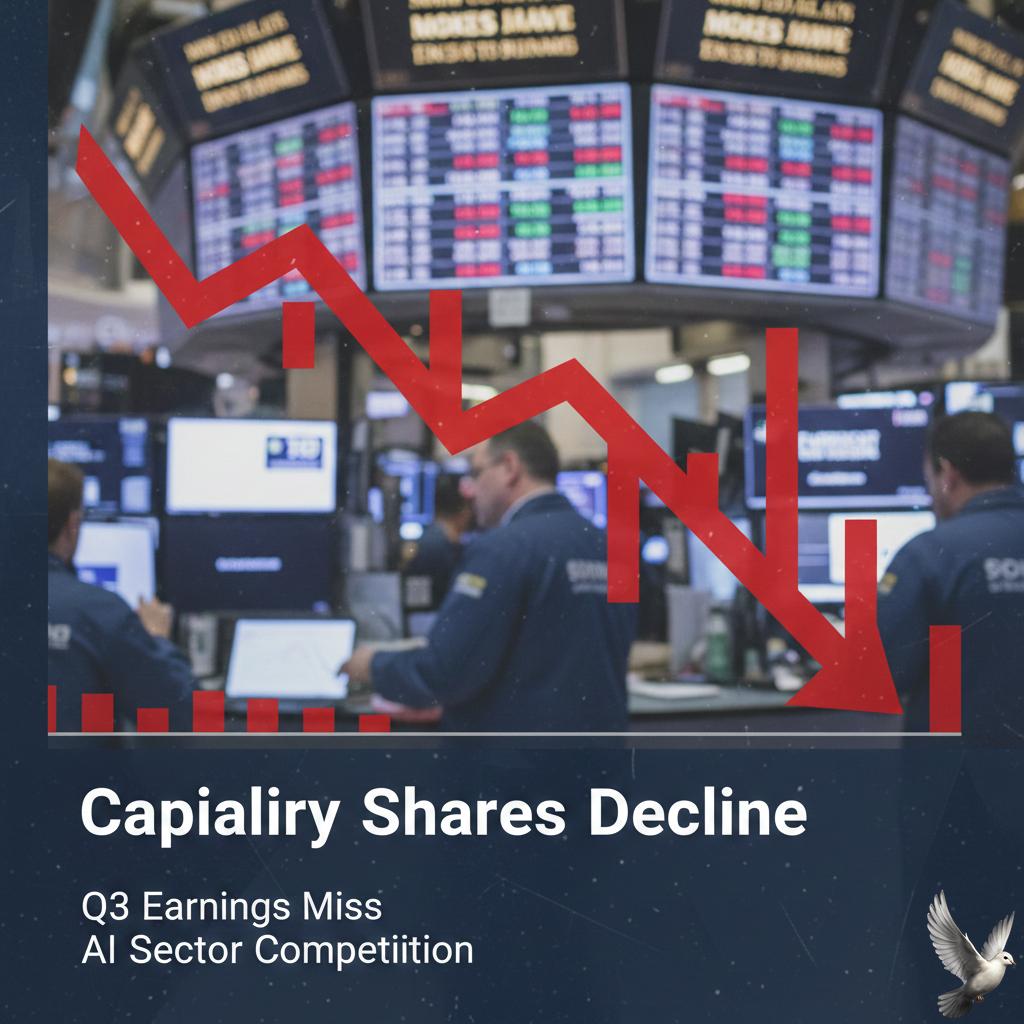
Capillary Shares Decline Amid Q3 Earnings Miss and AI Sector Competition
Capillary Technologies India has faced significant market pressure, with its share price retreating **35%** from its post-listing highs. As of late February 2026, the stock is trading near **₹518**, reflecting investor caution despite the company’s recent entry into the public markets in November 2025. The downturn follows a mixed performance in the third quarter of fiscal year 2026. While consolidated revenue grew **16%** year-on-year to **₹184 crore**, net profit for the quarter declined **30%** to **₹8 crore**. This dip was largely attributed to **₹2 crore** in IPO-related costs and higher depreciation following the acquisition of Kognitiv. **Financial Indicators** * **9-Month Revenue:** **₹543 crore**, a **22%** increase. * **Adjusted EBITDA:** **₹71 crore**, up **53%** year-on-year. * **Net Retention Rate:** A robust **111%**, placing it in the top tier of global SaaS firms. * **Order Book:** New additions totaled **₹66 crore** over the last nine months. The market remains focused on the "AI threat" to traditional SaaS models. Investors are weighing whether generative AI will commoditize customer engagement or if Capillary can successfully pivot. Currently, **10 to 15** of the company’s **115** enterprise customers are testing its AI-powered research assistant, aiRA. Management is leaning into AI-led productivity, aiming to automate complex migration tasks and campaign management. However, the lack of explicit forward-looking guidance has left a vacuum for speculation regarding long-term margin stability. **Strategic Moves** To counter growth concerns, the company is deploying its **₹877 crore** IPO proceeds toward inorganic expansion. It recently acquired SessionM from Mastercard and Kognitiv’s loyalty business to strengthen its footprint in North America and West Asia. The stock currently trades at approximately **6 times** its annualized nine-month revenue. While operational efficiency is improving—evidenced by a **16.4%** EBITDA margin—the transition to an "AI-first" platform remains the central pivot point for future valuation recovery.

Motilal Oswal Alternates Raises ₹1,700 Crore via New Fund
Motilal Oswal Alternates (MO Alts) has successfully marked the first close of its debut private credit vehicle, the India Credit Excellence Fund-I (ICEF-I), at ₹1,700 crore. This milestone includes a significant ₹200 crore commitment from the Motilal Oswal Group, signaling strong internal alignment. The fund is now progressing toward a final target corpus of ₹3,000 crore, which includes a green-shoe option to accommodate excess demand. This launch represents a strategic expansion for MO Alts, which already manages over ₹28,000 crore in assets across its private equity and real estate platforms. The ICEF-I strategy centers on the mid-market segment, specifically targeting fundamentally sound, profitable businesses that face structural hurdles in securing capital through traditional banking channels. The fund provides senior secured lending and bespoke debt solutions, often incorporating equity-linked structures to capture potential upside alongside steady credit yields. The move comes as India’s private credit ecosystem reaches a major inflection point. Recent data confirms the market grew by 35% in 2025, reaching a total value of $12.4 billion across 166 transactions. Domestic fund managers now dominate the landscape, accounting for approximately 64% of total deal value, as they fill the funding gap left by cautious traditional lenders. Investment yields in this space remain highly attractive, typically ranging between 12% and 25% depending on the complexity of the deal. Demand for such capital is being driven by a 21% rise in lending by NBFCs and a 12% growth in MSME credit, as companies seek flexible, non-dilutive financing for acquisitions and capital expenditure. Industry projections suggest the addressable private credit market in India could exceed ₹10 lakh crore in the coming years. Real estate remains the most active sector, capturing 42% of recent deal value, followed closely by healthcare and manufacturing at 15% each. MO Alts is positioning ICEF-I to leverage its 20-year track record in equity underwriting to bring a unique perspective to structured lending. By focusing on senior secured positions and growth-oriented mid-market firms, the fund aims to deliver superior risk-adjusted returns within a rapidly maturing alternative asset class.

IRFC OFS Receives Low Retail Subscription
The government’s Offer for Sale (OFS) in Indian Railway Finance Corporation (IRFC) concluded with a muted response, as the two-day issue failed to achieve full subscription. The floor price for the stake sale was set at **₹104 per share**, representing a slight discount to the prevailing market price at the time of the announcement. Retail participation was notably thin on the final day of the offer. Against a reservation of **3.79 crore shares** for the retail category, bids were received for only approximately **5.9 lakh shares**. This left the retail portion significantly undersubscribed, with individual investors largely staying on the sidelines. Institutional demand also fell short of expectations during the first leg of the sale. Institutional investors placed bids for **22.34 crore shares**, accounting for about **94.98%** of the **23.52 crore shares** allocated to them. Consequently, the government decided not to exercise the green-shoe option, which would have allowed for the sale of an additional **2% stake**. The stock faced immediate pressure following the undersubscription. IRFC shares touched a 52-week low of **₹102.50** during intraday trade, eventually closing at **₹103.25** on the BSE. This represents a decline of **1.24%** from the previous close, as the market reacted to the lack of aggressive bidding and the indicative price staying near the floor. Despite the tepid OFS response, the company’s recent financial performance remains stable. For the third quarter ending December 2025, IRFC reported a **10.5%** year-on-year increase in net profit, reaching **₹1,802 crore**. The company’s Assets Under Management (AUM) have grown to a record **₹4.75 lakh crore**, supported by its role as the primary financing arm for the Ministry of Railways. The broader railway sector continues to see massive capital allocation, with a government outlay of **₹2.65 lakh crore** for the 2025-26 fiscal year. While the OFS was a strategic move to comply with SEBI’s minimum public shareholding norms of **75%**, the current government holding remains above **82%** following this partial divestment. Investors are now monitoring the stock’s ability to hold above the **₹100 level**, which acts as a psychological support zone. The long-term outlook for the company remains tied to the National Rail Plan 2030 and the continued expansion of rolling stock and electrification projects across the national network.
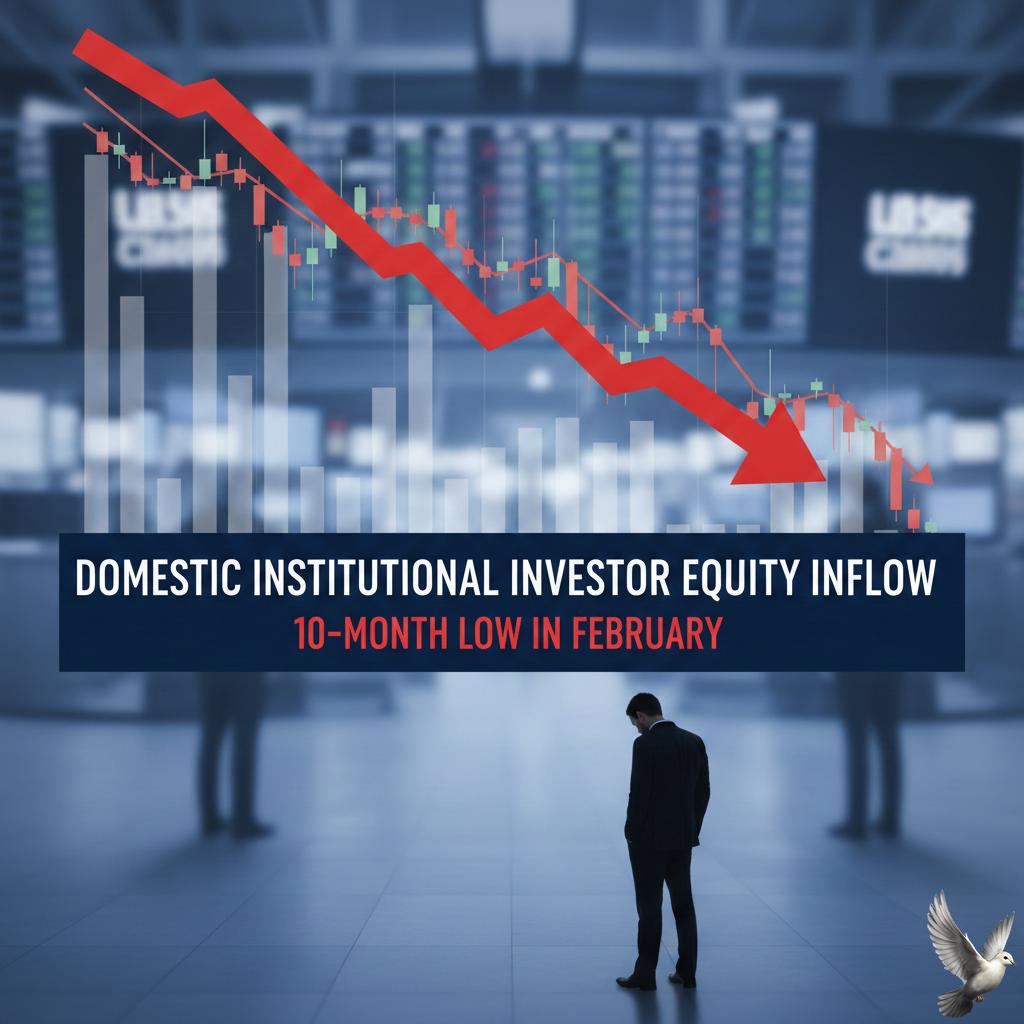
Domestic Institutional Investor Equity Inflow Reaches 10-Month Low in February
Domestic institutional investor (DII) activity in the Indian equity market has hit a significant slump this February, reaching its lowest point since April 2025. Total stock purchases for the month have plummeted to approximately 26,130 crore, representing a sharp decline of more than 50% compared to the average monthly inflows seen over the last half-year. This pullback marks a stark reversal from the robust participation recorded between November and January, when domestic inflows consistently ranged between 69,000 crore and 79,000 crore. The drop in momentum comes as benchmark indices like the Nifty 50 and Sensex remain relatively flat, failing to provide the high-growth returns investors have grown accustomed to in previous cycles. Market fatigue is evident after 18 months of lackluster performance. Over the last quarter, the Nifty 50 has struggled to break past the 25,800 resistance level, closing recently near 25,556. Meanwhile, the broader market has faced even steeper challenges; the Nifty Smallcap 250 index has slumped nearly 13% since late 2024, cooling the enthusiasm for aggressive domestic equity allocation. A major driver of this shift is the explosive performance of precious metals, which have emerged as the preferred destination for domestic capital. In a historic first, monthly flows into gold and silver schemes have exceeded those into equity funds. Gold prices in India have hit record highs this month, with 24K gold trading near 16,205 per gram. Silver has seen even more dramatic action, following a massive 47% surge in January that saw prices peak at 4,10,000 per kg. Although silver has since consolidated around the 2,84,900 per kg mark, the retail appetite for "safe-haven" assets continues to drain liquidity from the stock market. While domestic institutions have scaled back, foreign institutional investors (FIIs) have staged a moderate comeback, turning net buyers this February with inflows of approximately 2.44 billion dollars. This foreign interest has prevented a deeper correction in the indices, even as local funds take a backseat. Sector-specific trends show that institutional money is now highly selective. While the IT and banking sectors have seen sporadic rallies, domestic funds are increasingly booking profits at higher levels to rebalance portfolios toward outperforming commodities. The current landscape reflects a transition toward a more cautious investment strategy. With equity returns stagnating and precious metals delivering double-digit gains, the immediate outlook for domestic stock market liquidity remains under pressure as capital continues to rotate into bullion.
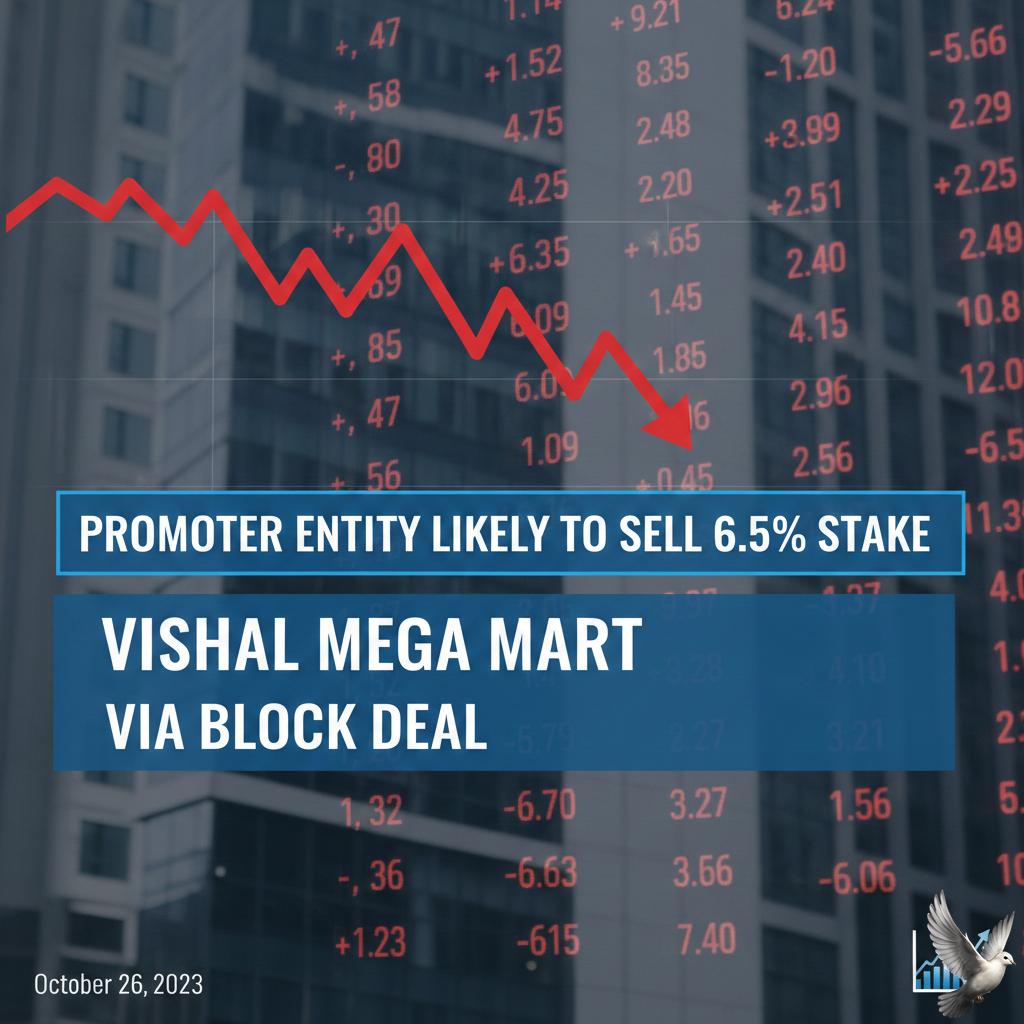
Promoter entity likely to sell 6.5% stake in Vishal Mega Mart via block deal
Vishal Mega Mart stands at a critical market juncture following a major equity move and the release of robust quarterly performance figures. As of February 26, 2026, the company’s promoter entity, Samayat Services LLP, has initiated a block deal to offload a 6.5% stake in the hypermarket giant. The deal involves the sale of approximately 30.5 crore shares at a floor price of Rs 115 per share. This pricing represents a 10% discount to the current market closing price of Rs 127.53. The transaction is valued at approximately Rs 3,508 crore and includes a 150-day lock-in period for the promoter's remaining stake. Despite the discounted entry point for institutional buyers, the stock demonstrated resilience by ending the trading session up 3.71%. Financially, the retailer continues to show strong operational momentum. In the quarter ending December 2025, Vishal Mega Mart reported a consolidated net profit of Rs 313 crore, marking a 19% increase compared to the Rs 263 crore earned in the same period the previous year. Revenue from operations climbed 17% to reach Rs 3,695 crore, supported by healthy festive demand and an expanding retail footprint. The company’s growth strategy remains aggressive. During the third quarter, 29 new stores were added to the network, bringing the total count to 780 locations across 517 cities. This expansion is part of a broader push into strategic markets such as Maharashtra, Gujarat, and Kerala. The retailer’s quick-commerce initiative has also scaled significantly, now servicing 723 stores and reaching nearly 12 million registered users. From a valuation perspective, the stock has outperformed broader indices with a 24% return over the past 12 months, compared to a 13% gain for the Nifty 50. However, analysts maintain a cautious but generally optimistic outlook. While the company trades at a premium Price-to-Earnings ratio of approximately 86.5x, matching major competitors like Avenue Supermarts, market experts have set 12-month price targets as high as Rs 192, citing strong same-store sales growth of 9.6%. The broader Indian retail sector is currently navigating a transition toward value-seeking consumer behavior. While overall retail sales growth is stabilizing at mid-to-high single digits, value-led hypermarkets are benefiting from a shift in Tier II and III cities where aspirational consumption is rising. Vishal Mega Mart’s focus on affordable fashion and private labels positions it to capture this ongoing demand despite intensifying competition from digital-first brands and quick-commerce rivals.
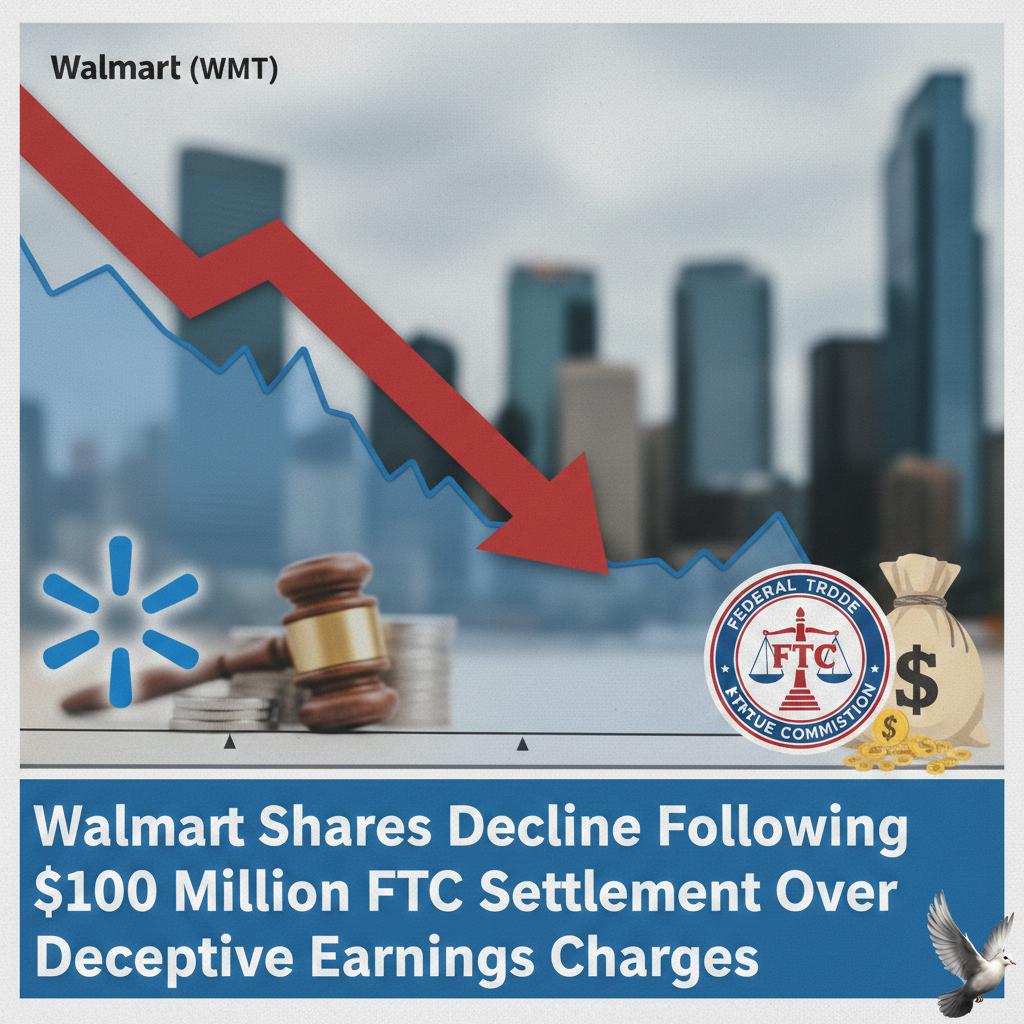
Walmart Shares Decline Following $100 Million FTC Settlement Over Deceptive Earnings Charges
Walmart has reached a **$100 million** settlement with the Federal Trade Commission (FTC) and a bipartisan group of state attorneys general to resolve allegations of deceptive practices within its Spark Driver program. The settlement addresses claims that the retail giant misled nearly **1 million** gig drivers and its customer base. Regulators alleged that Walmart failed to pass on **100%** of customer tips to drivers as promised, and in some instances, made no tip payments at all. The investigation revealed that Walmart frequently altered base pay and incentive offers after drivers had already accepted delivery tasks. This resulted in drivers receiving significantly less than the amounts originally advertised on the platform. Under the terms of the agreement, up to **$79 million** will be paid directly to affected drivers. An additional **$10 million** is allocated to the FTC for consumer refunds, while **$11 million** will be distributed among the participating states. This enforcement action comes at a time of record growth for Walmart's digital infrastructure. In its latest fiscal report released in February 2026, the company saw global e-commerce sales surge by **24%**, with total annual revenue reaching **$713.2 billion**. Despite this financial momentum, the company’s stock recently faced pressure following a cautious outlook for the upcoming year. Walmart projected net sales growth of **3% to 4%** for fiscal year 2027, a figure that trailed some analyst expectations and triggered a **6%** intraday drop in share price following the announcement. The Spark Driver program remains a critical component of Walmart’s "last-mile" delivery strategy, which has seen expedited delivery volumes grow by more than **50%**. However, the FTC settlement now mandates strict transparency, prohibiting the company from misrepresenting future earnings or incentive requirements. This case reflects a broader regulatory crackdown on the global gig economy, which is valued at approximately **$146.5 billion** as of 2025. Regulators are increasingly scrutinizing "algorithmic wage discrimination" and deceptive tip-pooling practices across major delivery and ride-hailing platforms. Walmart has stated it is already implementing system improvements to enhance transparency for its driver network. The settlement ensures that the company cannot change the material terms of a delivery offer once it has been accepted by a driver. [Walmart Spark Settlement Details](https://www.google.com/search?q=https://www.youtube.com/watch%3Fv%3DLk25Rcl9A7k) This video provides a breakdown of the FTC's allegations and the specific financial breakdown of how the settlement funds will be distributed to drivers.

Factors Influencing Stock Market Performance for Friday
Indian benchmark indices concluded a volatile session on February 26, 2026, with a flat finish as early gains were eroded by persistent selling in heavyweight financial stocks. The Nifty 50 managed a marginal gain of **14.05 points** to close at **25,496.55**, while the BSE Sensex dipped slightly by **27.46 points** to end at **82,248.61**. The session was defined by a sharp rotation into defensive and non-cyclical pockets. While the IT, Pharma, and Healthcare sectors provided a significant cushion, the financial services sector, specifically HDFC Bank, acted as a primary drag on the broader market. Heavyweight Pressure and Sector Divergence Financial stocks faced intense pressure, led by HDFC Bank, which fell **0.98%** to close near **₹898.60**. This decline effectively neutralized the positive momentum generated by sectors like Auto and PSU Banking. The Nifty Auto index rose nearly **1%**, supported by gains in Maruti Suzuki and Tata Motors, while the Nifty Pharma index surged **1.08%** to reach **23,301.65**. IT stocks also showed resilience, with the Nifty IT index outperforming the benchmarks by rising **0.89%**. This was bolstered by news of strategic partnerships, such as Tejas Networks rallying **17%** following a major 5G equipment deal. Technical Indicators and Support Levels Market momentum remains fragile as the Nifty 50 consistently failed to reclaim its **21-day Exponential Moving Average (EMA)**. Technical analysts noted a bearish crossover in the Relative Strength Index (RSI), suggesting that the trend remains weak in the immediate term. Key levels to monitor: * **Immediate Support:** **25,400** (Intraday base) * **Crucial Support:** **25,300** (A break below this could trigger a slide to **25,150**) * **Immediate Resistance:** **25,550 – 25,600** * **Major Hurdle:** **25,800** (A breakout above this is required for a fresh rally) The India VIX, a gauge of market volatility, dropped by **3.15%** to settle at **13.06**, indicating that while the indices are flat, the extreme fear levels have slightly subsided. Global and Macroeconomic Triggers Investors remained cautious ahead of the release of India’s **GDP data** and high-stakes international developments, including US-Iran nuclear talks and US initial jobless claims. Uncertainty regarding US tariff policies also kept institutional buyers in a "wait-and-watch" mode. In the currency market, the Indian Rupee showed minor strength, closing at **90.90** against the US Dollar, up from the previous close of **90.94**. Crude oil prices also provided some relief as Brent futures hovered near **$69.89**, cooling down from recent highs. The broader market performance was slightly more positive than the headline indices. The BSE Mid-Cap index climbed **0.55%**, while the Small-Cap index saw a modest rise of **0.07%**, reflecting selective buying in quality stocks outside the large-cap universe.
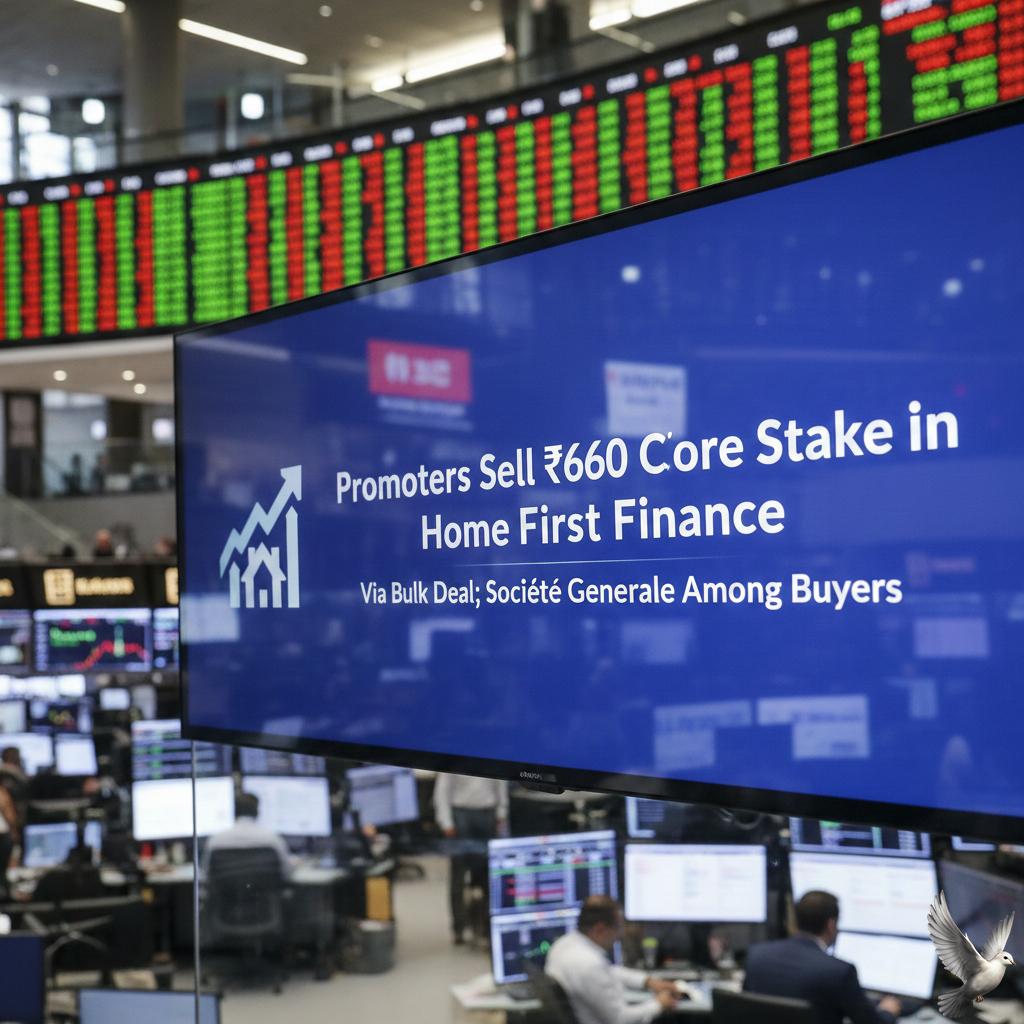
Promoters Sell ₹660 Crore Stake in Home First Finance via Bulk Deal; Societe Generale Among Buyers
Home First Finance is currently navigating a period of strategic transition, marked by significant shifts in its ownership structure and robust financial expansion. Recent market activity saw promoters Aether and True North offload a substantial stake worth approximately **660 crore**. These shares were acquired by global institutional heavyweights Societe Generale and PICTET through bulk deals. Following this transaction, the promoter holding has settled at approximately **12.35%** as of February 2026. While the stock faced an initial intraday decline of nearly **6%**, it has maintained a resilient technical posture, recently crossing above its **200-day Moving Average** of **1,220**. The company’s growth trajectory remains aggressive within the affordable housing segment. Key performance metrics for the latest quarter highlight a significant surge in profitability and scale: **Operational Scale and AUM** The company’s Assets Under Management (AUM) reached a milestone of **14,925 crore**, representing a year-on-year growth of **24.9%**. Disbursements for the quarter hit an all-time high of **1,318 crore**, up **10.5%** compared to the previous year. **Profitability and Returns** Net profit for the quarter surged by **44%** to reach **140 crore**. This performance is supported by a healthy Return on Assets (RoA) of **4.0%**. The company continues to maintain a strong spread on loans at **5.4%**, effectively managing its cost of borrowings which has moderated to **8.0%**. **Asset Quality and Capital** Despite a slight uptick in Gross Non-Performing Assets (GNPA) to **2.0%**, the company maintains a massive liquidity buffer of over **4,300 crore**. Its capital adequacy remains exceptionally high, with a Tier 1 ratio of **48.6%**, providing a stable foundation for future lending. Home First Finance primarily serves first-time homebuyers in the low- and middle-income segments, with **60%** of its base falling under the EWS and LIG categories. The company is leveraging a technology-driven model to maintain a rapid credit underwriting turnaround time of approximately **48 hours**. Market analysts maintain a positive outlook on the stock, with price targets ranging up to **1,375**. This optimism is fueled by the company's geographical expansion—now reaching **165 branches** and **368 touchpoints**—and its consistent ability to outperform broader market benchmarks over a one-year horizon.

Analysis of Data Patterns and Finolex Cables for Friday Trading
The Indian equity markets showed signs of recovery during the February 26 session, with the Nifty 50 closing at **25,496.55**, marking a modest gain of **14 points**. While the index initially struggled with volatility, it managed to snap a losing streak as buying interest emerged in the IT and banking sectors. The session was characterized by intraday swings, with the Nifty fluctuating by nearly **0.3%** in both directions. The Sensex followed a similar pattern, ending slightly lower at **82,248.61**. Heavyweight pressure remains a concern, as financial leaders like HDFC Bank continue to act as a drag on the broader benchmarks. Technical Landscape and Levels Technical indicators suggest the market is entering a consolidation phase. The Nifty 50 has established a crucial support zone between **25,350** and **25,380**. This area is being closely watched by traders as a "make-or-break" floor for near-term momentum. Immediate resistance is currently positioned in the **25,630 to 25,660** range, which aligns with the 50-day extended moving average. Analysts indicate that a sustainable move above **25,660** is necessary to trigger a fresh rally toward the **25,800** mark. Conversely, a breach below the **25,300** psychological support could open the doors for a deeper correction toward **25,150**. Sectoral Performance and Trends The Information Technology sector emerged as the primary driver of the day, with the Nifty IT index gaining **0.89%**. This rebound was supported by positive global cues and a stabilization in demand outlooks for Indian tech exporters. The banking sector also provided much-needed stability, with the Nifty Bank closing at **61,193.90**, up **0.25%**. While the financial and auto sectors showed mixed results, specific focus remains on the Aerospace and Defense sectors. Institutional interest continues to rotate into high-growth manufacturing and "Make in India" themes, providing a cushion against global market volatility and shifting FII flows. Stock-Specific Action **Data Patterns** The stock witnessed a significant surge, closing at **3,243.60**, up over **5.6%**. It hit a new 52-week high of **3,280** during the session. Technical patterns show a strong "Long White Candle," signaling robust bullish sentiment. The company’s recent quarterly performance, featuring **33%** revenue growth and a **22%** rise in net profit, continues to attract momentum buyers. **Finolex Cables** The stock displayed notable strength, ending the session at **873.35**, a gain of **5.66%**. It is currently trading significantly above its pivot level of **755.37**. With a debt-free balance sheet and a price-to-earnings ratio of **18.25**—well below the sector average of **46.59**—it is increasingly viewed as an attractive value play in the cable and wire industry. Regulatory and Macro Outlook The National Stock Exchange (NSE) has recently proposed stricter entry barriers for the retail derivatives market. These potential regulations aim to curb excessive speculation and protect smaller investors from high-volatility risks. Investors are also keeping a close eye on upcoming domestic GDP data and international trade developments, which are expected to dictate market direction in the final week of February.