Bullish News
Collection
Silver and Gold Prices Decline Following US Jobs Data and Shifting Rate Cut Expectations
Precious Metals Market Update: February 12, 2026 Gold and silver futures faced downward pressure during early Thursday trading as a resurgent **US Dollar Index** climbed to **97.01**. The rally follows a robust January employment report revealing an unexpected addition of **130,000 non-farm payrolls**, significantly exceeding the forecasted **55,000**. This labor market resilience has cooled expectations for early Federal Reserve interest rate cuts, with many traders now shifting projections for the first reduction to **July 2026**. Spot gold slipped roughly **0.4%** to trade near **$5,058 per ounce**, while US gold futures for April delivery settled around **$5,080**. In the domestic market, MCX gold futures are hovering near the **₹1,59,750 per 10 grams** mark. Despite the morning's dip, gold remains within striking distance of its psychological barrier of **₹1.60 lakh**, having recovered nearly **97%** of its early February losses. Silver experienced a sharper correction, with spot prices falling **2%** to approximately **$82.20 per ounce**. On the MCX, silver futures for March delivery are trading near **₹2,89,900 per kg**, a notable consolidation after a volatile month that saw the metal peak at **₹3,50,000** on February 1. The gold-to-silver ratio remains elevated at **85:1**, suggesting silver may be undervalued relative to gold at current levels. Market Drivers and Sentiment The primary headwind remains the strengthening greenback, which makes dollar-denominated metals more expensive for international buyers. Investors are now laser-focused on upcoming **US inflation data**, which will provide critical clues for the Federal Reserve’s policy path. Current forecasts suggest core inflation could peak at **3%** in the second quarter of **2026** before moderating later in the year. While short-term volatility persists, structural support remains firm. Central banks, led by the People's Bank of China, continue to expand gold reserves as part of broader de-dollarization strategies. Geopolitical tensions in the Middle East and ongoing fiscal uncertainty in major economies further bolster the metal's status as a premier safe-haven asset. Technical Outlook Analysts suggest a "buy on dips" strategy remains effective for retail investors. Gold maintains a positive bias as long as it stays above the **$5,000** psychological support level. On the domestic front, a decisive break above **₹1,60,000** could signal a resumption of the primary uptrend. For silver, immediate support is identified at the **₹2,80,000 per kg** zone. Experts believe that if industrial demand from the green-tech and 5G sectors accelerates alongside a potential dollar softening, silver could retest the **₹3,30,000** resistance level in the medium term.

Divi's Laboratories and Four Other Stocks Exhibit Bullish RSI Trends
Market Brief: Momentum and RSI Trends **February 12, 2026** The **Relative Strength Index (RSI)** is a vital momentum oscillator that tracks the speed and change of price movements on a scale of **0 to 100**. When an asset's RSI is trending up, it indicates that buying pressure is intensifying and the current price trend is gaining strength. Typically, a move above **50** signals a shift toward bullish territory, while readings over **70** suggest an overbought condition and levels below **30** indicate an oversold state. US Indices and Divergence The **S&P 500** is currently hovering near **6,941.81**, reflecting a stable but cautious market environment. Technical data shows its **14-day RSI** sitting at **54.6**, a notable recovery from early February lows of **46.4**. This upward trend in RSI suggests a return of buying interest as the index remains comfortably above its **50-day moving average** of **6,889.66**. In contrast, the **Nasdaq 100** is facing technical hurdles near **23,102.48**. Analysts have noted a bearish divergence where the price has struggled to reclaim previous highs while the RSI fails to confirm upward momentum. This suggests that while prices are elevated, the underlying strength of the tech sector rally may be cooling. Indian Market Strength The **BSE Sensex** shows robust technical health as it trades near **84,233.64**. Its current **RSI** stands at **56.4**, signaling a moderately strong momentum. The index is maintaining its position above all **8 major Simple Moving Averages (SMAs)**, confirming a sustained uptrend. The **Nifty 50** is currently testing the **26,000** psychological barrier. Its **RSI** is positioned at **58**, indicating a neutral-to-mildly bullish bias. As long as the index sustains above the **25,800** support zone, the technical structure remains constructive for further gains toward the **26,300** resistance level. Global and Crypto Sentiment * **Nikkei 225:** Japan’s index surged to **57,650.54**, gaining **2.28%** in a single session. The momentum is fueled by political stability, though some analysts warn that the RSI is entering an overbought phase. * **Bitcoin:** The cryptocurrency market is experiencing extreme volatility. Bitcoin’s **RSI** recently dropped to **30**, hitting oversold territory. This often precedes a "dead cat bounce," with immediate resistance seen between **$72,000** and **$74,000**. * **Commodities:** Silver has entered a significant overbought phase, its most extreme since **1980**, prompting calls for investor caution. Key Economic Drivers Market momentum is currently sensitive to several fundamental shifts: * **AI Spending:** Leading hyperscalers project **$600 billion** in infrastructure spending for **2026**, a **75-80%** increase from previous years. * **Inflation Data:** India is transitioning to a new **CPI index** with a **2024** base year, which may recalibrate interest rate expectations. * **Labor Markets:** A stronger-than-expected US jobs report with **130,000** new positions in January has reduced the immediate likelihood of Federal Reserve rate cuts.

Nikkei 225 Surpasses 58,000 Milestone Following Takaichi Election Victory
The Japanese equity market continues its historic ascent, with the benchmark Nikkei 225 Index hitting an unprecedented milestone today, February 12, 2026. After a public holiday, investors returned to push the index past the psychological barrier of 58,000 for the first time in history. The Nikkei 225 surged to an intraday high of 58,015.08 before settling slightly lower at 57,685.97. This movement marks a significant 15% gain for the index since the beginning of 2026. The broader Topix Index also demonstrated strength, climbing 0.45% to reach 3,872.76, further solidifying the record-breaking trend. Market sentiment is currently dominated by the "Takaichi Trade." Following a landslide victory for Prime Minister Sanae Takaichi in the recent general election, traders are betting on a regime of expansionary fiscal policy. The Prime Minister’s agenda—focused on increased government spending and targeted tax cuts—has provided a powerful mandate for growth that is resonating with both domestic and international investors. Corporate earnings are providing additional tailwinds. Furukawa Electric led gainers with a 4.5% rise, while SoftBank Group climbed 2.9% ahead of its earnings release. These gains reflect a broader rotation of global capital into Japanese markets, as investors seek attractive valuations and a stable political environment compared to other major economies. In the currency markets, the Japanese Yen has shown unexpected resilience. Despite strong U.S. labor data and rising Treasury yields, the Yen strengthened to the 153 range against the U.S. Dollar. This move follows a "bull flattening" of the Japanese yield curve and reassurances from the government that fiscal stimulus will be managed without excessive new bond issuance. Macroeconomic indicators suggest a steady trajectory for the remainder of the year. Core inflation is projected to hover near the 2% target, while real GDP growth for 2026 is forecast at approximately 1%. The Bank of Japan remains on a path toward policy normalization, with analysts expecting the short-term interest rate to reach 1% by the end of the year. The combination of political stability, robust corporate performance, and a shift in global portfolio allocations has positioned Tokyo as a primary engine of growth in the Asian region. As the Nikkei enters uncharted territory above 58,000, the focus remains on the implementation of the new administration’s economic stimulus and its impact on long-term fiscal sustainability.

Banking and Auto Sectors Lead Earnings Growth as Consumer Durables Show Recovery Signs
Market Brief: India Financial and Consumer Sectors **Banking and Financial Services** India's banking sector is maintaining a strong growth trajectory as of February 2026. Credit growth is currently holding steady at **13.1%** year-on-year. System-level loan-to-deposit ratios have reached an all-time high of **81.7%**, signaling high credit demand despite tighter liquidity conditions. Asset quality remains a primary strength, with non-performing assets (NPAs) expected to stay low at **2%** to **2.5%** through fiscal 2027. The Reserve Bank of India has maintained the repo rate at **5.25%**, providing a stable interest rate environment for both corporate and retail borrowers. **Automotive Performance** The auto sector began 2026 with significant momentum. Total vehicle retail sales in January jumped **17.6%** year-on-year, reaching **2.72 million** units. This surge is largely anchored in rural markets, where sales grew by over **14%**, significantly outperforming urban growth. Two-wheeler registrations rose by nearly **21%**, while the passenger vehicle segment saw a **7.2%** increase. Mid-size SUVs continue to dominate consumer interest, with new model launches capturing double-digit market shares in their debut months. Dealers report high optimism for the February-March period, supported by wedding season demand and a growth-oriented budget. **Consumer Durables and Urban Trends** The consumer durables industry is entering a structural turning point. Major appliances and electronics have reached a market valuation of **₹1,86,000 crore**. Growth is being driven by higher household penetration in tier-2 and tier-3 cities, alongside a wave of real estate deliveries. While rural demand is robust, urban consumption shows a preference for premiumization and energy-efficient products. Consumers are increasingly shifting toward value-seeking behavior, prioritizing long-term utility and energy savings over initial costs. New energy efficiency ratings and extended producer responsibility rules starting in 2026 are expected to further modernize the sector. **Investment Strategy and Outlook** Institutional investors, including UTI Mutual Fund, are actively targeting underpenetrated segments within these rebounding sectors. Strategic focus is shifting toward financial services and discretionary consumption themes. The broader economy is projected to grow at **7.4%** for the current fiscal year. With inflation remaining within the target range of **2.1%** to **3.2%**, the combination of stable policy rates and rising disposable incomes is creating a favorable environment for sustained domestic consumption.

IT Stocks Lower as US ADRs Decline up to 5%
Market Brief: AI Disruption in IT Services **Market Snapshot** The Indian IT sector faced significant volatility in early February 2026. ADRs for major players tumbled as Wall Street reacted to a perceived shift in the competitive landscape. Sentiment turned sharply bearish following the launch of high-functioning AI tools designed to automate complex, high-value professional tasks. **Stock Performance and Valuation** Infosys ADR (INFY) fell by **5.6%**, closing near **$16.61**. Wipro ADR (WIT) experienced a similar slide, dropping approximately **5%** to settle around **$2.45**. This sell-off wiped out nearly **$300 billion** in market value across the global software and services sector in a single week. The Nifty IT index in India mirrored this weakness, with heavyweights breaking below their **100-day** and **200-day** moving averages. **The Catalyst: Claude Cowork** The primary trigger for the sell-off was the release of Claude Cowork by Anthropic. Unlike previous chatbots, this system uses specialized plugins to automate end-to-end workflows. In demonstrations, the AI independently conducted legal research and prepared filings. This has led investors to view AI as a replacement for traditional service models rather than just a productivity aid. **Revenue and Margin Outlook** Analysts have revised growth expectations for the fiscal year 2026. Revenue growth for the Indian IT sector is projected to remain muted at **1.1%** year-on-year. While some firms maintained stable operating margins of **18% to 21%** in the recent quarter, there are rising concerns about "productivity pass-throughs." If AI allows one person to do the work of many, traditional seat-based pricing and billing-hour models face systemic pressure. **Emerging Trends** Despite the immediate panic, some market leaders suggest the reaction is a "knee-jerk" response. Total IT spending in India is still forecast to reach **$176.3 billion** by the end of 2026, a **10.6%** increase. However, the nature of this spending is shifting. Demand is moving away from legacy outsourcing toward AI-driven security, data center expansion, and "agentic" orchestration. **Long-Term Strategy** The industry is entering a "year of reckoning." Companies are now being valued based on their "agent readiness" and ability to integrate AI into core operations. While traditional firms retain strong client relationships, the market is increasingly favoring AI developers. Anthropic, for instance, is currently seeking a valuation of over **$350 billion**, highlighting the massive capital shift toward generative AI infrastructure.

Patanjali Foods Q3 Net Profit Rises 60% YoY to Rs 594 Crore
Patanjali Foods Performance Brief: Q3 FY26 Patanjali Foods reported landmark financial results for the quarter ending December 31, 2025, achieving its **highest-ever quarterly revenue** of **₹10,483.71 crore**. This represents a strong **16.53% year-on-year growth**, signaling a successful shift in the company’s business mix. FMCG Segment Accelerates The FMCG division has emerged as a primary growth engine, with combined sales jumping **38.93%** to reach **₹3,248.35 crore**. This segment now contributes over **30%** of total revenue. Within this category: * **Ghee** revenues surged by **46.50%**. * **Biscuits** rose **26.44%**, with the 'Doodh' brand crossing the **₹1,000 crore** sales mark within just nine months. * **Home and Personal Care (HPC)** maintained high profitability with an EBITDA margin near **25%**. Edible Oil and Operations The Edible Oil segment continues to provide volume leadership, contributing **₹7,335.71 crore** to the quarterly topline. Branded oils remain the dominant force, accounting for approximately **85%** of segment sales. Operational highlights include the expansion of oil palm plantations to **1,08,164 hectares** and a presence in **36 countries** through its export network. Export revenues for the nine-month period reached **₹156 crore**. Profitability and Market Context Consolidated net profit for the quarter stood at **₹593.44 crore**, a significant **60% jump** compared to the same period last year. However, the company faces a divergence in margins; while the FMCG segment enjoys margins above **10.8%**, the Edible Oil segment operates on a thinner margin of **2.39%** due to global commodity volatility. Strategic Outlook for 2026 Management anticipates a robust finish to the fiscal year. Growth is expected to be sustained by: * **GST 2.0 Reforms:** Rationalization is driving price cuts in large packs and increasing grammage in smaller units. * **Rural Resilience:** Positive Kharif output and welfare schemes are supporting disposable income in rural markets. * **Inflation Easing:** Benign inflation levels, which averaged **1.7%** in late 2025, are strengthening urban demand. The stock has reflected this momentum, trading near **₹521.75** as of mid-February 2026, with a market capitalization exceeding **₹56,700 crore**. High-single-digit volume growth remains the industry-wide target as the sector pivots toward premiumization and wellness-oriented products.

SBI MF CIO Recommends Short-End Corporate Bonds and Tactical SDL Allocation
India's fixed income markets are navigating a complex landscape of record supply and stabilizing macros. While fundamental economic indicators remain robust, the bond market is currently grappling with a significant demand-supply mismatch that has kept yields elevated near one-year highs. The Reserve Bank of India maintained the repo rate at 5.25% in its February 2026 meeting. This decision followed a cumulative reduction of 125 basis points over the current easing cycle. The central bank has shifted to a neutral stance, emphasizing a proactive approach to liquidity management while keeping a close eye on inflation, which is projected to average 2.1% for the 2025-26 fiscal year. A primary driver of market pressure is the heavy borrowing schedule. The Union Budget has proposed a record gross market borrowing of 17.2 lakh crore for the upcoming fiscal year. This massive supply, combined with a surge in State Development Loans, has pushed the 10-year benchmark government bond yield to approximately 6.72% - 6.76%. State governments are raising significant capital, with weekly auctions reaching upwards of 486 billion. Market liquidity remains a persistent challenge. Banking system liquidity has been strained by foreign exchange interventions and a gap between credit and deposit growth. These conditions have made banks, the traditional buyers of government debt, more cautious, further limiting the downward movement of yields despite the broader cooling of inflation. Investment strategies are shifting toward shorter durations and high-quality accruals. Experts suggest a selective approach, favoring short-end corporate bonds and tactical entries into state development loans where yield spreads remain attractive. Mid-duration funds are also gaining traction as investors seek to balance stable returns with the volatility of the longer-term yield curve. External factors, including the inclusion of Indian bonds in global indices and shifting US Treasury yields, continue to provide a technical backdrop for the market. Potential foreign portfolio inflows of up to 20 billion USD are expected if global index inclusions are confirmed in the first quarter of 2026, which could eventually tilt the demand-supply balance in favor of sovereign securities. [India 10-Year Bond Yield Analysis](https://www.youtube.com/watch?v=z01RGOV-ZNw) This video provides an expert breakdown of the factors keeping Indian bond yields high, including borrowing estimates and global spillover effects. http://googleusercontent.com/youtube_content/0

M&M Shares in Focus as Q3 Standalone Net Profit Rises 33% to Rs 3,931 Crore
Mahindra & Mahindra has delivered a historic financial performance for the third quarter of FY26, with consolidated revenue crossing the **52,100 crore** milestone for the first time. The Group reported a significant **47% year-on-year** surge in consolidated net profit, reaching **4,675 crore**. On a standalone basis, net profit climbed **33%** to **3,931 crore**, driven by robust demand in both automotive and agricultural sectors. The automotive division remains a primary growth engine, with total vehicle volumes rising **23%** to over **3.02 lakh** units. The company has further cemented its leadership in the SUV segment, capturing a **24.1%** revenue market share—an increase of **90 basis points**. Popularity for new models like the XUV 7XO and the XEV 9S remains high, supporting a **30%** jump in consolidated automotive revenue to **30,370 crore**. In the farm equipment sector, M&M continues to dominate with a **44%** market share. Despite a slight softening in overall industry volumes earlier in the year, the tractor segment saw a **23%** volume increase to **1.5 lakh** units this quarter. Profitability in this division was particularly strong, with standalone PBIT margins expanding by **240 basis points** to reach **20.5%**, supported by a notable recovery in rural cash flows and harvest-led demand. Broader business segments also showed aggressive growth. Mahindra Finance reported a **97%** jump in profit after tax while maintaining stable asset quality. Tech Mahindra recorded its highest-ever deal wins, with EBIT margins improving to **13.1%**. Additionally, Mahindra Logistics returned to profitability after 11 quarters, and Mahindra Lifespaces saw a fivefold increase in net profit. Looking ahead, the company has announced a massive **15,000 crore** investment over the next decade to establish its largest integrated manufacturing facility in Nagpur. Spanning **1,500 acres**, this hub will eventually produce over **5 lakh** vehicles and **1 lakh** tractors annually. The facility is designed to support multiple powertrains, including internal combustion engines and electric vehicles, as M&M scales for global markets. As of February 12, 2026, the stock is trading near the **3,675** level. Market analysts maintain a positive outlook, with price targets ranging between **4,230** and **4,378**. This optimism is fueled by the company’s capacity expansion plans, a strong pipeline of upcoming SUV launches, and the sustained structural recovery in rural India, where demand is currently outpacing urban growth. [Mahindra M&M Q3 FY26 Earnings Analysis](https://www.youtube.com/watch?v=ol6SrPw1Xkk) This video provides an in-depth breakdown of the latest financial results and the company's strategic roadmap for 2026. http://googleusercontent.com/youtube_content/0
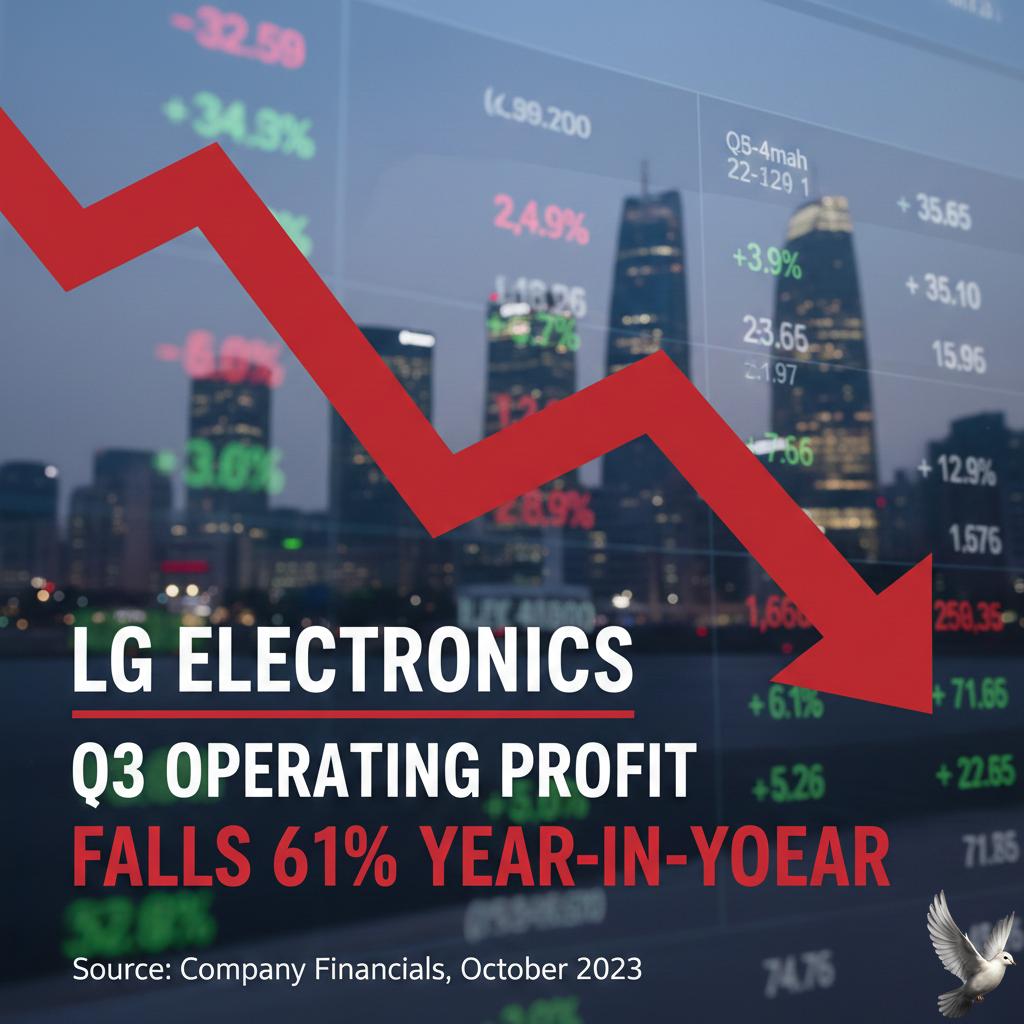
LG Electronics Q3 Operating Profit Falls 61% Year-on-Year
LG Electronics India has reported a significant downturn in its financial performance for the third quarter of FY26. The consumer electronics major saw its consolidated net profit plummet by 61.6% year-on-year, landing at 89.6 crore. This is a sharp contrast to the 233 crore reported in the same period last year, as the company grapples with softer post-festive demand and rising operational costs. Revenue from operations also faced headwinds, slipping 6.4% to 4,114 crore compared to 4,396 crore in the previous year. On a sequential basis, the decline was even more pronounced, falling from 6,174 crore in the September quarter. Despite these challenges, the cost of materials remained relatively stable at 2,988 crore, though employee benefits and depreciation expenses saw marginal increases. Profitability margins were under notable pressure during the quarter. The EBITDA fell by 42.4% to 196 crore, causing the EBITDA margin to contract to 4.8% from 7.7% a year ago. Market analysts noted that these figures fell short of Street estimates, which had projected an EBITDA of approximately 323 crore. Management is now pivoting toward a two-track strategy to recover momentum. This involves strengthening the premium product range while expanding the "LG Essential" lineup, which targets first-time, value-conscious buyers. There is a strong focus on the upcoming summer season, with expectations of high demand for air conditioning and compressor products. Additionally, the company aims to double its exports to the US and Europe by leveraging the "Make in India" initiative and favorable trade agreements. On the stock market, LG Electronics India shares reflected the cautious sentiment, ending 1.5% lower at 1,518.80 on February 11, 2026. However, the technical setup remains broadly positive. The stock is currently trading above its 5-day, 10-day, and 20-day moving averages, suggesting underlying support despite the immediate earnings shock. The broader consumer durables sector in India continues to show long-term promise, with the market expected to reach 158.4 billion USD by 2034. While short-term volatility persists due to fluctuating exchange rates and intense competition, the sector is supported by rising disposable incomes and government incentives like the Production-Linked Incentive (PLI) scheme. [LG India Q3 earnings analysis](https://www.youtube.com/watch?v=PwEY-PTEG4s) This video provides a deeper dive into the broader electronics boom in India for 2026, offering context on the market environment in which LG is currently operating. http://googleusercontent.com/youtube_content/0

Lenskart Solutions Q3 Results: Profit Rises 70x and Revenue Increases 38% Year-over-Year
Lenskart Solutions has delivered a landmark performance for the third quarter of FY26, signaling a decisive shift into a high-growth "compounding phase." In its second earnings report since its November 2025 listing, the eyewear giant demonstrated the power of its vertically integrated model, yielding massive gains in both profitability and market penetration. **Exponential Profitability Growth** The headline figure remains a staggering nearly 70-fold increase in consolidated net profit, which reached **131.02 crore** for the December-ended quarter. This is a monumental jump from the **1.85 crore** reported in the same period last year. The surge is attributed to strong operating leverage, where revenue is now scaling significantly faster than the fixed cost base. **Revenue and Operational Scalability** Revenue from operations climbed **38%** year-on-year to reach **2,308 crore**. The domestic market remains the primary engine, with India-specific revenue growing by **40.4%**. International operations also maintained a robust trajectory, growing at **32.7%**. Operating efficiency saw a dramatic improvement. EBITDA rose **90.6%** to **462.4 crore**, with margins expanding to **20%** compared to **14.5%** in the previous year. This expansion reflects structurally improving unit economics and higher product margins, particularly in the premium lens segments. **Aggressive Network Expansion** Lenskart added **195 net new stores** during the quarter—**169** in India and **26** internationally—bringing the year-to-date additions for FY26 to **420 units**. The company now operates over **2,439 stores** in India and **705 stores** overseas. Management highlighted a **28%** same-store sales growth, proving that new outlets are expanding the total market rather than cannibalizing existing traffic. The use of the "GeoIQ" AI algorithm has been central to this data-driven site selection. **Customer Engagement and Market Deepening** The company conducted **6.3 million** eye tests in Q3 alone, a **54%** increase. Notably, nearly half of these were first-time examinations, suggesting Lenskart is successfully tapping into previously unaddressed demand. The Gold membership program reached **8.1 million** active members. Retention remains high, with **37%** of quarterly sales coming from members acquired in prior periods. **Future Strategy and Market Outlook** Lenskart is doubling down on "AI-first" initiatives, including automated eye testing and advanced manufacturing at its upcoming Hyderabad mega-plant. The focus is shifting toward premiumization, with higher-margin brands like Owndays and John Jacobs contributing more to the revenue mix. Despite the stellar results, investor focus remains on the company’s valuation. Following the announcement, the stock settled near **473 per share** on the NSE, as the market weighs the current high P/E multiples against Lenskart’s long-term ability to maintain this level of exponential growth.
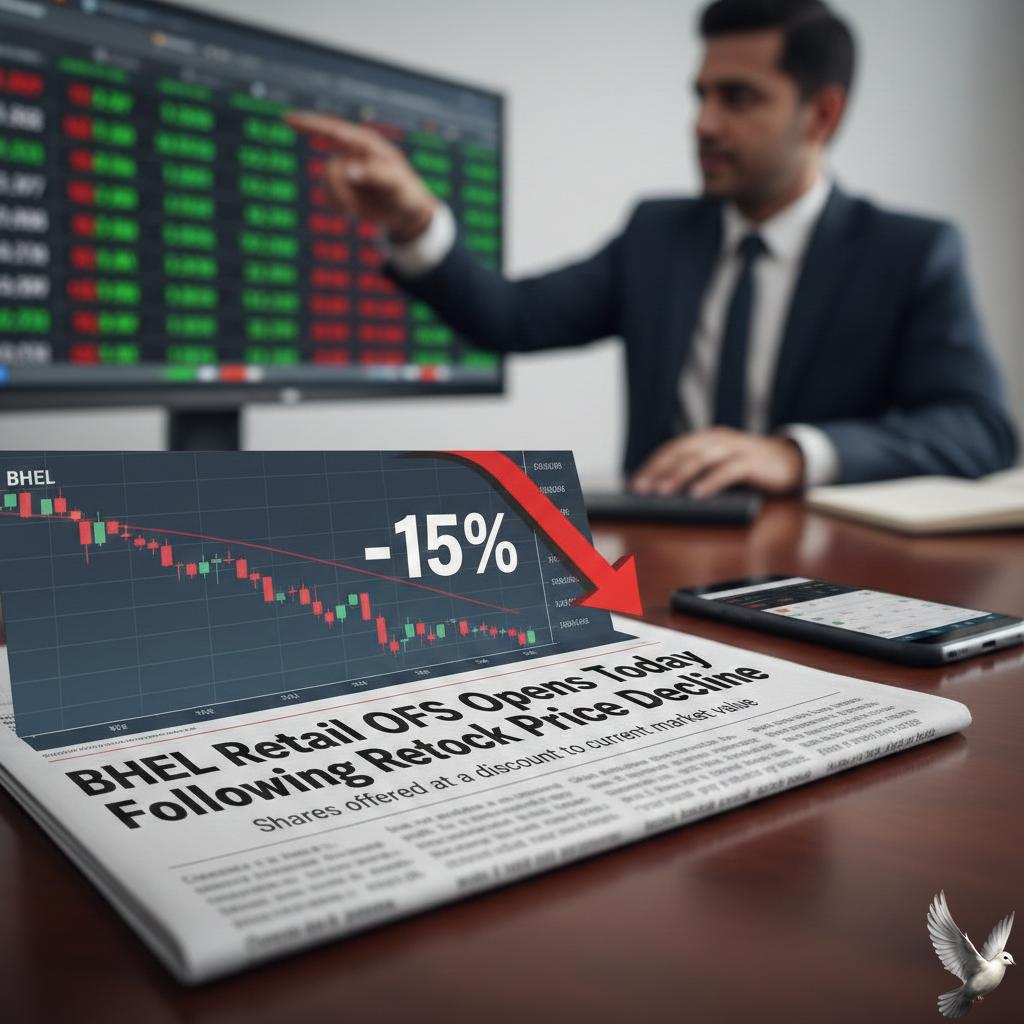
BHEL Retail OFS Opens Today Following Recent Stock Price Decline
BHEL Market Brief: OFS Dynamics and Strategic Outlook Bharat Heavy Electricals Limited (**BHEL**) is currently in the spotlight following the government's announcement of an Offer for Sale (**OFS**) to divest a stake of up to **5%**. The transaction includes a **3%** base stake with an additional **2%** green shoe option. The government fixed the floor price for the OFS at **Rs 254** per share. At the time of the initial announcement, this represented a notable **8%** discount compared to the then-prevailing market price of **Rs 276**. Following the news, the stock experienced a sharp correction in the secondary market. Shares fell approximately **5.4%** to close near **Rs 260**, effectively narrowing the initial discount to a slim **2-3%** for incoming investors. Technical and Market Performance The stock is currently navigating a critical support zone between **Rs 254** and **Rs 260**. Market analysts are closely monitoring these levels, as a sustained move above the floor price would indicate healthy absorption of the new supply. Immediate resistance is identified in the **Rs 276** to **Rs 280** range. Despite the short-term price pressure caused by the stake sale, BHEL continues to demonstrate strong business execution. The company recently secured a significant **Rs 2,800 crore** order for a syngas plant from Bharat Coal Gasification and Chemicals Limited. Operational and Sector Trends BHEL maintains a robust order book exceeding **Rs 2.23 lakh crore**, providing high revenue visibility for the coming years. This is supported by India’s aggressive thermal capacity expansion goals, aiming for **340 GW** by 2047. Profitability is expected to improve as older, low-margin contracts are completed. Analysts project EBITDA margins could expand to **10.7%** by FY28, up significantly from the **4.4%** seen in FY25. Beyond traditional thermal power, the company is diversifying into high-growth segments. It remains the sole domestic manufacturer of nuclear turbine generator sets, positioning it as a key player in India's plan to reach **100 GW** of nuclear capacity by 2047. Macro Context The broader Indian markets remain in a range-bound phase. The **Nifty 50** is hovering around the **25,950** mark, while the **Sensex** remains near **84,233**. Investor sentiment is currently balanced between positive domestic earnings and global cues. Government disinvestments like the BHEL OFS are part of a broader fiscal strategy to enhance market liquidity and increase public shareholding. While such moves often create temporary volatility, they are intended to improve long-term institutional participation in state-run enterprises.

Fractal Analytics IPO Allotment: Check Status on MUFG Intime India, Latest GMP, and Listing Details
Market Brief: Fractal Analytics IPO Finalization The allotment process for the Fractal Analytics IPO is officially scheduled for completion today, February 12, 2026. This landmark issue represents India’s first pure-play enterprise AI firm to enter the public markets, drawing significant attention toward the evolving technology landscape on the BSE and NSE. The 2,833.90 crore offering concluded its subscription phase on February 11 with a final subscription rate of 2.81 times. While the debut was steady, the demand across categories showed a tiered interest level. Qualified Institutional Buyers (QIBs) led the momentum with a subscription of 4.41 times, followed by the retail segment at 1.10 times and non-institutional investors at 1.11 times. Market participants are currently focused on the Grey Market Premium (GMP), which signals a cautious entry. The latest grey market data indicates a premium of approximately 7 to 8 per share, representing a modest 0.8% to 1% gain over the upper price band of 900. This suggests a potential listing price near the 907 to 908 range, pointing toward a relatively flat to stable debut. Investors can verify their allotment status through the official portal of the registrar, MUFG Intime India, or via the BSE and NSE websites using their PAN or application number. For those not receiving an allotment, the refund process is set to initiate on February 13, 2026. Successful applicants will see the shares credited to their demat accounts by February 13, ahead of the official listing date on February 16, 2026. The company’s financial profile shows a robust recovery, reporting a revenue of 2,765 crore in FY25 and a return to profitability with a net profit of 221 crore. The fresh capital of 1,024 crore raised through this issue is earmarked for strategic growth, including debt repayment for its US subsidiary, investment in research and development for the Fractal Alpha business, and the expansion of domestic office infrastructure. While valuation remains a point of discussion among analysts—with the issue priced at a P/E multiple of approximately 79 times based on annualized FY26 earnings—the company’s deep-rooted relationships with Fortune 500 clients and a Net Revenue Retention rate of 121.3% provide a strong fundamental foundation for long-term tracking.

Strong US Jobs Data Drives Dollar Up and Precious Metals Down
Global Metals Market Update: February 12, 2026 The precious metals complex faced a challenging session on Thursday, February 12, as a surge in the U.S. dollar and shifting interest rate expectations pressured major commodities. Gold and silver prices retreated from recent highs following a series of robust economic signals from the United States. Gold and Silver Face Headwinds Spot gold prices fell back toward the **$5,000** per ounce threshold, trading near **$5,080** during the Asian session. This follows a period of high volatility where the metal hit record levels earlier in the month. In domestic markets, gold futures on the MCX settled near **₹1,59,750** per 10 grams, maintaining a fragile position below the **₹1.60 lakh** psychological barrier. Silver experienced a more pronounced decline, with spot prices plunging **2%** to approximately **$82.20**. On the MCX, silver futures moved closer to the **₹2.89 lakh** per kg mark. Despite this sharp correction, silver remains supported by thinning global inventories, which have recently hit 10-year lows on major exchanges. Economic Drivers and the Federal Reserve The primary catalyst for the downward movement was the latest U.S. labor market data. January payroll figures significantly exceeded market forecasts, showing the largest increase in over a year. The unemployment rate also saw an unexpected decline to **4.4%**, reinforcing the narrative of a resilient economy. These "hot" employment figures have effectively cooled expectations for an imminent interest rate cut. Traders have largely pushed back their forecasts for the next Federal Reserve policy easing from June to July 2026. Because gold and silver are non-yielding assets, the prospect of "higher-for-longer" interest rates typically increases the opportunity cost of holding them, leading to price liquidations. Currency Impact and Yields The U.S. Dollar Index (DXY) strengthened in response to the jobs report, making gold more expensive for international buyers. While 10-year Treasury yields showed some softening toward the **4.20%** mark earlier in the week, the resilient economic data has provided a floor for yields, further limiting the upside for precious metals in the short term. Investors are now pivoting their focus toward upcoming inflation data. The Consumer Price Index (CPI) report, expected later this week, will be the next critical indicator. If inflation remains sticky above the **2.7%** level seen in late 2025, it may further cement the Federal Reserve's hawkish stance. Industrial Metals Performance Platinum and palladium showed divergent trends during the session. Platinum prices dipped slightly but remain positioned for a potential long-term rally due to a projected supply deficit of **689,000 ounces** for the 2026 period. Palladium managed to post a slight increase, trading around **$1,772** per ounce. The metal is finding support from supply-side constraints, including the planned closure of major mines in Canada by mid-2026, which is expected to tighten global availability.

US-India Trade Agreement Impacts Renewable Energy Stock Performance
India’s renewable energy sector is entering a high-growth phase following a landmark trade agreement with the United States. Announced in February 2026, the deal slashes tariffs on Indian goods from previous highs of 50% to a standardized 18%. This shift effectively removes the 25% penalty previously imposed on Indian exports, offering a major lifeline to clean energy manufacturers. The market response has been immediate and robust. Major solar and wind energy stocks recorded gains of up to 14% in a single session following the announcement. Waaree Energies saw its shares surge over 11% to reach 3,124.60 INR, while Adani Green Energy advanced 10.43% to 932 INR. Other key players, including Premier Energies and Suzlon, reported jumps of 10% and 5.75% respectively. This trade breakthrough addresses long-standing concerns regarding oversupply in the domestic market. By reopening the U.S. market—India’s largest destination for goods—manufacturers now have a clear path to export high-efficiency solar cells and modules. The 7% reduction in reciprocal tariffs directly improves the cost-competitiveness of "Made in India" products against regional peers in Southeast Asia. On the domestic front, the industry is operating at record capacity. India added a historic 44.5 GW of renewable energy in 2025, nearly doubling the previous year's performance. Solar power remains the primary driver, with installed capacity reaching 132.85 GW. Wind energy also crossed a critical milestone, surpassing 54 GW as of early 2026. Corporate activity remains intense as companies scale to meet both global and local demand. Waaree Energies recently reported a 119% year-on-year increase in sales, while Tata Power’s renewable division saw profits surge 156% in the latest quarter. Adani Power has also signaled a strategic expansion by incorporating a new nuclear energy subsidiary to diversify its non-fossil portfolio. Government support continues to bolster the transition. The Union Budget for 2025-26 increased allocations for the Ministry of New and Renewable Energy by 39%, totaling roughly 256 billion INR. Additionally, GST on solar components was reduced from 12% to 5% to lower manufacturing hurdles. With over 184 GW of capacity currently under implementation or in the bidding pipeline, the sector is well-positioned to meet its long-term goal of 500 GW. The newfound trade certainty with the U.S. transforms the export landscape from a high-risk venture into a primary growth engine for the next decade.

GIFT Nifty and Asian Markets Signal Positive Start for Sensex and Nifty 50
The global semiconductor landscape is currently defined by a massive shift toward AI-centric infrastructure, with market valuations reflecting unprecedented demand. As of mid-February 2026, NVIDIA remains the central pillar of this transition, recently reaching a market capitalization of **$4.5 trillion**. The company’s stock is trading near **$188.54**, maintaining strong support despite broader technology sector volatility. Wall Street sentiment remains overwhelmingly bullish ahead of the February 25 earnings report. Analysts have set an average price target of **$264.20**, with some aggressive forecasts reaching as high as **$352.00**. These projections are fueled by expected revenue of approximately **$65.5 billion** for the final quarter of the fiscal year, a significant jump that highlights the accelerating pace of AI adoption. NVIDIA’s Data Center division continues to be the primary engine of growth, contributing **$51.2 billion** to a total quarterly revenue of **$57 billion** in the most recent reporting cycle. This dominance is supported by a staggering order backlog estimated at **$500 billion**. Hyperscale cloud providers, including Amazon and Alphabet, are projected to spend over **$380 billion** on AI infrastructure this year alone, ensuring a consistent pipeline for high-end silicon. A strategic pivot is now visible in NVIDIA’s production priorities. To address a global RAM shortage and maximize margins, the company has slashed production of its RTX 50-series gaming GPUs. This move prioritizes the Blackwell AI architecture, which is currently in full-scale production. The transition to the next-generation Vera Rubin platform is scheduled for the second half of 2026, promising a **90%** reduction in inference costs and further cementing market leadership. The broader AI chip market is forecasted to reach **$121.73 billion** in 2026, growing at a compound annual rate of nearly **28%** through 2035. While competitors like AMD and Intel are aggressively expanding their accelerator portfolios, NVIDIA’s integrated stack of hardware and CUDA software continues to capture an estimated **60%** of total AI infrastructure spending. Regional developments are also shaping the outlook. In Europe, a new **$1.2 billion** data center in Munich marks a major expansion milestone. Simultaneously, India is emerging as a critical hub, with tax holidays extended until 2047 for foreign firms utilizing local data centers. This policy shift is expected to attract up to **$200 billion** in investment, positioning the region as a vital node in the global AI supply chain. Operational efficiency remains high, with NVIDIA reporting a net profit margin of **56%** and an operating margin of **63.2%**. These figures provide the financial flexibility required for massive research and development into new architectures, such as neuromorphic and photonic computing, ensuring the company remains at the forefront of the next industrial revolution.

US Stocks Close Flat as Strong Jobs Data Reduces Rate Cut Expectations
Market Brief: Global Indices and Economic Outlook Indian equity benchmarks demonstrated a divergent performance during the mid-week sessions. The **Nifty 50** managed to sustain its momentum, closing slightly higher at **25,953.85**, marking a marginal gain of **0.07%**. This performance allowed the index to hold steady above the critical **25,900** support level. Conversely, the **BSE Sensex** snapped a three-day winning streak, ending the session at **84,233.64**, a slight decline of **40 points** or **0.05%**. Market breadth remained mixed as investors weighed local corporate earnings against shifting global cues. In the banking sector, **SBI** rose by **3%**, providing a cushion against heavy selling in the technology space. The **Nifty IT** index faced significant pressure, falling nearly **2%**, led by a **3%** drop in **TCS** shares. Mid-cap and small-cap segments showed more resilience, with the **BSE SmallCap** index surging by **5.4%**, indicating continued retail appetite in broader market themes. Wall Street and Federal Reserve Dynamics US markets displayed a cautious tone following a surprisingly robust labor report. The **S&P 500** remained virtually flat, closing at **6,941.47**. The **Nasdaq Composite** declined by **0.16%** to end at **23,066.47**, while the **Dow Jones Industrial Average** eased by **0.13%** to settle at **50,121.40**. The primary driver for this stagnation was the January jobs data, which revealed the addition of **130,000** new positions and a drop in the unemployment rate to **4.3%**. While a healthy labor market typically signals economic strength, it has effectively cooled expectations for immediate monetary easing. Traders have significantly adjusted their forecasts for interest rate cuts. The **CME FedWatch Tool** now indicates that the probability of a rate reduction in June has fallen to **48%**, as the Federal Reserve appears likely to maintain the current target range of **3.5%–3.75%** for longer than previously anticipated. Sectoral Trends and Commodities Sector-specific movements highlight a shift toward defensive and value-oriented plays. Energy giant **Exxon Mobil** gained **2.6%**, reaching **$155.56**, as investors rotated out of high-valuation software stocks. The semiconductor space saw a notable outlier in **Aehr Test Systems**, which soared over **26%** following a major data center order. In the commodities and currency markets: * **Gold (MCX)** prices surged to **159,609** per 10 grams. * **Brent Crude** outperformed global equities as supply concerns persisted. * The **Indian Rupee (INR)** hovered near its record low, trading at approximately **90.73** against the US Dollar. Global trade projections for **2026** suggest a moderated growth rate of **2.6%**. While the US and China are expected to see a slight cooling in GDP expansion, the broadening of the "AI trade" and steady domestic liquidity through SIP inflows—which remained consistent at **30,002 crore** in January—continue to provide a structural floor for Indian equities.

Yen Gains Against Dollar as Currency Divergence Continues
Market Brief: Global Currency Shift The US dollar is facing a period of notable cooling as of **February 12, 2026**. A combination of domestic labor data and a resurgence in Asian markets has pressured the greenback, causing it to drift toward a weekly decline. While the currency remains underpinned by a resilient domestic economy, traders are increasingly looking toward international growth prospects as alternative avenues for yield. Yen and Yuan Performance The Japanese yen has emerged as a dominant force this week, trading near **152.86** per dollar. Following a significant election victory for the Liberal Democratic Party, the yen has rallied more than **2.6%**, breaking past previous resistance levels. Investors are shifting focus from fiscal concerns to Japan's growth potential, with the currency touching levels as strong as **152.55** in recent sessions. Meanwhile, the Chinese yuan continues to show steady resilience. In offshore markets, the currency has remained firm at approximately **6.9132**, navigating persistent deflationary pressures and trade policy shifts. The stability of the yuan has acted as a localized anchor, even as US-led trade dynamics continue to undergo realignment. US Economic Indicators Recent data from the US Bureau of Labor Statistics has provided a mixed backdrop for the dollar. Nonfarm payrolls for January expanded by **130,000**, significantly exceeding the consensus estimate of **70,000**. This marked the strongest month of job creation in over a year. Additionally, the unemployment rate edged down to **4.3%** from **4.4%** in December. Despite these positive headline figures, the broader 2025 growth narrative was sharply revised. Total new jobs for the previous year were adjusted downward to **181,000**, a massive drop from the initial report of **584,000**. This revision highlights the weakest year of job growth since the pandemic, reinforcing a "fragile but stabilizing" sentiment among market participants. Regional Trends and Outlook The Australian dollar has maintained a steady to upward trajectory, trading at **0.7142** against the US dollar. Hawkish sentiment from the Reserve Bank of Australia, combined with a brightening global growth outlook, has supported the Aussie's position as a favored risk-on currency. Global inflation is currently projected to ease toward **3%** in 2026, though significant divergence remains. In the US, core inflation is expected to remain sticky near **3.0%** before moderating. The Federal Reserve is widely anticipated to maintain a pause on interest rate cuts in its upcoming March meeting, with the CME FedWatch tool indicating a **94.1%** probability that rates will remain unchanged.

U.S.-Iran Tensions Impact Oil Prices
Market Brief: Global Oil Stability and Geopolitical Risk Oil benchmarks are trading with a positive bias as of February 12, 2026, driven by a delicate balance between a significant supply surplus and rising geopolitical friction in the Middle East. Traders are primarily weighing the risk of supply disruptions against recent data showing a substantial increase in domestic stockpiles. Benchmark Performance Brent crude futures currently sit at **$69.74** per barrel, reflecting a gain of **0.49%**. Simultaneously, U.S. West Texas Intermediate (WTI) has edged up by **0.57%** to reach **$65.00** per barrel. These upticks follow a strong session on Wednesday where both markers gained approximately **1%**. Geopolitical Flashpoints The primary catalyst for the current price support is the escalating tension between the United States and Iran. Market participants are monitoring reports that Washington may consider seizing tankers carrying Iranian crude. Furthermore, the potential deployment of a second aircraft carrier group to the Middle East has added a "war premium" to prices, estimated by some analysts at roughly **$4.00** per barrel. While diplomatic talks in Oman have shown some movement, the threat of military strikes remains a central concern for energy security. U.S. Inventory Dynamics Counteracting the geopolitical heat is a massive surge in U.S. commercial crude inventories. Recent data from the Energy Information Administration (EIA) reveals a jump of **8.5 million barrels**, bringing total stocks to **428.8 million barrels**. This build significantly outperformed market expectations, which had anticipated a much smaller move. While inventories remain about **3%** below the five-year average, the sheer scale of the weekly increase suggests a well-supplied domestic market. Global Supply and Demand Outlook OPEC+ has maintained a cautious stance, confirming it will keep production targets unchanged through the first quarter of 2026. This pause in output hikes by the eight-member core group, including Saudi Arabia and Russia, is intended to stabilize the market during a period of seasonally lower demand. Looking ahead, the International Energy Agency (IEA) projects a global oil surplus of approximately **3.8 million barrels per day** for the full year 2026. This forecast is supported by rising production from non-OPEC+ nations, including the U.S., Brazil, and Guyana. * **Demand Growth:** OPEC maintains its 2026 growth forecast at **1.4 million barrels per day**. * **Price Targets:** Analysts suggest a sustained break above **$66.00** for WTI would require further regional escalation, while de-escalation could trigger profit-taking toward the **$60.00** level. The market remains in a tug-of-war between a long-term supply glut and immediate security risks that could threaten critical transit points like the Strait of Hormuz.

Peter Lynch on the Financial Impact of Preparing for Market Corrections
Market performance as of February 2026 continues to demonstrate the high cost of hesitating on the sidelines. Despite a backdrop of shifting global debt and geopolitical tensions, major indices are maintaining a strong upward trajectory. In the first half of February, the Dow Jones and S&P 500 have shown significant gains, while India’s Nifty 50 recently jumped 3.5% to reach the 25,694 level. Volatility remains a constant factor, with the India VIX recently dropping 21% to 12.01, indicating a temporary cooling of fear. However, the wider market environment is marked by "air pockets"—sharp, short-lived corrections that often trigger panic selling. Recent data shows that investors who missed just 30 of the best trading days over a 30-year period destroyed 83% of their potential total returns. Peter Lynch’s classic observation holds true today: more money is lost preparing for corrections than in the corrections themselves. In 2025, while the S&P 500 returned 25.02%, the average equity fund investor earned only 16.54%. This 8.48% performance gap is largely attributed to behavioral errors—buying after rallies when confidence is high and selling during dips when fear takes over. Current economic indicators provide a complex signal for those attempting to time the market. The U.S. Federal Reserve has held interest rates steady at 3.5% to 3.75%, while India is undergoing a major "inflation reset" by updating its CPI and GDP base years. These structural shifts create noise that frequently misleads short-term traders but offers little threat to disciplined, long-term holders. Systematic Investment Plans (SIPs) continue to prove their efficacy in this environment. In the past year, 97% of SIP schemes delivered positive returns, with some investor returns climbing as high as 37%. These results highlight that staying invested through volatility allows for the accumulation of more units at lower prices, which is essential for wealth compounding. Asset allocation remains a primary driver of stability. A balanced, equal-weighted portfolio across equity, debt, and gold has delivered a 10-year compounded return of 13%, successfully cushioning drawdowns during stressful periods. While equities remain the decade's top performer, the inclusion of gold has provided a critical hedge during recent periods of dollar weakness. The core message for February 2026 is that time in the market consistently beats timing the market. With global GDP expansion increasingly driven by emerging markets like India—now contributing 18% to global growth—the risk of being "out of the market" is far greater than the risk of a temporary downturn. Patience and diversification remain the most reliable tools for navigating the current high-valuation environment. [How to be a long-term investor](https://www.youtube.com/watch?v=akn48UBqyDk) This video provides a deep dive into navigating global macro pressures and the importance of maintaining a disciplined investment strategy during the shifting liquidity trends of early 2026. http://googleusercontent.com/youtube_content/0

Daily Market Outlook and Trading Strategy
Indian Market Brief: February 12, 2026 Indian benchmark indices concluded the February 11 session with a flat performance, characterized by narrow range-bound movement and high-level consolidation. The Nifty 50 managed a marginal gain of **18.70 points** or **0.07%**, closing at **25,953.85**. Meanwhile, the S&P BSE Sensex snapped its three-day winning streak, sliding **40 points** or **0.05%** to end at **84,233.64**. Market action saw the Nifty 50 reclaim the psychological **26,000** mark in early trade, reaching an intraday high of **26,009.40**. However, aggressive call writing at this strike price triggered overhead supply, forcing the index to pare gains. Technical analysts noted the formation of a small-bodied bearish candle with a lower shadow, signaling that while resistance is stiff, buying interest remains resilient at lower levels. Sectoral performance was starkly divided. The Nifty Auto index led the gainers, surging approximately **2%** on the back of strong Q3 results from Eicher Motors, which jumped **6.5%**. Healthcare and Pharma followed, rising over **1%** as Apollo Hospitals posted a **35%** increase in net profit. Conversely, the IT sector was the primary laggard, dropping nearly **1.8%** as heavyweights like TCS and Infosys faced profit-taking amid cautious global tech sentiment. Institutional activity provided a supportive floor for the markets. Foreign Institutional Investors (FIIs) remained net buyers for the third consecutive session, injecting **943.80 crore** into the cash segment. Domestic Institutional Investors (DIIs) showed slight profit-booking, recording a net sell value of **125.40 crore**. This institutional divergence suggests a shift toward global-macro-driven optimism balanced by domestic rebalancing. Key technical indicators maintain a constructive outlook despite the sideways movement. The Nifty continues to trade above its **20-day Moving Average (20DMA)**, and the Relative Strength Index (RSI) remains in a bullish crossover zone near **58**. Immediate support is firmly established at the **25,800–25,900** band, while a decisive daily close above **26,020** is required to unlock a potential rally toward the **26,300** level. Broader market sentiment remains stable as the India VIX fell **1.01%** to settle at **11.55**. This low volatility indicates a lack of panic among investors, who are now shifting focus toward upcoming monthly inflation data and the finalization of the US-India trade agreement. High-volume activity was concentrated in counters like Vodafone Idea and Tata Steel, reflecting continued interest in specific corporate developments and earnings outperformance.