Bullish News
Collection
Moody's Projects $100-250 Million Cost to IT Sector From US Visa Fee Increase
The Indian IT sector is currently navigating a significant structural shift as new US immigration policies and a massive surge in artificial intelligence investments redefine the industry landscape for 2026. Market sentiment remains cautiously optimistic despite recent volatility. On February 11, 2026, the BSE 100 index edged up 0.13%, with large-cap IT stocks like Tech Mahindra seeing technical upgrades to bullish status. Overall industry revenue is projected to reach $350 billion by the end of 2026, contributing nearly 10% to India’s GDP. The most pressing challenge is the new US H-1B visa fee structure effective since late 2025. New visa applications now carry a one-time fee of $100,000, a staggering increase from the previous $2,000 to $5,000 range. Moody’s estimates this change will raise operating costs for major Indian IT firms by $100 million to $250 million annually. This fee hike represents approximately 1% of total revenues for industry giants. While top-tier firms like TCS and Infosys possess the cash reserves to absorb these costs, mid-sized companies are facing intensified margin pressure. Analysts suggest the move could erode EBIT margins by 50 to 150 basis points per H-1B employee. In response, the sector is accelerating a pivot toward local hiring in the US and expanding Global Capability Centers (GCCs) within India. Local US hiring is expected to rise by 12% to 18% through 2027. This strategy aims to de-risk operations from further visa restrictions and a proposed 25% tax on outsourcing payments currently under discussion. Artificial Intelligence is now the primary engine of growth. India’s AI market is on track to hit $28.8 billion this year, growing at a 45% compound annual rate. Large firms have already trained over 60% of their workforce in GenAI to secure high-value contracts in the banking and healthcare sectors. Revenue growth for FY26 is forecasted at a moderate 4% to 6% as clients remain selective with discretionary spending. However, operating margins are expected to hold steady at 22.5% to 23.0% due to aggressive cost-control measures and a sharp decline in attrition rates, which have stabilized at approximately 13%. Investment flows reflect this transition. While domestic institutional investors have recently booked profits, foreign institutional investors returned as net buyers in February 2026. This indicates growing confidence in the sector’s ability to transition from a low-cost labor model to a high-value, AI-driven digital services provider.
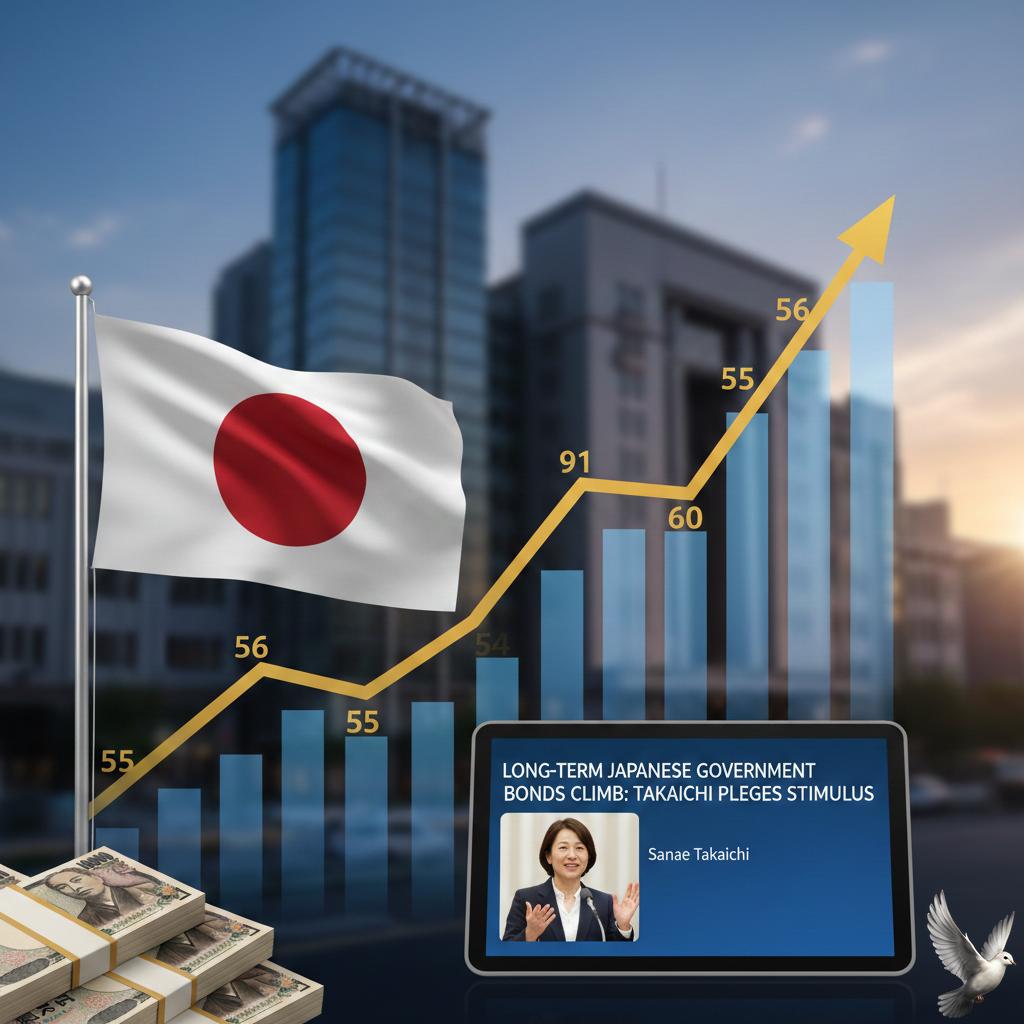
Long-term Japanese Government Bonds Rise as Takaichi Pledges Stimulus Measures
Japanese government bonds experienced a significant rally this Thursday, February 12, as investors responded to Prime Minister Sanae Takaichi’s post-election commitment to "responsible" fiscal stimulus. Following a landslide victory on February 8, Takaichi moved to soothe market anxiety regarding her expansionary spending plans, which previously triggered a spike in yields to multi-decade highs. Long-term yields saw sharp declines as the market digested the administration's pledge to fund strategic investments without issuing fresh deficit-covering bonds. The yield on the 40-year JGB, the market’s longest tenor, fell by 8 basis points to 3.64%. Similarly, the 30-year yield sank by 7.5 basis points to reach 3.05%, while the benchmark 10-year JGB yield retreated to approximately 2.19%, nearing one-month lows. This bond recovery reflects a shift in sentiment toward Takaichi’s "responsible proactive fiscal policy." The Prime Minister aims to fund a 21 trillion yen stimulus package and a two-year suspension of the food consumption tax by reviewing subsidies and non-tax revenues rather than relying solely on debt. However, total national debt reached a record 1,342.17 trillion yen at the end of last year, maintaining a baseline of caution among institutional holders. While fiscal concerns have temporarily eased, the broader interest rate environment remains in transition. The Bank of Japan (BoJ) raised its short-term policy rate to 0.75% in December and is widely expected to continue its normalization path. Market pricing currently suggests a high probability of another rate hike in April, with analysts forecasting a potential move toward 1.00% by the end of the year. Economic indicators provide a mixed backdrop for these policy shifts. Japan’s economy is growing at a moderate pace, with real GDP growth projected at 1.2% for 2025. Core inflation persists around 2.7%, fueled by rising import costs and a weak yen, which has recently traded between 153 and 160 against the US dollar. Equities have largely benefited from the "Takaichi trade," with the Nikkei 225 gaining over 10% since the beginning of the year. Investors remain focused on sectors positioned for government support, including defense, semiconductors, and nuclear energy. Despite the current bond rally, the long-term outlook for JGBs remains sensitive to the BoJ’s next moves and the government's ability to maintain its "sustainable" spending narrative without further straining the nation’s debt-to-GDP ratio.
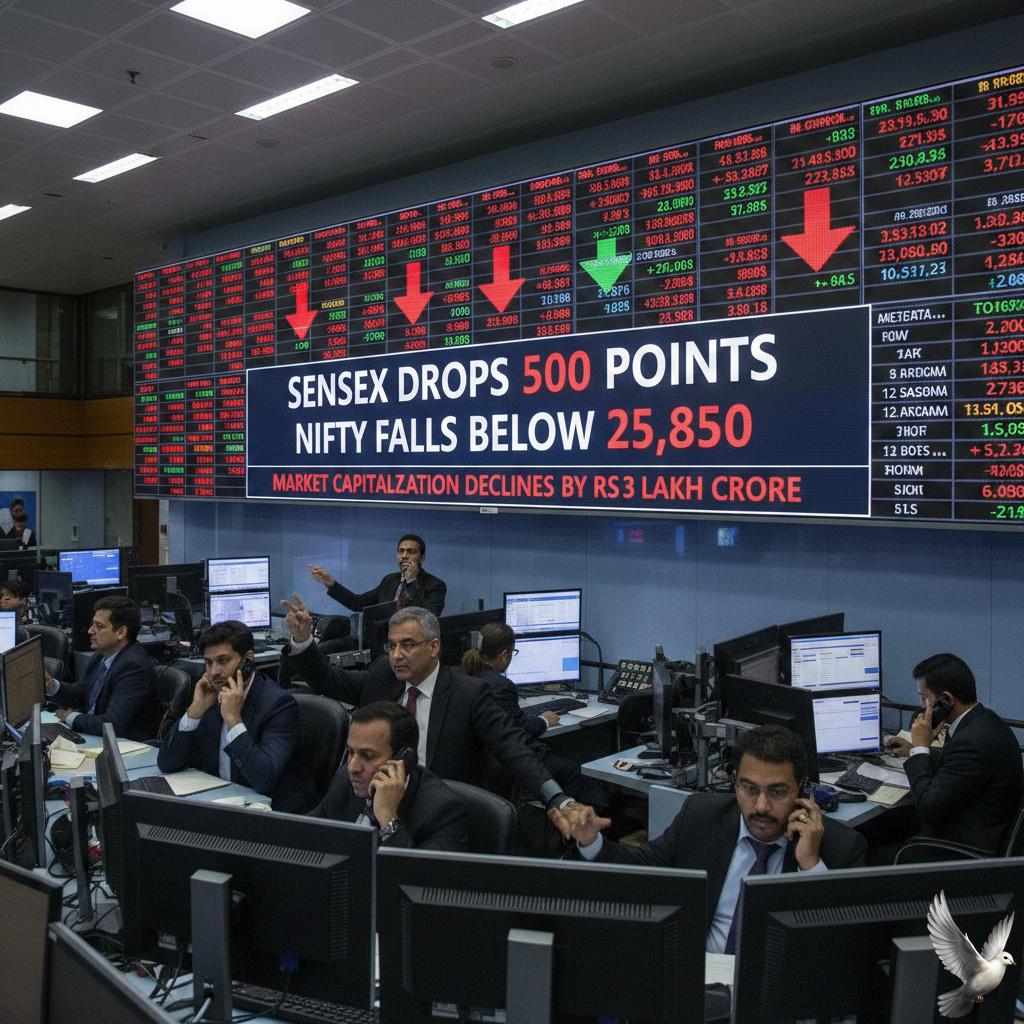
Sensex Drops 500 Points and Nifty Falls Below 25,850 as Market Capitalization Declines by Rs 3 Lakh Crore
Indian benchmark indices faced significant downward pressure on **February 12, 2026**, as a combination of global macroeconomic shifts and sector-specific disruption triggered widespread selling. The **S&P BSE Sensex** declined **376.48 points** or **0.44%** to settle at **83,862.16**, while the **Nifty 50** fell **116.65 points** or **0.45%** to finish at **25,838.15**. Investor sentiment was dampened by stronger-than-expected **U.S. labor market data**, which showed Nonfarm Payrolls rising by **130,000** in January. This robust performance has caused markets to pivot, with the probability of a Federal Reserve rate cut in March now being largely dismissed. Financial markets are pricing in a **94%** likelihood that rates will remain unchanged, pushing potential easing further into the second half of the year. The **Nifty IT index** bore the brunt of the sell-off, plunging **4.55%** in a single session. This move extends a brutal start to the year for the tech sector, which has seen the index tank over **11%** in **2026** so far. The latest trigger is the launch of **Anthropic’s Claude Cowork**, an agentic AI tool capable of automating complex, multi-step tasks traditionally handled by offshore delivery teams. Market valuation for Indian IT majors saw a massive erosion, with nearly **Rs 2.5 lakh crore** wiped out over the last three trading sessions. High-profile stocks led the decline: **Infosys** fell **4.67%**, **Tech Mahindra** dropped **4.39%**, and **TCS** slipped **4.21%**. Analysts have labeled the shift a **SaaSpocalypse**, as AI agents begin to replace human-led software maintenance and document processing. While technology struggled, internal market rotation provided minor support to other sectors. The **Nifty Private Bank** index managed a marginal gain of **0.11%**, led by **ICICI Bank** which rose **1.35%**. **FMCG** and **Auto** stocks also showed relative resilience, as investors moved capital away from growth-oriented tech and into defensive value segments. The broader market reflected a weak breadth, with **1,986 shares** declining compared to **1,241** advances on the BSE. Mid-cap and small-cap indices underperformed the benchmarks, dropping **0.77%** and **0.86%** respectively. Foreign Portfolio Investors (FPIs) remain cautious, contributing to the volatility as they reassess the impact of AI on the **$250 billion** Indian outsourcing model. The domestic currency and bond markets also reacted to the shifting global outlook. The **Indian Rupee** hovered around **90.49** against the US Dollar, while the yield on the **10-year benchmark federal paper** rose to **6.727%**. With **U.S. CPI inflation** data due later this week, traders are bracing for continued volatility in the near term.
AI Sector Outlook: Short-Term Volatility and Long-Term Growth Potential for IT Firms
The Indian IT sector is navigating a volatile period as of February 2026, characterized by a sharp tug-of-war between immediate sentiment-driven sell-offs and robust long-term growth projections. Current Market Performance The **Nifty IT Index** has faced significant downward pressure, recently trading around the **35,000 to 35,100** mark. On a weekly basis, the sector has seen a sharp decline of approximately **7.5%**, making it one of the worst-performing segments in early 2026. Market heavyweights have led this retreat: * **Infosys** and **TCS** saw single-day drops between **7% and 7.3%** in early February. * **HCL Technologies** and **Tech Mahindra** followed with declines of over **4%**. This sell-off was largely triggered by a rout in global software stocks, fueled by fears that advanced generative AI tools from competitors like Anthropic and OpenAI could disrupt traditional outsourcing models. Global AI and China Competition Sentiment is currently dominated by "AI jitters." As AI shifts from experimentation to a mature enterprise backbone in 2026, investors are concerned about a "Silicon Tax." High-bandwidth memory shortages and rising costs for AI-ready hardware are putting a squeeze on IT budgets. Furthermore, China’s aggressive expansion in open-source AI and high-efficiency training methods—exemplified by recent breakthroughs from firms like DeepSeek—is intensifying the race for global IT dominance. This has led to tactical selling in Indian equities as global funds reassess the competitive landscape. Structural Growth Drivers Despite the market noise, the sector's fundamental outlook remains massive. India's IT industry is on track to reach **$350 billion** by the end of 2026, contributing nearly **10%** to the national GDP. The growth is shifting from volume-based execution to high-value "Cloud 3.0" services: * **Data Centers:** Capacity is projected to double by 2027, driven by a **77%** increase in AI workloads. * **AI Market:** India’s domestic AI segment is growing at a **45% CAGR**, expected to hit **$28.8 billion** shortly. * **Budget Support:** The Union Budget 2026-27 has allocated over **₹53.5 lakh crore** for long-term blueprints, including incentives for global data centers and an **₹8,000 crore** boost for AI infrastructure. Strategic Transition The current "short-term pain" reflects a sector in transition. While traditional software maintenance faces automation risks, Indian firms are successfully repositioning as customization experts for sovereign cloud and private AI models. Total Contract Values (TCV) remain strong across the board, even if revenue conversion cycles have lengthened. The consensus among analysts is that the current dip represents a valuation correction rather than a structural failure, with long-term resilience anchored in India’s role as the world’s primary hub for AI implementation and data governance.
TCS Market Capitalization Drops Below Rs 10 Lakh Crore Following 52-Week Low
The Indian IT sector is currently navigating a period of significant volatility. Tata Consultancy Services (TCS), the nation’s largest software services provider, has witnessed a sharp decline in its market valuation. During the trading session on February 12, 2026, TCS shares plunged 4.5% to hit a new 52-week low of 2,776 INR. This downward movement has pushed the market capitalization of TCS below the 10 lakh crore INR threshold, a major psychological level. The erosion in value has also resulted in a shift in corporate rankings, with State Bank of India (SBI) overtaking TCS to become the fourth most valuable listed company in India. The sell-off is not isolated to TCS but has permeated the entire sector. The Nifty IT index dropped by 4.6% in a single day, marking it as the worst-performing sectoral index. Heavyweights like Infosys and Wipro also recorded losses between 4% and 5%. In total, the rout wiped out approximately 1.3 lakh crore INR in market wealth across the IT landscape. Two primary factors are driving this bearish sentiment. First, global concerns regarding artificial intelligence disruption have intensified. The recent unveiling of advanced automation tools by AI startup Anthropic, specifically targeting corporate legal and compliance workflows, has sparked fears that traditional IT service models are being replaced rather than enhanced by AI. Second, macroeconomic data from the United States has dampened hopes for imminent relief. Stronger-than-expected US jobs data, with unemployment falling to 4.3%, suggests that the Federal Reserve may maintain higher interest rates for a longer duration. This has led to a cautious outlook on global tech spending and near-term rate cuts. Despite the market pressure, there are subtle signs of internal stabilization. Recent reports indicate that active tech job openings in India rose 8% month-on-month to 109,000 in February, the first significant uptick in six months. However, demand remains concentrated in mid-to-senior levels, while entry-level hiring remains flat. Analysts maintain a cautious stance on the sector's recovery. The ongoing shift from traditional software services to AI-first organizational structures is expected to keep margins under pressure. For now, the divergence in the Indian market remains clear, with investors rotating funds away from IT and into high-performing sectors like banking and automotive. [TCS Stock Analysis: AI Impact & Market Cap Update](https://www.youtube.com/watch?v=XyvL5WUoLAU) This video provides a breakdown of the recent market capitalization losses within the Tata Group and the specific challenges facing TCS in the current economic climate. http://googleusercontent.com/youtube_content/0

Nikkei 225 reaches 58,000 as Japanese yen and bonds rise following election results
Japan’s financial markets have entered a historic era as the Nikkei 225 share average surged past the 58,000 mark for the first time in history. This milestone, reached on February 12, 2026, solidifies a massive rally triggered by the Liberal Democratic Party’s landslide election victory. Prime Minister Sanae Takaichi’s secure mandate has fueled what traders are calling the "Takaichi trade." Investors are responding to her ambitious fiscal policy, which includes a proposed 21 trillion yen stimulus package and a landmark two-year suspension of the 8% food consumption tax. The benchmark index gained 0.3% to hit the 58,000 level, marking a rare "triple rally" where domestic equities, government bonds, and the yen all climbed simultaneously. Technology, defense, and semiconductor stocks are leading the charge, supported by expectations of increased strategic government spending in AI and infrastructure. The currency market remains highly active. The yen has strengthened to approximately 154.39 per dollar, recovering from recent lows. This rebound is driven by the rise in bond yields and verbal warnings from government officials regarding potential currency intervention. Top diplomats have signaled they are monitoring moves with a high sense of urgency to prevent excessive volatility. In the fixed-income sector, the 10-year Japanese Government Bond (JGB) yield has climbed to 2.24%, reflecting expectations of higher inflation and increased government borrowing. Longer-dated debt is also seeing pressure, with 30-year yields holding near 3.50%. These levels represent some of the highest borrowing costs for Japan in decades. While the market is buoyed by political stability, analysts are beginning to flag risks of overheating. Investors are closely watching for profit-taking as the Nikkei approaches the psychological 60,000 barrier. Concerns persist regarding the sustainability of Japan’s debt-to-GDP ratio, which remains the highest in the developed world. Corporate Japan is contributing to the bullish sentiment with record share buybacks projected for fiscal 2025. Strong fourth-quarter earnings and a focus on corporate governance reforms are encouraging the deployment of excess cash into domestic investments, further insulating the market from external global pressures.

US-India Trade Deal Sparks FII Interest Amid AI-Driven Earnings and Employment Concerns: Saurabh Mukherjea
Market Brief: India’s Dual-Track Transition Foreign Institutional Investors (FIIs) are staging a cautious return to Indian equities, spurred by the recent **US-India Interim Trade Framework**. Following months of heavy selling, institutional sentiment turned positive in early February 2026. On February 11, FIIs became net buyers with an inflow of **₹943.81 crore**, building on a **₹2,254.64 crore** purchase earlier in the week. This renewed interest is supported by a significant decline in the US Dollar index and stable crude prices, which have improved the risk appetite for emerging markets. Earnings Growth and Valuation Headwinds Despite the capital inflows, the market faces a "confidence gap" regarding corporate earnings. While the **Sensex** and **Nifty 50** maintain levels around **84,312** and **25,947** respectively, analysts warn that earnings growth has not yet justified recent policy stimuli. Even with **125 basis points** in cumulative rate cuts and substantial tax incentives, broader corporate performance remains uneven. Domestic Institutional Investors (DIIs) have transitioned into a profit-booking phase, recording a net sell of **₹125.36 crore** in the latest session, reflecting a shift toward valuation-conscious positioning. The Artificial Intelligence Inflection Artificial Intelligence has shifted from a theoretical risk to a primary driver of market volatility. The **Nifty IT index** fell more than **4%** in a single session this week, extending a year-to-date decline of **11%**. This downward pressure stems from a structural weakening of the link between revenue growth and job creation in the technology sector. The **Economic Survey 2026** recently highlighted a **10% to 20%** risk of a global AI-driven "infrastructure correction" that could disrupt funding for traditional IT services. * **Role Redefinition:** Routine digital tasks such as data processing and basic analysis are seeing rapidly diminishing demand. * **Consolidation:** The traditional "low-cost" labor model is being challenged as AI performs these tasks faster and at a lower price point. * **Talent Mismatch:** While **76%** of recruiters still expect new job creation in H1 2026, the focus has shifted entirely toward "AI-fluent" roles. Strategic Outlook The Indian market is currently a tug-of-war between two forces. On one side, the trade agreement positions India as a vital global supply chain alternative, attracting long-term foreign capital. On the other, the IT and services sectors—the historical backbone of the white-collar economy—are undergoing a painful transformation. Companies that fail to move beyond surface-level AI adoption (such as basic chatbots) toward deep business model reinvention face significant risk. Investors are increasingly rotating capital into domestic manufacturing and infrastructure, where order visibility remains high and AI disruption is currently less direct. This [Deep dive into India's 2026 market outlook](https://www.youtube.com/watch?v=akn48UBqyDk) provides a detailed breakdown of how global liquidity and domestic growth engines are shaping current investment trends. The video features expert analysis from a leading financial strategist on the specific macroeconomic pressures and trade dependencies affecting the Indian market today. http://googleusercontent.com/youtube_content/0

Neeraj Dewan on Market Outlook: Value in SBI, Strong CV Cycle, and IT Volatility Concerns
Market sentiment remains firmly optimistic regarding Public Sector Undertaking (PSU) banks, as the sector continues to ride a wave of record-breaking earnings and historical milestones. State Bank of India (SBI) recently achieved a landmark moment, hitting a new all-time high of 1,197.95 on February 12, 2026. This surge allowed SBI to overtake TCS, becoming India’s fourth-largest listed company by market capitalization, which now stands at approximately 10.92 lakh crore. The bank’s financial health provides a strong foundation for this rally. SBI reported its highest-ever quarterly net profit of 21,208 crore for the third quarter, representing a 24% year-on-year growth. This performance was driven by a 9% increase in net interest income to 45,190 crore and a significant improvement in asset quality, with the gross non-performing asset (NPA) ratio dropping to 1.57%. Analysts suggest that despite the recent peak, the stock remains a constructive "buy-on-dips" opportunity given its dominant 50% share of the PSU banking market cap and stable domestic margins. The commercial vehicle (CV) sector is also witnessing a robust structural turnaround, fueled by a resurgence in infrastructure capital expenditure. Following the rationalization of GST from 28% to 18%, the industry is eyeing its best financial year in history. Retail sales for January 2026 jumped 15.07% year-on-year to 107,486 units. Growth is visible across all segments, with light commercial vehicles (LCVs) rising 14.94% and heavy commercial vehicles (HCVs) gaining 14.61%. The government’s 12.2 lakh crore allocation for capital expenditure in the latest budget serves as a massive tailwind for players like Tata Motors and Ashok Leyland. With the average age of the national fleet at an 11-year high, replacement demand is expected to sustain high sales volumes through FY2026 and FY2027. Rising utilization in mining and construction further supports this bullish outlook, positioning the CV sector as a primary gauge of India's accelerating economic activity. In contrast, caution is the prevailing theme for the IT sector. While the broader market celebrates banking gains, technology stocks have faced pressure due to volatility and structural shifts. The India AI Impact Summit 2026, held in mid-February, highlighted the massive push toward artificial intelligence, yet also underscored the potential for disruption in traditional services. Major IT firms are navigating a period of uncertainty as AI-led pricing pressures and shifting global tech spending weigh on sentiment. While big tech leaders like Nvidia and OpenAI are expanding their Indian footprint, traditional IT service counters have seen market rotation favor banks and industrial sectors. This divergence reflects a tactical shift in investor preference toward domestic cyclicals over global-facing technology firms.
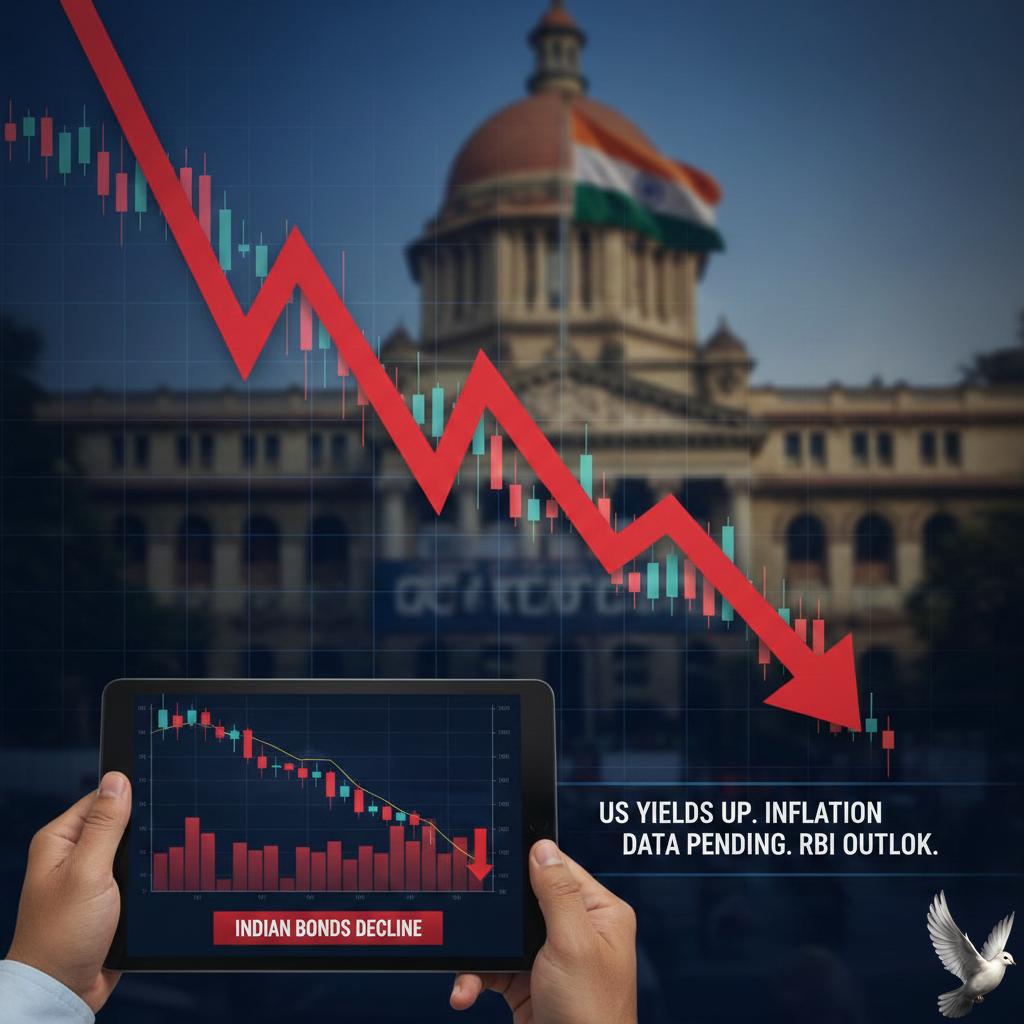
Indian Bonds Decline Amid Rising US Yields and Impending Inflation Data
Indian government bonds registered a slight dip in early Thursday trading, reflecting a cautious mood across domestic debt markets. This movement was primarily driven by a rise in U.S. Treasury yields, which climbed to 4.18% following resilient labor market data. Such global shifts often prompt a defensive stance among Indian investors as they recalibrate the spread between domestic and international returns. The 10-year benchmark bond yield is currently hovering near 6.72%, after touching recent highs of 6.78% earlier in the month. Market participants are closely monitoring the 6.80% resistance level, as persistent supply pressures from state-level borrowing continue to weigh on the secondary market. Investors are now positioned for the release of critical domestic inflation data. Market consensus suggests January's consumer price inflation may land near 2.4%, which remains well within the Reserve Bank of India’s target range of 2% to 6%. However, today marks a significant shift as the government officially transitions to a new Consumer Price Index series with 2024 as the base year. This update reduces the weight of food items to approximately 36.8%, potentially altering future inflation trajectories. Domestic policy remains a stabilizing factor. The Reserve Bank of India recently held the repo rate steady at 5.25% during its February meeting, maintaining a neutral stance. While the central bank nudged its full-year inflation forecast for 2025-26 slightly upward to 2.1%, the broader outlook for food supply remains positive due to strong agricultural production. Liquidity conditions also remain a point of focus. Although the RBI has refrained from fresh liquidity injections, system liquidity has averaged a surplus of 70,000 crore. Traders are balancing this against a heavy borrowing calendar, with record gross market borrowing for the upcoming fiscal year set at 17.2 trillion. The intersection of a shifting global rate environment and domestic structural updates to inflation reporting has kept trading volumes focused on short-term adjustments. Markets remain sensitive to any deviations in today’s 4:00 PM inflation print, which will set the tone for the final weeks of the current fiscal quarter.
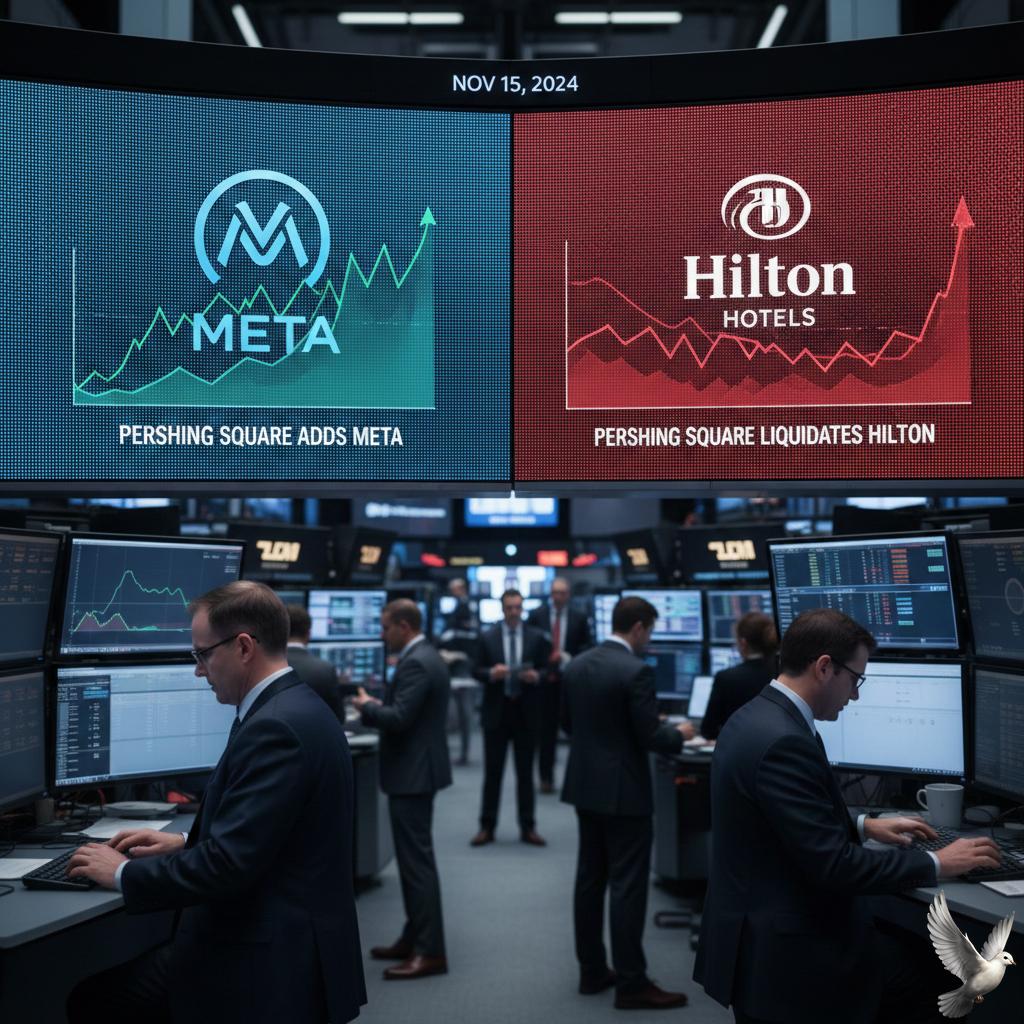
US Stocks: Pershing Square Adds Meta and Liquidates Hilton Position
Bill Ackman’s Pershing Square Capital Management has executed a strategic pivot in its portfolio, revealing a **$2 billion** high-conviction investment in Meta Platforms. This allocation represents approximately **10%** of the fund’s total capital and marks a major shift toward AI-enabled growth. To fund this entry, Pershing Square fully exited its position in Hilton Worldwide Holdings. The move underscores a transition from traditional consumer franchises toward technology platforms that Ackman believes are trading at a significant discount relative to their future earnings potential. Market Performance and Valuation As of February 2026, Meta’s market capitalization stands at approximately **$1.7 trillion**. While the stock has seen a **7.4%** decline over the last twelve months, Pershing Square’s tactical entry in late 2025 has already generated incremental gains. The share price rose **11%** in 2025 following the fund's entry and added another **3%** through early February 2026. Despite recent volatility, market analysts estimate Meta’s intrinsic value could reach as high as **$1,080** per share. Current trading prices near **$670** suggest the market may be underappreciating the long-term structural advantages of the company's aggressive infrastructure spend. AI Integration and Financial Growth Meta’s recent financial results for Q4 2025 support this optimistic outlook. The company reported revenue of **$59.89 billion**, a **24%** year-over-year increase, beating analyst estimates. Earnings per share (EPS) reached **$8.88**, significantly higher than the projected **$8.19**. The growth is largely attributed to AI-driven performance gains across its "Family of Apps." Key operational metrics include: * **$10 billion** revenue run-rate for AI video generation tools. * **30%** increase in Instagram Reels watch time in the U.S. * **24%** lift in incremental conversions via new AI attribution models. * **25%** more same-day Reels surfaced on Facebook through improved ranking. Strategic Outlook for 2026 Meta has signaled a massive expansion in capital expenditures, projecting a range of **$115 billion to $135 billion** for 2026. This capital is earmarked for the "Meta Superintelligence Labs" and general AI infrastructure. Total expenses for the year are expected to fall between **$162 billion and $169 billion**. Pershing Square maintains that these investments will unlock new layers of engagement through digital assistants and wearable technology. While the Reality Labs division continues to report operating losses—reaching **$6.02 billion** in the most recent quarter—management expects these losses to peak in 2026 before declining. The hedge fund's 2025 return of **21%** provides a backdrop of strong performance as it bets on Meta becoming a core alpha driver. By focusing on AI's ability to refine advertising efficiency and content recommendations, Pershing Square is positioning itself for a period of platform compounding.
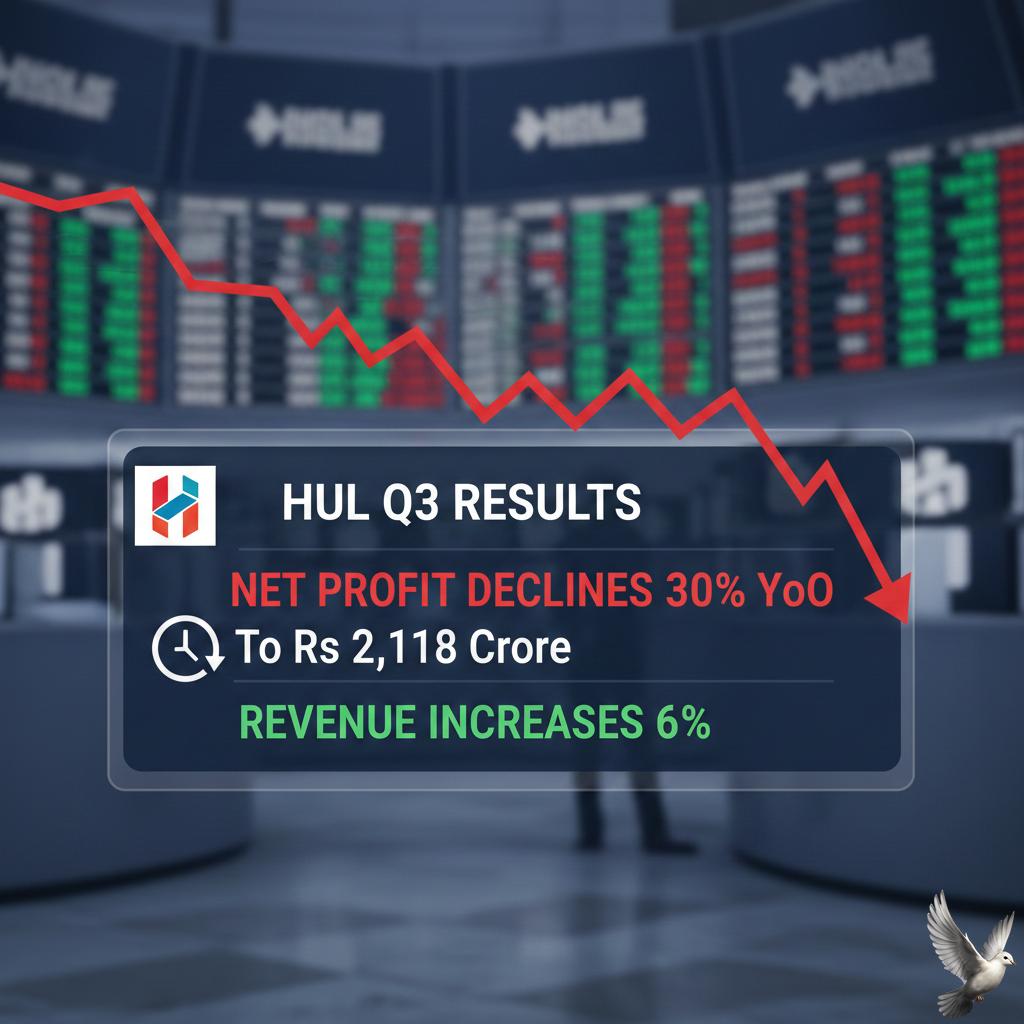
HUL Q3 Results: Net Profit Declines 30% YoY to Rs 2,118 Crore While Revenue Increases 6%
Hindustan Unilever Limited (HUL) has demonstrated financial resilience in a complex economic landscape, reporting a revenue of 16,441 crore for the third quarter. This represents a 5.6% year-on-year increase from 15,556 crore. The company’s performance highlights its ability to maintain steady growth despite fluctuating consumer sentiment and a challenging input cost environment. As of February 12, 2026, HUL’s stock is trading at approximately 2,417.60, showing a year-to-date return of 6.61%. The company maintains a massive market capitalization of 5.68 lakh crore, reinforcing its position as the leading force in India’s FMCG sector. Investor focus remains sharp on the stock's 52-week range, which has fluctuated between 2,136.00 and 2,750.00. Operational highlights show a strategic shift toward high-growth segments. The recent acquisition of a 90.5% stake in the skincare brand Minimalist for 2,955 crore marks a significant expansion into the premium Beauty & Wellbeing category. Additionally, the demerger of the ice cream business, specifically the Kwality Wall’s brand, into a separate listed entity is expected to unlock further shareholder value. The broader FMCG sector is currently navigating the impact of the GST 2.0 reforms implemented in late 2025. These reforms slashed rates on essential goods from 18% to 5%, a move that HUL has leveraged to pass on price benefits to consumers. This tax transition has stimulated volume growth, particularly in rural markets where demand is expanding at nearly double the rate of urban centers. Segment-wise performance remains varied but robust. The Home Care division led the charge with a 6% sales increase, supported by strong demand for fabric wash and household cleaning products. While Beauty & Wellbeing saw more modest growth, the integration of new digital-first brands is expected to bolster margins in the coming quarters. Key economic indicators suggest a favorable outlook for the remainder of the 2026 fiscal year. With India’s real GDP growth peaking at 8.2% and household disposable income projected to rise to 34.1 in 2026, the environment for consumption is strengthening. HUL’s debt-free balance sheet and focus on premiumization position it to capitalize on this recovery, even as it manages volatility in raw material costs like palm oil and crude derivatives.

US Equity Markets Mixed Amid Diverging Fed Perspectives on Inflation and Employment Risk
The Federal Reserve maintained interest rates at 3.5% to 3.75% during its January 2026 meeting. This decision pauses a cycle of three consecutive rate cuts from late 2025. The move signals a shift to a wait-and-watch approach as the committee monitors the cooling but still elevated inflation levels. The FOMC vote was not unanimous, revealing a growing split among policymakers. While 10 members supported the pause, two officials dissented in favor of an immediate 25-basis-point cut. This division highlights a debate between those focused on persistent price pressures and those concerned with maintaining momentum in the labor market. Economic growth remains solid, with 3Q25 GDP figures showing a rapid 4.4% expansion. Early estimates for late 2025 suggest growth has moderated to a still-healthy 2.2% annual rate. Consumer spending and business investment continue to anchor the recovery, even as housing activity shows relative weakness. Inflation is trending downward but remains above the 2% target. The December Consumer Price Index (CPI) stood at 2.7%, down from 3% in September. Core PCE inflation, the Fed’s preferred gauge, is currently hovering around 2.8%. Officials noted that while core price pressures for goods have eased, service-sector inflation remains a point of vigilance. The labor market is showing signs of stabilization after a period of soft hiring. The unemployment rate was 4.4% in December 2025, falling from higher levels earlier in the year. Although monthly job growth averaged roughly 67,000, widespread layoffs have not materialized. This resilience allows the Fed more time to evaluate incoming data before committing to further easing. Markets reacted with cautious optimism to the steady rate hold. The Dow Jones recently reached 49,015.60, while the Nasdaq Composite gained ground to sit at 23,857.45. The S&P 500 remained largely flat at 6,978.03. Investors are currently pricing in a low probability of a cut in March, though many strategists expect at least one or two reductions later in 2026. Upcoming leadership changes add a layer of uncertainty to the outlook. Chair Jerome Powell’s term is set to expire in May 2026. This transition, combined with potential data disruptions from government fiscal debates, may lead to increased market volatility as the central bank navigates the final stretch of its inflation fight.
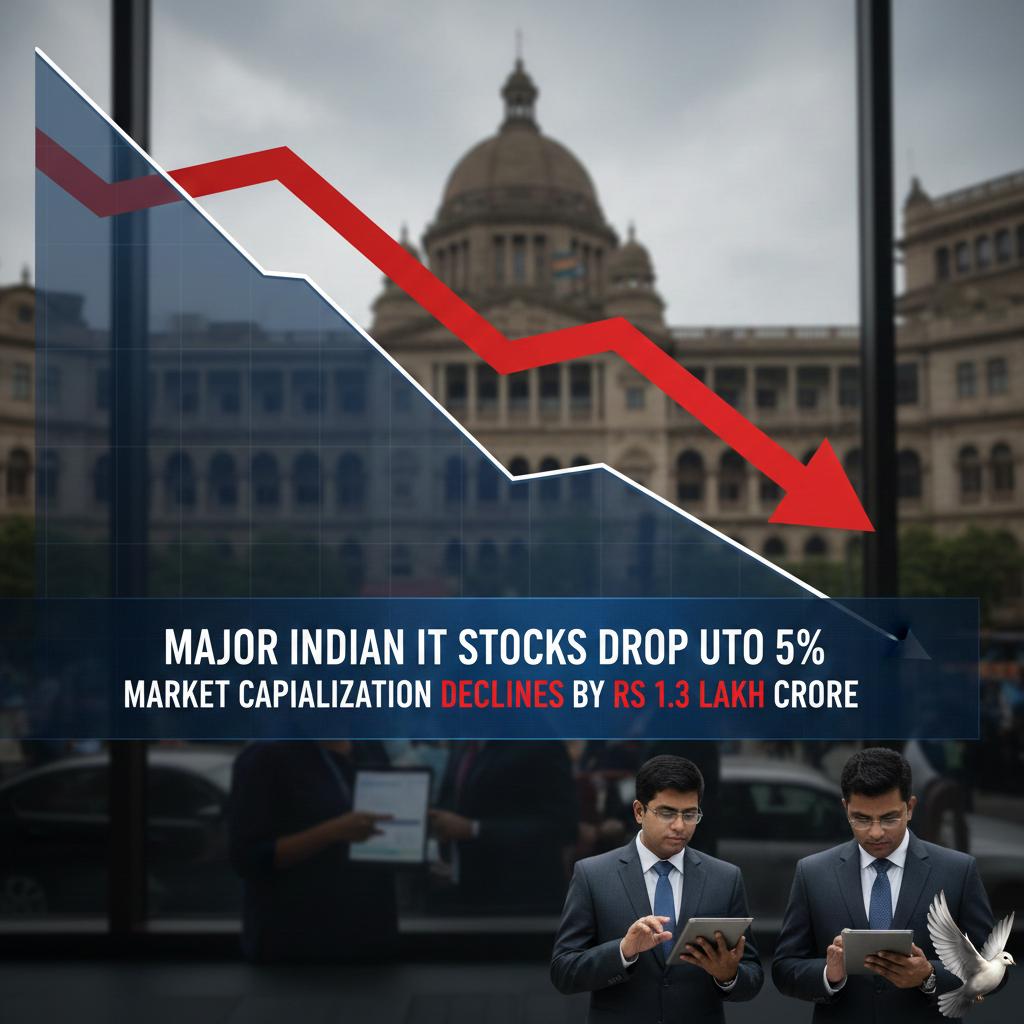
Major Indian IT Stocks Drop Up to 5% as Market Capitalization Declines by Rs 1.3 Lakh Crore
Indian IT stocks witnessed a massive sell-off this week as the Nifty IT index plunged over 4%, continuing a downward trend that has wiped out approximately 2.5 lakh crore in market value over recent sessions. The sector hit fresh lows on Thursday, with the index sliding to 33,834.05. Heavyweights bore the brunt of the selling: Infosys shares plummeted 5.18% to 1,396, while TCS tanked 4.58% to 2,776. Wipro and Tech Mahindra also recorded significant declines, falling nearly 5% as panic spread through the trading floor. The primary catalyst for this "SaaSpocalypse" is the launch of advanced automation tools from U.S.-based AI firm Anthropic. New plugins for the Claude Cowork agent have demonstrated the ability to automate complex professional tasks—including legal research, contract review, and coding—independently. This technological shift has sparked deep-seated fears that the traditional labor-arbitrage model is under direct threat. Analysts estimate that 9% to 12% of IT services revenue could be eliminated over the next few years as AI agents replace entry-level coding and maintenance roles. Sentiment was further dampened by claims from Palantir that its AI platform can now complete SAP migrations in weeks rather than years. This development has rattled investors who previously viewed ERP implementation as a safe, high-moat segment for Indian service providers. Global macro headwinds are adding to the pressure. Weakness in American Depository Receipts (ADRs) and a stronger Indian rupee have clouded the earnings outlook. With IT firms earning the majority of their revenue in dollars, the currency appreciation to 90.27 against the greenback is expected to squeeze profit margins in the coming quarters. While some analysts view the crash as an emotional overreaction, the structural concerns regarding pricing pressure and shrinking competitive moats remain. Institutional investors have adopted a "get me out" stance, leading to aggressive selling across all 12 constituents of the Nifty IT index. The market is now closely watching the 35,400 technical level for the Nifty IT index. Analysts warn that failing to sustain these levels could trigger further mayhem, as the industry grapples with a fundamental shift from human-led services to AI-native architectures.
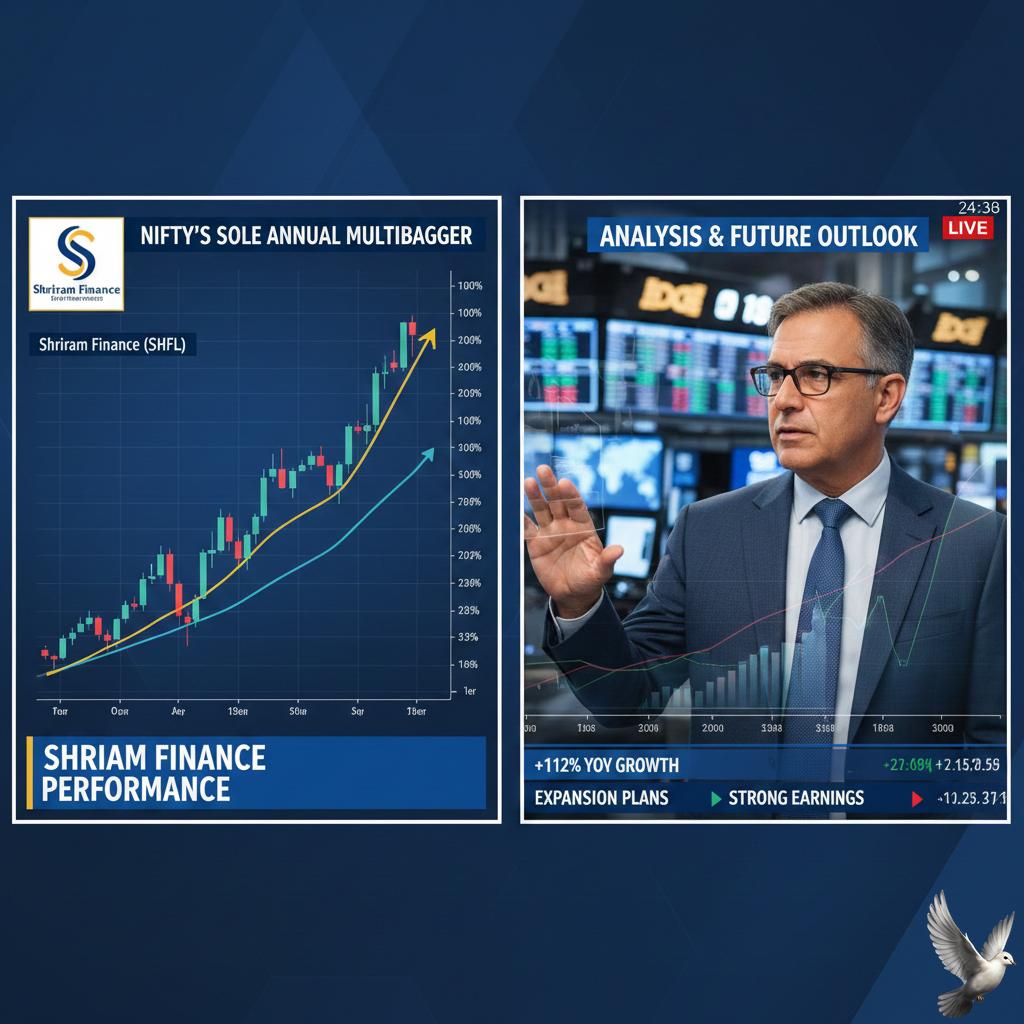
Shriram Finance Performance: Analysis of Nifty’s Sole Annual Multibagger and Future Outlook
Shriram Finance continues its aggressive growth trajectory, maintaining a dominant position as one of India's largest retail asset financing NBFCs. The stock has effectively doubled investor wealth over the past year, significantly outperforming the Nifty 50 and frequently touching new 52-week highs near the 1,068 level. The market capitalization of the firm has recently crossed the 2,00,000 crore mark, reflecting strong investor confidence in its diversified lending model. **Strategic Stake Sale to MUFG Bank** A major catalyst driving the current momentum is the massive investment deal with Japan’s MUFG Bank. The Japanese lender is set to acquire a 20% stake in Shriram Finance for approximately 39,618 crore ($4.4 billion) via a preferential allotment. This transaction represents the largest-ever foreign direct investment in India’s financial services sector. The capital infusion is expected to finalize between March and April 2026, providing a significant boost to capital adequacy and lowering overall borrowing costs. **Financial Performance Highlights** In the latest quarterly earnings (Q3 FY26), Shriram Finance demonstrated resilient core operations: - Consolidated Net Interest Income (NII) grew 16% year-on-year to 6,765 crore. - Assets Under Management (AUM) expanded by 14.6% to reach 2,91,709 crore. - Net Interest Margins (NIM) remained healthy at 8.58%. - Profit After Tax (PAT) stood at 2,530 crore for the quarter. While reported net profit saw a technical dip compared to the previous year, this was due to the absence of a one-time exceptional gain from the sale of its housing finance subsidiary in the prior period. On a normalized basis, the company’s core profitability remains on a steady upward curve. **Market Outlook and Targets** The company maintains an AUM growth guidance of 18% to 20% for the upcoming fiscal years. Growth is being driven by strong demand in the used commercial vehicle segment, passenger vehicles, and MSME lending. Additionally, management is aggressively scaling its gold loan portfolio, targeting a 5% share of total AUM within the next 18 months. Asset quality remains stable with Gross Stage 3 assets at 4.54%. Leading brokerages have maintained "Buy" ratings on the stock, with price targets ranging from 1,120 to 1,200. Technical indicators show the stock trading well above its long-term moving averages, signaling a sustained bullish trend as it integrates the MUFG partnership into its operational strategy.
US Stocks Drift as Strong January Jobs Report Tempers Fed Rate Cut Hopes Following 2025 Slowdown
**U.S. Market Brief: February 2026 Labor Dynamics** The U.S. labor market entered 2026 on a firmer footing than anticipated, with January nonfarm payrolls rising by **130,000**. This figure exceeded consensus expectations and signaled a departure from the "low-hire, low-fire" stagnation that characterized much of the previous year. Private sector hiring drove the bulk of these gains, adding **172,000** positions, though a contraction of **42,000** jobs in the public sector—primarily within federal agencies—moderated the headline growth. High-growth areas included health care and construction, while finance and warehousing continued to shed roles. **Key Employment Indicators** The headline unemployment rate edged down to **4.3%** in January, falling from **4.4%** in December. Beneath the surface, the precise unrounded rate sits at **4.28%**, reflecting fewer workers losing or leaving their positions. * **Average Hourly Earnings:** Increased **0.4%** month-over-month, bringing the annual growth rate to **3.7%**. * **Labor Force Participation:** Remained stable at **62.5%**. * **Workweek:** Private sector hours edged up slightly to **34.3** hours per week. Despite the positive January data, massive historical revisions have altered the 2025 narrative. Updated Bureau of Labor Statistics data reveal that monthly job gains in 2025 averaged just **15,000**, a significant downward adjustment from the previously reported **49,000**. **Federal Reserve and Economic Outlook** The Federal Reserve maintained interest rates at **3.50% to 3.75%** during its January meeting. While two officials dissented in favor of a cut, the majority opted for a pause, citing "signs of stabilization" in the labor market and persistent inflation levels. Markets have since adjusted expectations, pushing the timeline for the next potential rate cut to **July 2026**. Policymakers are currently navigating a complex "jobless growth" environment where productivity, potentially bolstered by artificial intelligence integration, allows GDP to expand even as net hiring remains modest. **Consumer and Housing Impact** The resilience of the labor market continues to support consumer spending, though high borrowing costs remain a headwind. As of mid-February, 30-year fixed mortgage rates average **5.87%**, slightly lower than the **5.99%** seen earlier in the year but significantly higher than the levels seen at the decade's start. The current economic trajectory suggests a stabilizing labor supply, largely due to shifts in immigration policy and an aging workforce. With the "breakeven" rate for job growth—the number of new jobs needed to keep unemployment steady—now estimated below **70,000** per month, the January performance provides the Fed with additional flexibility to maintain a restrictive policy stance for longer.

Indian Rupee Gains 38 Paise to 90.40 Against US Dollar
The Indian Rupee demonstrated significant strength during early trading on Thursday, February 12, 2026, gaining 38 paise to reach 90.40 against the US Dollar. The recovery is primarily attributed to a sharp reversal in foreign fund flows. After a challenging 2025 that saw a massive pull-out of 1.66 trillion rupees by foreign portfolio investors, February 2026 has marked a turning point. In just the first ten days of this month, foreign investors have pumped 11,641 crore rupees back into domestic equities. Currency stability has been further bolstered by suspected intervention from the Reserve Bank of India (RBI). State-run banks were reportedly active in offering dollars to defend the rupee from volatile swings, following its recent slide toward the 90.70 mark. Banking system liquidity remains a supportive pillar for the currency. Current figures indicate a surplus near 3 trillion rupees, a substantial improvement from the decade-low deficit of 3.1 trillion rupees recorded in early 2025. This abundant liquidity has helped align market rates and eased the transmission of recent monetary policy decisions. On the policy front, the RBI recently maintained the repo rate at 5.25% while revising the GDP growth forecast for the 2025–26 fiscal year upward to 7.4%. This optimistic domestic outlook is driven by resilient consumption and new trade agreements with the United States and the European Union, which have helped offset external pressures. However, the broader economic landscape faces persistent challenges from the energy sector. Brent crude prices surged toward 70 dollars per barrel this week, hitting a five-month high. Heightened geopolitical tensions in the Middle East and concerns over supply disruptions continue to act as a primary weight on the rupee's long-term appreciation. Market participants are currently monitoring a new inflation series that may reflect a slight climb in prices due to changing consumer basket weights. Despite these headwinds, the combination of aggressive RBI liquidity management and the return of foreign capital has provided a much-needed buffer for the national currency in the current trading session.

Ashi Anand: Market Overreaction to Tech Selloff and the Role of AI in IT Services
Market Outlook: India IT and Jewellery Sectors **Indian IT services** are navigating a transformative period as of February 2026. While recent sessions saw volatile price action, major players like **TCS** and **Wipro** have shown resilience, posting gains of **1.74%** and **2.12%** respectively during high-volume trading. Market sentiment is shifting from "AI as a threat" to "AI as a margin driver." Industry data suggests that while AI-driven automation may cause revenue deflation due to reduced manpower requirements, **net profitability** remains protected. Strategic investments are accelerating. The **Union Budget 2026** recently sanctioned **$232 million** (₹2,000 crore) to boost AI infrastructure. This support coincides with a structural shift toward "asset-led" service models, where pre-built AI agents handle complex tasks. Sector Financials and Projections * The Indian IT industry is on track to reach **$350 billion** by the end of 2026. * IT spending within India is projected to hit **$176.3 billion** this year, fueled by data center expansion. * Mid-tier companies are showing agility, often outperforming large-cap peers in growth percentages. Valuations for leading blue-chip stocks have become increasingly attractive following recent corrections. Analysts highlight that the current entry points offer long-term value as enterprise AI adoption moves from experimental phases to production-scale implementation. Jewellery Sector Momentum The **Indian jewellery market** is entering a high-growth phase, with revenue expected to hit **$105.9 billion** in 2026. Demand remains robust despite elevated gold prices, as consumers prioritize value-added and branded products. A significant trend this year is the rise of **lab-grown diamonds (LGDs)**. These are being positioned as "smart luxury," appealing to younger demographics. This shift is turning diamond jewellery into an everyday staple rather than just occasional wear. Consumer Trends and Policy Impact * The **Union Budget 2026** maintains a customs duty of **20%** on imported jewellery, supporting domestic manufacturing. * **Old gold exchanges** now account for nearly **45%** of transactions, providing a liquidity cushion for the market. * **Lightweight "Neo-Heritage"** gold designs are seeing high demand for daily use. Organized retail chains are expanding rapidly into Tier-II and Tier-III cities, where rising disposable income is driving a **5.7% CAGR** in regional demand. South India continues to lead the nation, accounting for over **32%** of total gold consumption. Efficiency gains from 3D design and digital try-on technologies are helping retailers maintain margins between **11% and 11.5%**, even as metal prices fluctuate. Physical silver investment is also gaining traction, with a projected **20%** increase in bar and coin demand.

Indian Benchmark Indices Decline Amid IT Sector Selloff
Market Brief: Indian Equities Under Pressure Indian benchmark indices, the **Sensex** and **Nifty 50**, faced a difficult session on Thursday, February 12, 2026. The market opened lower and struggled to maintain momentum as a combination of global headwinds and sector-specific selling dampened investor sentiment. The **BSE Sensex** dropped over **400 points** in early trade, slipping to a low of **83,817**. Simultaneously, the **NSE Nifty 50** shed more than **100 points**, falling below the crucial psychological level of **25,850**. This decline effectively paused a three-day winning streak. Global Triggers and Interest Rate Outlook A major catalyst for the downward movement was the latest employment data from the United States. January's non-farm payrolls showed the addition of **130,000 jobs**, far exceeding the anticipated **70,000**. The U.S. unemployment rate also improved to **4.3%** from **4.4%**. While a strong labor market is generally positive for the economy, it has significantly lowered expectations for a near-term interest rate cut by the Federal Reserve. Investors now anticipate that rates may remain higher for longer, causing ripples through emerging markets like India. IT Sector Selloff and AI Concerns The Information Technology sector was the primary drag on the indices. The **Nifty IT Index** has plunged over **10.5%** so far in 2026, and the trend continued today with top firms like **Infosys** and **HCL Tech** falling between **2% and 4%**. This volatility is fueled by a sharp selloff in global tech stocks on Wall Street. Market participants are increasingly concerned about the potential for artificial intelligence (AI) startups to disrupt established IT service models. Heavyweights such as **TCS**, **Wipro**, and **Tech Mahindra** also faced significant selling pressure. Domestic Sentiment and Support Pillars Despite the broader weakness, certain sectors provided a cushion to the market. Banking and industrial stocks showed resilience. **State Bank of India (SBI)** hit a fresh all-time high of **₹1,188**, outperforming the broader market. Other gainers included: * **ICICI Bank** and **Axis Bank** in the financial space. * **NTPC** and **Power Grid** in the utilities sector. * **Tata Steel**, which saw marginal gains. Market support is increasingly dependent on the final leg of the Q3 earnings season. While the IT sector remains under a cloud, sectors such as automobiles, hotels, and capital goods are showing robust earnings growth. Macroeconomic Indicators The Indian Rupee remained relatively stable near the **90.70** level against the U.S. Dollar. Investors are now closely watching for the release of January’s retail inflation data, which will use the updated **2024 base year** series. Institutional activity remains mixed. While Domestic Institutional Investors (DIIs) provided strong support with net purchases exceeding **₹1,100 crore** in recent sessions, the shift in global rate expectations continues to keep Foreign Institutional Investors (FIIs) cautious.

Investment Strategies for Gold, Jewelry, and Related Equities Amid High Market Prices
**MARKET BRIEF: GOLD SECTOR PERFORMANCE** Gold has maintained an aggressive upward trajectory, characterized by record-breaking valuations and a fundamental shift in buyer behavior. As of February 2026, spot gold is trading near **$5,067** per ounce, holding firm above the critical **$5,000** psychological threshold despite recent minor fluctuations tied to US labor data and shifting interest rate expectations. The market has witnessed a historic rally, with prices roughly doubling over the last 18 months. In 2025 alone, gold set **53** new all-time highs, delivering a **44%** annual average price increase. This surge pushed the total value of global gold demand to an unprecedented **$555 billion**, a **45%** year-on-year jump. **Investment and Central Bank Trends** Leadership in the gold bull market has shifted from central banks to Exchange Traded Funds (ETFs). While central bank buying remained historically high at **863 tonnes** in 2025, it slipped below the **1,000-tonne** mark for the first time in three years as institutions became more price-sensitive. Conversely, investment demand has exploded. Global gold ETF holdings grew by **801 tonnes** recently, marking one of the strongest years on record. Combined demand for bars, coins, and ETFs surged by **84%** as investors sought a hedge against geopolitical volatility and trade tensions. **Consumer Market Dynamics** The high-price environment has severely strained the jewelry sector. Global jewelry volumes dropped by approximately **21%** as affordability became a primary concern for retail buyers. In major markets like India, 24-carat gold prices have reached approximately **₹15,961** per gram. Despite the drop in volume, the total value of jewelry spending actually rose by **9%** to **$35 billion**. Consumers are increasingly viewing jewelry as a "store of value" rather than simple fashion, frequently trading in old pieces for new ones or opting for lighter, more affordable designs to maintain tradition during festive and wedding seasons. **Supply and Outlook** Total gold supply saw a modest **1%** increase, reaching a record mine production of **3,672 tonnes**. Recycling activity also grew by **3%**, though this response remains relatively muted compared to the massive scale of the price rally. Market analysts suggest that while momentum remains strong, the shift toward ETF-led buying introduces higher potential for volatility. Strategic buyers continue to use price dips as entry points, supported by a long-term trend of diversifying away from traditional sovereign debt and currency-based assets.

$21 Billion FII Sell-off Nears Potential Conclusion Amid Remaining Market Risk
Foreign institutional investors (FIIs) are staging a cautious comeback to the Indian equity market, marking a reversal after a heavy sell-off period in late 2025 and January 2026. In the first week of February, net inflows reached **8,129 crore** ($897 million), breaking a three-month streak of exits that saw **35,962 crore** pulled in January alone. This renewed interest is largely attributed to a historic interim trade deal between India and the United States announced on February 6. Under the agreement, the U.S. reduced reciprocal tariffs on Indian goods from **25% to 18%**, while India committed to purchasing **$500 billion** in American energy and technology products over the next five years. The Indian rupee has provided additional structural support, strengthening from record lows of **92.10** to approximately **90.53** per dollar this week. Market analysts anticipate the currency could stabilize below the **90.00** mark by the end of the quarter, potentially triggering further capital inflows as exchange rate volatility subsides. Despite the positive momentum, benchmark indices show signs of consolidation. The Nifty 50 recently hovered near the **25,950** level, while the Sensex remained steady around **84,233**. A sustained rally remains dependent on the consistency of the Q3 FY26 corporate earnings cycle, which has delivered a mixed performance across sectors. Manufacturing and consumer giants have reported robust growth, with Titan seeing a **61%** jump in net profit and Grasim advancing **26%**. Conversely, the IT sector faces headwinds; major players like TCS and Infosys recorded losses of up to **2.5%** in recent sessions due to margin pressures and cautious global spending. The hike in Securities Transaction Tax (STT) on derivatives—raising futures rates to **0.05%** and options to **0.15%**—also remains a point of friction for foreign funds. Investors are closely monitoring whether the strength in domestic demand can offset these increased trading costs and the broader global risks.