Bullish News
Collection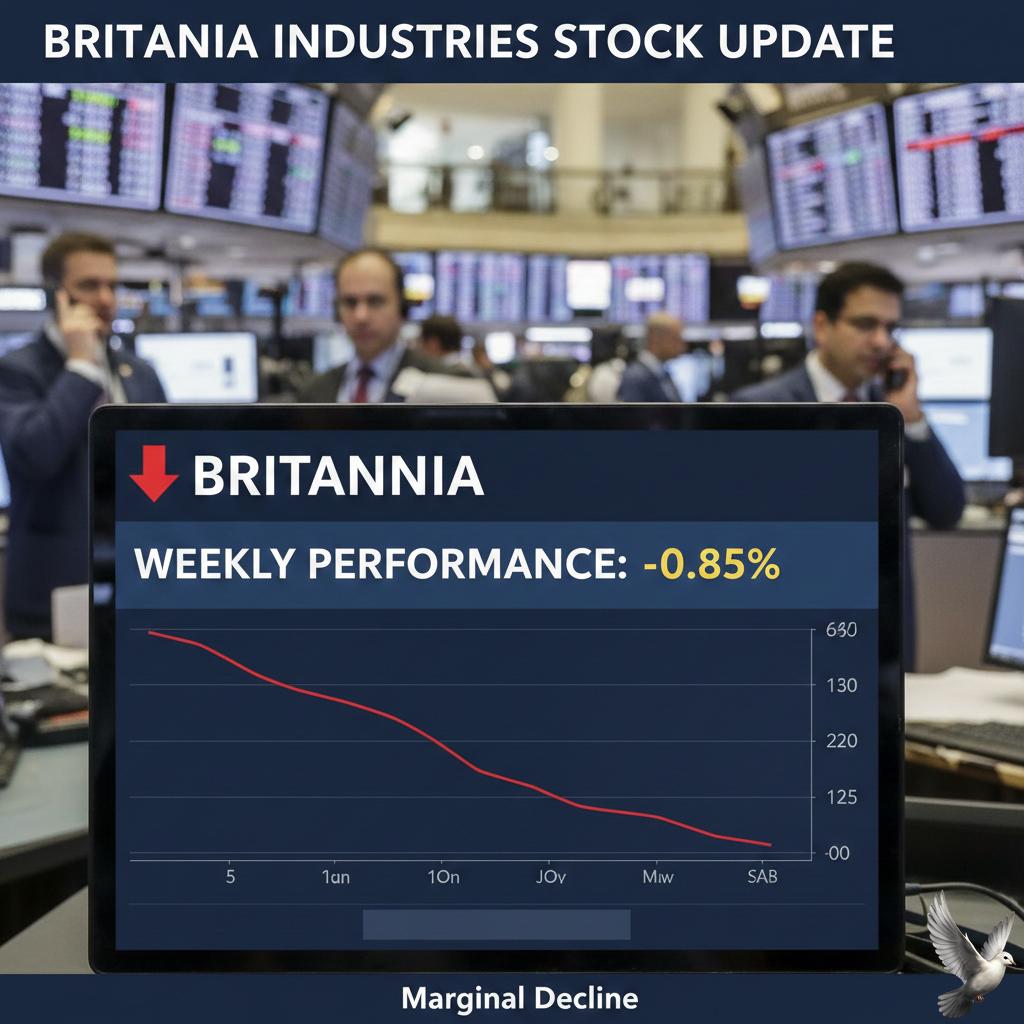
Britannia Industries Stock Update: Weekly Performance Records Marginal Decline
NVIDIA Market Brief: February 2026 The global semiconductor industry is entering a historic "giga cycle," with annual sales projected to reach **$1 trillion** in 2026. This surge is driven almost entirely by the transition from AI model training to large-scale inference, creating an unprecedented demand for high-performance computing infrastructure. NVIDIA remains the dominant force in this landscape, commanding an estimated **85% to 90%** market share of the AI accelerator sector. The company’s financial performance continues to break records, with Q3 fiscal 2026 revenue hitting **$57 billion**, a **62%** increase year-over-year. Data Center and AI Infrastructure The Data Center division remains the primary growth engine, contributing **$51.2 billion** in the most recent quarter—up **66%** from the previous year. This growth is fueled by the massive rollout of the Blackwell architecture. CEO Jensen Huang has noted that Blackwell demand is "off the charts," with cloud GPUs effectively sold out across major providers. The upcoming **Rubin architecture**, scheduled for the second half of 2026, is expected to further increase average selling prices and maintain technical leadership. Key Financial Indicators * **Stock Price:** Trading near **$185.41**, with market expectations targeting a move above **$200** following the February 25 earnings report. * **Gross Margins:** Stable at **73.6%**, with a target to reach the mid-70% range by year-end. * **Shareholder Returns:** NVIDIA has returned **$37 billion** to shareholders in the first nine months of fiscal 2026 through buybacks and dividends. * **Q4 Guidance:** Revenue for the final quarter is projected to reach **$65 billion**. Emerging Verticals and Competition Beyond traditional data centers, NVIDIA is aggressively expanding into Physical AI and Robotics. The **GR00T project** for humanoid robots and the **BioNeMo platform** for drug discovery are positioned as the next trillion-dollar opportunities. Automotive revenue has also seen a significant uptick, rising **32%** to **$592 million** as autonomous driving platforms enter full production. Competition is intensifying as hyperscalers like Google and Amazon develop custom internal silicon to reduce reliance on external vendors. Companies like **Broadcom** are gaining traction in the custom ASIC market, while **AMD** maintains a **7% to 8%** share with its MI350 series. Supply Chain and Market Risks The industry faces a paradox of soaring demand and systemic supply risks. Memory revenues are expected to hit **$551.6 billion** in 2026, driven by a "supercycle" in High-Bandwidth Memory (HBM). However, persistent supply-demand imbalances are projected to trigger price spikes of up to **50%** by mid-2026, potentially impacting the production timelines of next-generation AI factories.

Grasim Inds. Share Price and Stock Market Performance
Market Brief: February 11, 2026 The global financial landscape is currently defined by shifting interest rate expectations and localized equity strength. While major benchmarks show signs of a broadening rally, specific sectors—particularly technology and software—have faced recent volatility due to shifting narratives. Equities and Indices The **S&P 500** and **Dow Jones** maintain a positive bias, with Dow futures climbing over **100 points** in recent sessions. Despite this, the **S&P 500 Software & Services Index** has experienced a sharp **7.5%** weekly decline, extending year-to-date losses to **18.6%**. In Asia, the **Nifty 50** is trading firmly around **25,935**, holding above the critical **25,500** support level. The **Bank Nifty** continues to lead, sustaining levels above the psychological **60,000** mark. Conversely, the **Hang Seng Index** fell **3.0%** recently as investors reassessed valuations. Commodities and Energy Gold has reached historic peaks, with 24K gold trading at approximately **₹1,58,780 per 10 grams**. Prices have climbed **12%** year-to-date, significantly outpacing equities as a preferred inflation shield. Silver remains highly volatile, quoted near **₹2,52,300 per kg**. Crude oil is trending upward, reaching **$69.36 per barrel**. This represents a **5.14%** increase for February, driven by geopolitical tensions in the Middle East that have outweighed rising inventory reports. Central Bank Policy The **Reserve Bank of India** has maintained the repo rate at **5.25%**, signaling a neutral stance. Inflation for the fiscal year is projected at **2.1%**, though officials warned of upside risks from rising precious metal prices. The **Bank of England** also held its rate steady at **3.75%** in a tight **5-4** vote. Meanwhile, **Australia** recently raised rates to **3.85%**, highlighting the divergent paths central banks are taking as global inflation begins to normalize. Currency and Digital Assets The **US Dollar** remains roughly **15%** overvalued according to fair value models, with experts anticipating potential downside as rate convergence continues. The **USD/INR** pair is currently hovering around **₹90.58**. Digital assets have faced significant pressure. **Bitcoin** recently slipped below the **$70,000** threshold, influenced by record net redemptions in spot ETFs and over **$6.5 billion** in liquidated long positions. Key Economic Events A nationwide bank strike is scheduled for **February 12**, potentially disrupting financial services across several major institutions. Global markets are also awaiting the release of a new **CPI series** on the same day, which is expected to provide a clearer trajectory for future monetary policy.
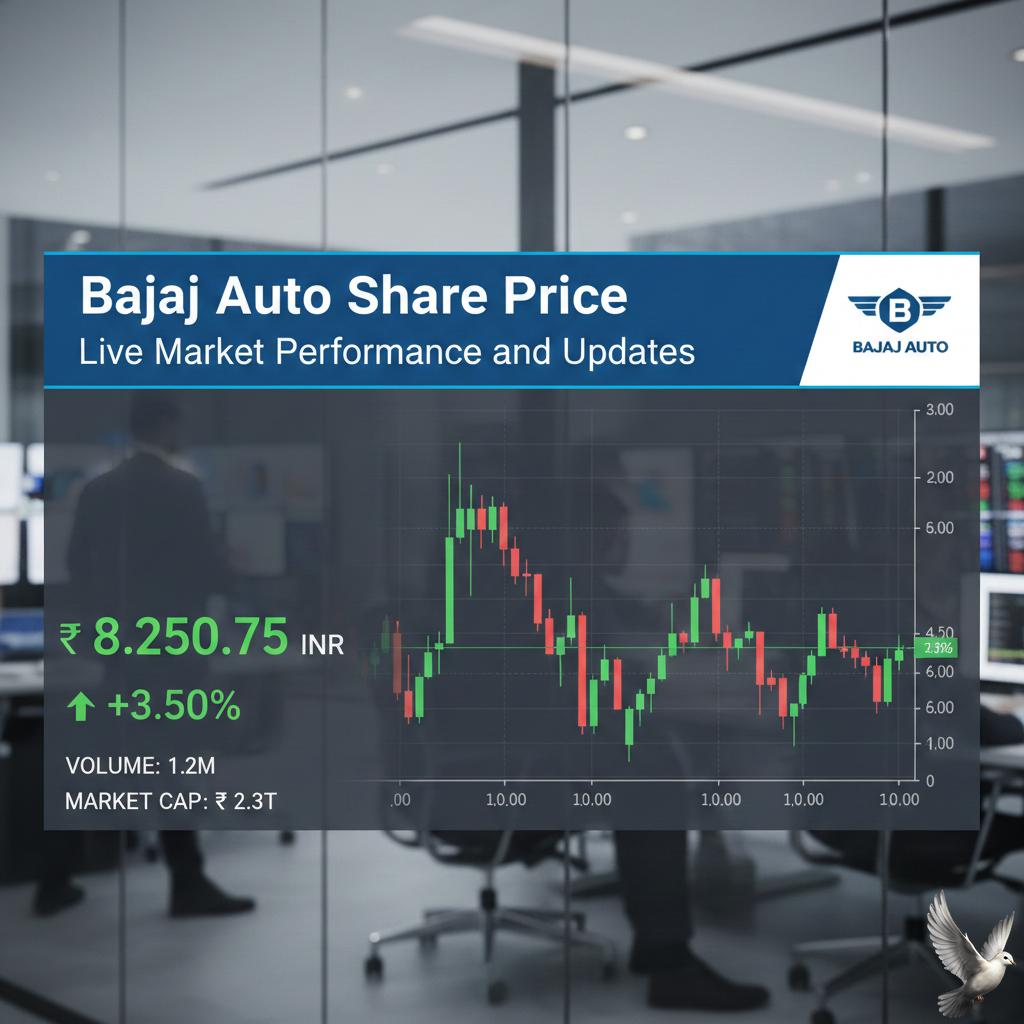
Bajaj Auto Share Price: Live Market Performance and Updates
Global Market Brief: February 2026 The global economic landscape enters mid-February 2026 defined by a transition from speculative hype to structural rebuilding. While global growth is projected to remain resilient at **3.3%** for the year, the momentum is increasingly divergent across regions and sectors. Equities and Sector Performance Wall Street maintains a cautious but positive tone as the Q4 earnings season reveals a fifth consecutive quarter of double-digit growth. The **S&P 500** recently crossed the **6,960** mark, supported by a **13.0%** blended earnings growth rate. While the "Magnificent 7" tech giants face waning momentum, the market is broadening. Investors are rotating capital into "real economy" sectors, including Industrials and Communication Services. Global small caps have emerged as a surprise leader, surging **5.4%** in early 2026 compared to a **2.3%** rise in the broader MSCI World index. Commodities and Energy Precious metals are experiencing significant volatility. Gold prices in major hubs like India are hovering near **1,56,600 INR** per 10 grams, reflecting a **2.3%** rebound from recent corrections. However, silver has entered its most overbought phase in decades, prompting warnings of potential pullbacks. In the energy sector, Brent crude continues to outperform broader equity indices. Natural gas remains stable at approximately **317 USD** per mmBtu, while energy commodities overall are expected to see price declines of roughly **7%** throughout the year due to shifting supply dynamics. Monetary Policy and Inflation Central banks are pivoting toward a neutral stance as global headline inflation is forecast to cool to **3.8%** this year. The Federal Reserve is navigating a transition period with a target terminal rate between **3.0%** and **3.25%**. In emerging markets, the Reserve Bank of India has maintained its repo rate at **5.25%**, signaling stability amidst global uncertainty. Conversely, the European Central Bank is expected to implement two rate cuts by mid-2026 to combat sluggish growth in the Eurozone, which is projected at just **1.1%**. Technology and AI Maturity The "Year of Truth" for AI has arrived. The sector is moving away from isolated experiments toward autonomous enterprise systems. AI is no longer a differentiator but a baseline requirement, with "Cloud 3.0" emerging as the operational backbone for sovereign and private AI deployment. Technological leadership is now measured by orchestration and governance rather than model size. This shift is driving a "prototype economy" where the cycle from idea to product is nearly instantaneous, fueling productivity gains that are expected to add **0.3%** to annual GDP growth in advanced economies.

US Market: Fed Signals Interest Rate Patience Amid Inflation Data
Federal Reserve policymakers have signaled a period of extended stability for interest rates, opting for a "wait-and-see" approach as they navigate a complex economic landscape. Following the central bank’s decision in late January to hold the federal funds target range steady at 3.5% to 3.75%, voting members emphasize that there is no immediate urgency to adjust policy further. Current monetary positioning is described as "neutral," aimed at neither restricting nor over-stimulating growth. This follows a cycle of three consecutive rate reductions totaling 75 basis points at the end of last year. Officials now prefer to err on the side of patience to fully assess the impact of those cuts on the broader economy. Inflation remains the primary focal point. While price pressures have eased from their peaks, headline figures like the Consumer Price Index (CPI) recently hovered near 2.7%. Policymakers remain wary of "sticky" inflation, particularly in the services and housing sectors, with some warnings that price growth could remain stalled near the 3% mark throughout 2026. The labor market is currently characterized as a "low-hire, low-fire" environment. Job growth has shown signs of sluggishness, with non-farm payrolls adding approximately 70,000 jobs in January—a modest pickup from the 50,000 added in December. The unemployment rate holds steady at 4.4%, reflecting a market that is stabilizing rather than rapidly expanding. Market sentiment is also being shaped by external factors, including fiscal support and shifting trade policies. The nomination of Kevin Warsh to succeed Jerome Powell as Fed Chair in May has introduced a new layer of anticipation regarding future policy direction. Additionally, the impact of import tariffs on goods inflation continues to be monitored closely as these costs filter through to consumers. Equity markets have reacted with cautious optimism. The S&P 500 recently surpassed the 7,000 level for the first time, supported by resilient consumer spending and a broadening of market leadership beyond the technology sector. Energy and materials have emerged as top performers, gaining 14.1% and 8.6% respectively in the most recent monthly cycle. Investors are now looking toward upcoming data releases, including the next Personal Consumption Expenditures (PCE) report on February 20, for confirmation that inflation is trending back toward the 2% target. Until then, the Federal Reserve appears committed to its steady-hand strategy, balancing the need for price stability with the goal of sustaining a balanced labor market.

Vikas Khemani on Earnings Momentum and Trade Clarity as Market Drivers
Market performance through the start of 2026 remains resilient, as global growth is projected to hold steady at 3.3%. This stability follows a year defined by shifting trade dynamics and a significant rotation in equity leadership. Corporate earnings for the most recent quarter have largely met expectations. The S&P 500 recently showed a blended earnings growth rate of approximately 13.3%, driven by a massive 28% surge in the technology sector. Midcap and smallcap stocks have emerged as standout performers. In a notable shift from the previous era of mega-cap dominance, small-cap equities outpaced the broader market last year, gaining roughly 12% in a single quarter as market breadth expanded. A primary driver of corporate confidence in early 2026 is the resolution of major trade uncertainties. Recent deals, including the US-EU agreement and modified tariff structures with the UK and South Korea, have replaced the "Liberation Day" volatility of 2025. Exporters are benefiting from new tariff baselines, often reduced to 15% from previously threatened levels of 30% to 50%. This clarity has particularly boosted the energy and manufacturing sectors, with US energy exports reaching new milestones. Analysts are increasingly optimistic about the remainder of 2026. The year is being shaped by a "delayed policy impact" from significant fiscal and monetary stimulus. US manufacturing activity has already rebounded to its highest level since 2022, with the ISM PMI jumping to 52.6. Fiscal support is being channeled through the One Big Beautiful Bill Act (OBBBA), while central banks provide tailwinds with continued rate-cutting cycles. The Federal Reserve is expected to deliver up to three additional cuts this year as inflation cools toward the 3.4% target. Valuations have improved in several sectors, though they remain demanding in technology. Investors are shifting their focus to stock-specific opportunities, particularly in companies leveraging artificial intelligence for operational efficiency and data center infrastructure. The outlook for 2026 suggests a healthier market environment than 2025. With lifted tariff threats and stimulative policy levers in place, global trade volumes are rising, evidenced by a 5% increase in air cargo activity and double-digit growth in semiconductor shipments.

Samvardhana Motherson Shares Rise 5% Following Q3 Results and Brokerage Reports
Samvardhana Motherson Market Update: February 2026 Samvardhana Motherson International Limited (SAMIL) shares reached a new **52-week high of ₹135.83** on February 11, 2026. This rally follows the release of third-quarter results for the 2025–26 fiscal year, which showed the company achieving its highest-ever quarterly revenue. The stock has demonstrated significant momentum, gaining approximately **18% over the last month** and outperforming the broader auto components sector. The company reported a consolidated net profit of **₹1,072.27 crore** for the December quarter, representing a **9% to 16.5% year-on-year increase** depending on normalization adjustments. Total revenue from operations surged **14% to reach ₹31,409 crore**. This growth was driven by a combination of organic expansion, the integration of recent acquisitions like Atsumitec, and favorable foreign exchange movements. Operational performance remained stable with EBITDA rising **13.3% to ₹3,043 crore**. The operating margin stood at **9.7%**, reflecting steady profitability despite a challenging global macroeconomic environment and elevated working capital requirements. The company’s net leverage ratio remains healthy at **1.1x**, even as it continues aggressive capital expenditure, which totaled **₹1,594 crore** for the quarter. Growth is being further solidified through new greenfield projects. The company recently announced a new wiring harness facility in **Morocco** and a vision systems unit in **Pune**. These projects are part of a broader strategy to expand in emerging markets. Additionally, the aerospace business showed exceptional momentum with **41% year-on-year growth**, supported by an expanding order book that now includes business jets and rotary-wing aircraft. Market analysts have responded to these results with optimism. Brokerages including Motilal Oswal and Emkay Global have reiterated "Buy" ratings, with price targets revised upward to a range between **₹140 and ₹148**. Analysts point to the successful integration of the Nexans AutoElectric business and the company's "Vision 2030" goals as key long-term value drivers. Institutional interest is high, with a **74% increase in delivery volume** noted in recent trading sessions. Investors are focusing on the company's ability to navigate potential trade tariffs through its localized global manufacturing footprint. The shift toward premium vehicles and SUVs continues to benefit SAMIL, as these platforms require more complex wiring and advanced modules per vehicle.

Anshul Saigal: India Positioned to Outperform Emerging Markets
Market Outlook: India 2026 Indian corporate earnings for **Q3 FY2026** reflect a notable divergence between sectors, though overall profitability remains resilient. Manufacturing and industrial firms have led the charge with broad-based growth, while the IT sector faces margin pressure from rising labor costs. Aggregate revenue for the corporate sector grew by approximately **6.8%** year-on-year. Despite this moderate top-line expansion, operating profit margins have held steady at **18.1%**, supported by stabilizing input costs and operational efficiencies. Economic Resilience and Growth The national economy continues its upward trajectory with real GDP growth projected at **7.4%** for **FY2026**. This rebound from the previous year’s **6.5%** solidifies India's position as the fastest-growing major economy. Market indices reflect this optimism. In early February, the **Nifty 50** consolidated near **25,776** while the **BSE Sensex** reached **83,817**. Investor sentiment is further bolstered by the **Reserve Bank of India** maintaining a stable repo rate of **5.25%**. Key Drivers and Policy Shifts Government capital expenditure has been a primary catalyst for growth. The Union Budget 2026 allocated a record **₹12.2 lakh crore** toward infrastructure, specifically targeting roads, railways, and bridges. Consumption patterns are shifting, with **rural demand** now outpacing urban centers. This trend is fueled by moderating inflation, which fell to a decade-low of **1.7%** in late 2025, significantly increasing household disposable income. Sector Performance and Outlook * **Manufacturing:** GVA growth is projected at **7.0%**, a sharp increase from **4.5%** in the prior fiscal year. * **Consumer Durables:** Discretionary spending is rising, with the sector index seeing gains of over **2.6%** in recent trading sessions. * **Financial Services:** Credit growth remains robust, supported by healthy bank balance sheets and controlled asset quality. The outlook for **Q4 FY2026** remains positive. Corporate commentary highlights strong deal pipelines and expectations for further margin expansion as GST rationalization and new trade agreements begin to influence the broader market. Strategic Indicators * **Fiscal Deficit:** Target set at **4.4%** for **FY2026**, down from **4.8%**. * **Foreign Investment:** Limits for individual offshore investors have been raised from **10%** to **24%**, encouraging stable long-term capital inflows. * **Market Volatility:** The **India VIX** has cooled to approximately **11.5**, indicating a period of market consolidation and reduced investor anxiety. External factors, including global trade negotiations and potential tariff shifts, remain key monitorables for the upcoming quarter. However, domestic demand and high-frequency indicators suggest the growth momentum is well-insulated against global shocks.

Naveen Mathur Forecasts Gold Upside Toward $5,200 and Silver Consolidation
February 2026 Gold and Silver Market Brief **Market Snapshot** Gold prices are maintaining a strong position in early **2026**, with spot prices currently hovering near **$5,050** per ounce. This follows a period of extreme volatility where the metal hit a historic peak of **$5,600** in late January. In domestic markets like India, 24K gold is trading steadily around **₹158,000** per 10 grams, reflecting a **20%** year-on-year gain. **Primary Growth Drivers** Institutional demand remains the bedrock of the current rally. Central banks, led by China and Poland, continue to expand reserves as a de-dollarization strategy. Global central bank purchases are projected to average **190 tonnes** per quarter throughout **2026**. Additionally, the market is pricing in at least two Federal Reserve interest rate cuts by year-end, which traditionally lowers the opportunity cost of holding non-yielding bullion. **Investment Vehicle Trends** The shift toward digital and paper gold is accelerating. Physically-backed Gold ETFs saw record inflows of **$19 billion** in January alone, pushing total assets under management to a new high of **$669 billion**. Financial experts suggest a disciplined allocation of **10–15%** for diversified portfolios, viewing current price corrections as strategic entry points for long-term hedging. **Silver Market Outlook** Silver is experiencing significantly higher volatility compared to gold. While gold has gained roughly **15%** year-to-date, silver's performance has been hampered by a sharp correction from its **$120** peak down to the **$80–$82** range. Although industrial demand from the AI and solar sectors remains a structural support, silver's "catch-up" trade is losing momentum as investors prioritize gold’s relative stability during geopolitical uncertainty. **Risk Factors to Watch** The nomination of hawkish leadership at the Federal Reserve and a fluctuating U.S. Dollar Index (currently at **96.88**) remain the primary headwinds. Geopolitical flashpoints in the Middle East continue to provide a "safe-haven" floor, but traders are cautioned to watch for thin liquidity during the upcoming Lunar New Year period, which could trigger further unpredictable price swings.
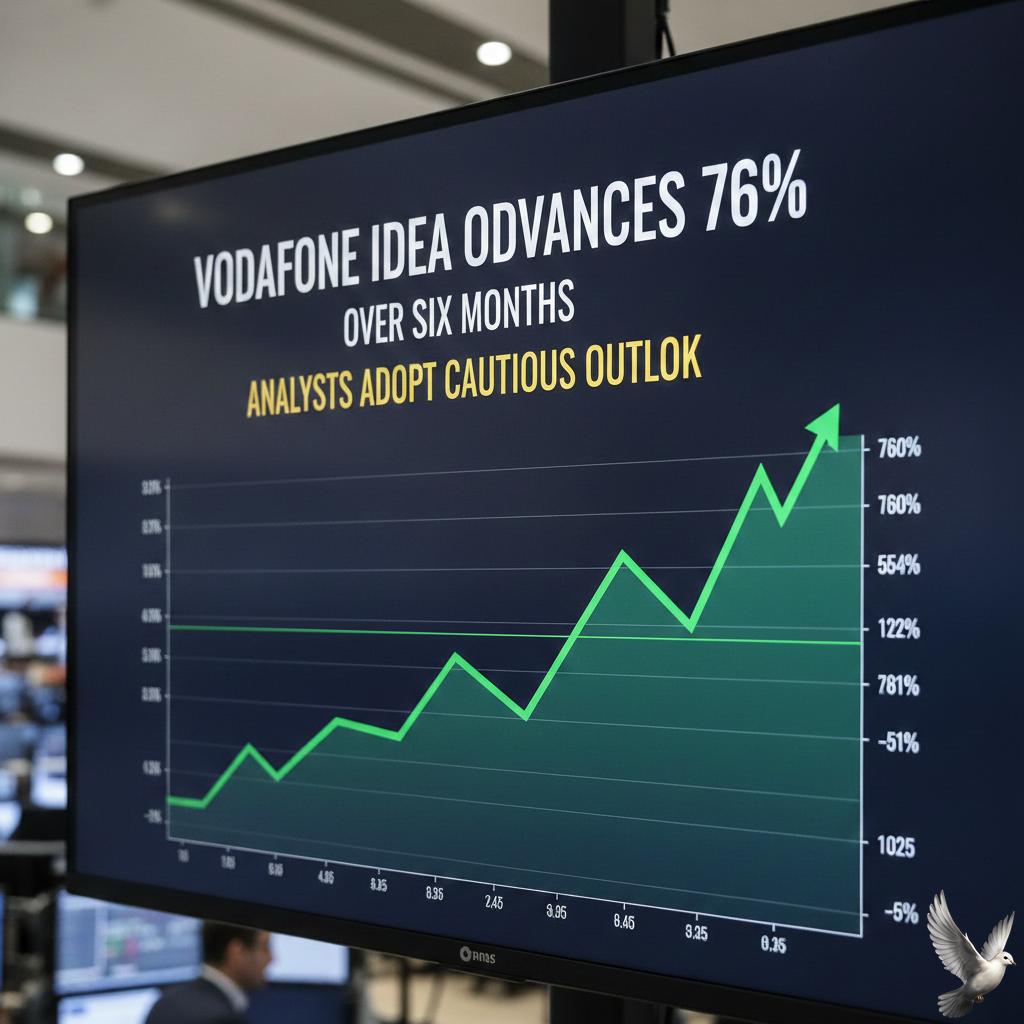
Vodafone Idea Advances 76% Over Six Months as Analysts Adopt Cautious Outlook
Vodafone Idea (Vi) is navigating a critical recovery phase as of February 2026, supported by a combination of regulatory relief and aggressive capital expenditure. The stock is currently trading near **₹11.13**, reflecting a notable **26%** gain over the past year. Market sentiment has shifted following a series of technical crossovers, including the 200-day moving average, signaling renewed interest from turnaround traders. A primary driver of this momentum is the government's decision to freeze Adjusted Gross Revenue (AGR) liabilities at **₹87,695 crore**. This move includes a **10-year** deferral period where the company will only pay minimal annual amounts—approximately **₹124 crore** through FY31. This restructuring has reduced the net present value of the debt burden by an estimated **60% to 80%**, providing the company with vital liquidity to fund operations and network upgrades. Promoter confidence has further stabilized the outlook. Billionaire Kumar Mangalam Birla recently increased his stake by purchasing **4.09 crore** shares from the open market. This personal investment coincides with a broader **₹45,000 crore** three-year turnaround plan. The strategy aims to achieve 4G parity with competitors and accelerate the 5G rollout across all **17** priority circles to arrest subscriber churn. Operational performance is showing signs of steady improvement. For the quarter ending December 2025, net losses narrowed to **₹5,286 crore**, a significant improvement from the **₹6,609 crore** loss recorded in the same period the previous year. Revenue from operations grew by nearly **2%** to reach **₹11,323 crore**, supported by a rising Average Revenue Per User (ARPU). The blended ARPU has increased to **₹186**, up **7.3%** year-on-year. This growth is largely attributed to high-value plan migrations and increased data consumption, which now averages **19.2 GB** per user per month. The 4G and 5G subscriber base has also expanded to **128.5 million**, even as the total subscriber count sits at **192.9 million** due to losses at the lower end of the market. Despite these gains, the path forward remains challenging. The company still carries a massive total debt of approximately **₹1.83 lakh crore**. While the current liquidity position has been bolstered by a **₹3,300 crore** NCD issuance and cash balances of **₹6,963 crore**, long-term sustainability depends on successful 5G execution and further tariff hikes expected later in 2026. Experts remain cautious, noting that while the risk of immediate insolvency has faded, the company must still navigate intense competition from market leaders.
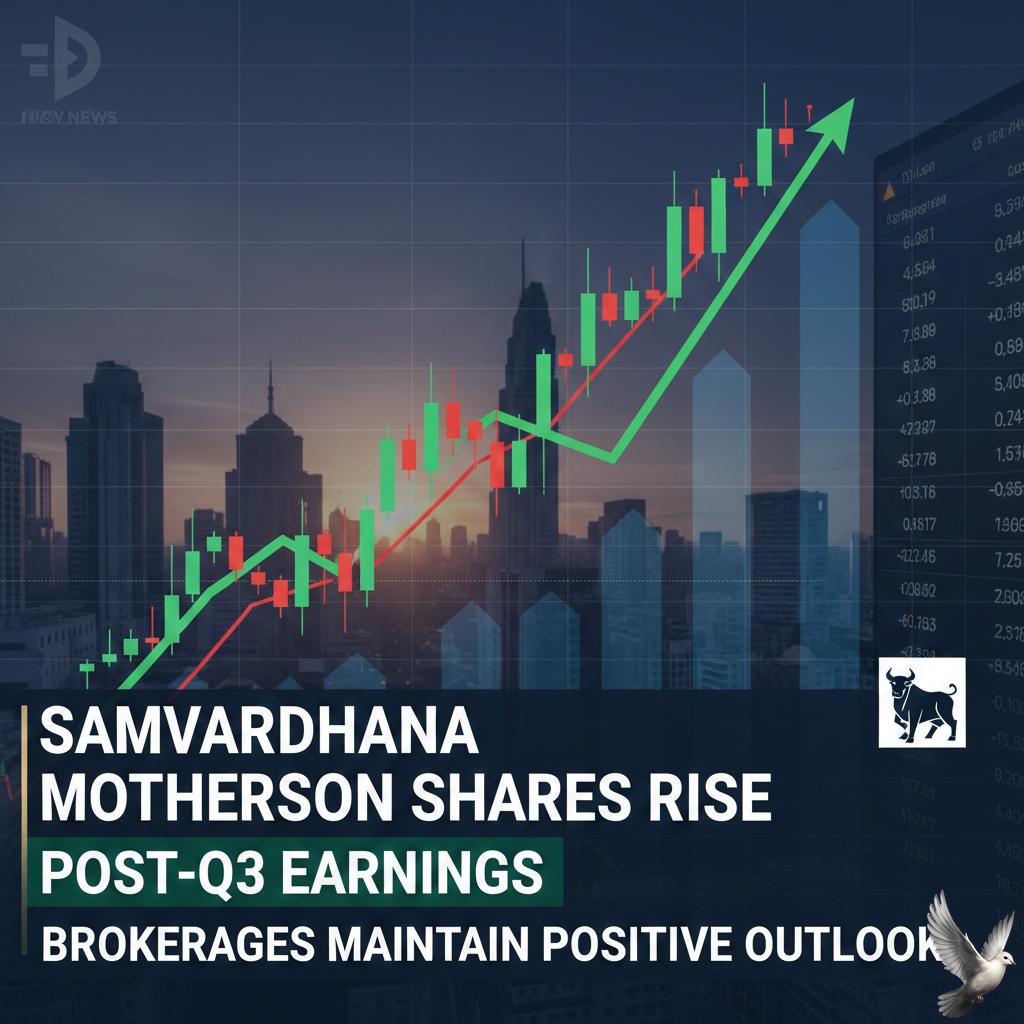
Samvardhana Motherson Shares Rise Post-Q3 Earnings as Brokerages Maintain Positive Outlook
Samvardhana Motherson International Limited (SAMIL) showcased significant financial resilience in its latest quarterly report, hitting a fresh 52-week high of **131.90** on the National Stock Exchange. The stock climbed over **5%** following the announcement of record-breaking results for the third quarter of the 2026 fiscal year. The auto components major reported its highest-ever quarterly consolidated revenue of **31,409 crore**, representing a **14%** year-on-year increase. Net profit saw a substantial surge, rising **16.5%** to reach **1,024 crore**. This growth was supported by a **13%** rise in EBITDA to **3,043 crore**, with operating margins remaining steady at **9.7%**. Strategic expansion remains a primary driver for the group. The company announced two new greenfield projects: a wiring harness facility in Morocco and a vision systems plant in Pune. Capital expenditure for the quarter stood at **1,594 crore**, accounting for roughly **52%** of EBITDA, primarily directed toward these new facilities and maintenance. Market analysts have largely reacted with optimism. Motilal Oswal reiterated a Buy rating with a revised target price of **148**, citing the company's "Vision 2030" goal of reaching **108 billion USD** in revenue. Nomura also maintains a positive outlook, highlighting the successful integration of recent acquisitions like Atsumitec and the growth momentum in the aerospace segment, which jumped **41%** this quarter. Despite the record performance, some caution persists regarding global macro-economic pressures. Citi maintains a sell rating, pointing to potential risks in global automotive demand and the impact of sustained high working capital requirements. However, the company has managed to keep its net leverage ratio stable at **1.1x**, even amidst heavy investment. The broader Indian auto component industry is projected to grow by **8% to 10%** through 2026. Samvardhana Motherson appears positioned to outpace this sector average through its 3CX10 diversification strategy, ensuring no single country, customer, or component contributes more than **10%** to total turnover. Organic growth is expected to accelerate as consumer electronics and aerospace divisions continue to scale.

India’s Urban Migration Drives Record Year for Real Estate IPOs
The Indian real estate sector has entered a critical phase of structural rebalancing. While housing sales saw a **12%** annual decline in 2025—dropping to **386,365** units—the market remains fundamentally resilient. This shift represents a transition from rapid post-pandemic acceleration to a more mature, price-disciplined environment. Capital markets are now a primary engine for growth. Developers raised approximately **₹13,500 crore** through IPOs in 2024, nearly doubling the previous year's figures. High-profile entries like Casagrand, with a **₹1,100 crore** approval, and several co-working firms are maintaining a robust pipeline for 2025 and 2026. Premiumization is the dominant trend. Properties priced above **₹1 crore** now capture **63%** of annual sales, up from **53%** just a year ago. In contrast, the affordable housing segment has contracted significantly, with demand falling by **31%**. Geographic performance has flipped. Chennai emerged as a standout leader with a **55%** surge in sales, while traditional heavyweights Mumbai and Pune saw sharp corrections of **26%** and **27%** respectively. Price growth has normalized to an average of **6%** across major cities, down from **17%** in 2024. Bengaluru has overtaken Delhi-NCR to become the second-most-expensive market, with average prices reaching **₹9,500** per square foot. Investors are finding new entry points through Small and Medium REITs (SM REITs), which have unlocked a potential **$75 billion** market. Fractional ownership in Grade-A office spaces is now accessible with ticket sizes as low as **₹10-15 lakhs**. The commercial sector reached record highs in 2025, with office leasing hitting **83.3 million** square feet. This is fueled by the aggressive expansion of Global Capability Centers (GCCs) and a growing demand for ESG-compliant, high-value R&D hubs. Market fundamentals are supported by a recent reduction in the RBI repo rate to **5.25%**. Additionally, the GST Council’s decision to cut taxes on cement from **28%** to **18%** is expected to provide significant relief to developer margins in the coming quarters. [Real Estate IPO Trends](https://www.youtube.com/watch?v=1sDwiNPuY2M) This video provides a detailed breakdown of the recent IPO surge and how developers are leveraging capital markets to fund large-scale projects. http://googleusercontent.com/youtube_content/0

BHEL Shares Decline 6% Following Launch of Rs 4,422 Crore Offer for Sale
BHEL shares faced a sharp decline of 6% in early trading today, February 11, 2026, reaching a low of 259.30 on the BSE. This movement follows the government's announcement of an Offer for Sale (OFS) to divest up to a 5% stake in the state-run engineering giant. The government aims to raise approximately 4,422 crore through this divestment. The base offer involves a 3% stake sale of 10.44 crore shares, with an additional 2% greenshoe option of 6.96 crore shares available to accommodate oversubscription. The floor price for the OFS is set at 254 per share. This represents a significant discount of approximately 8% compared to the previous closing price. The bidding window opened for non-retail investors on Wednesday and will open for retail investors on Thursday, February 12. Despite the immediate share price correction, the company recently reported a robust financial performance for the third quarter ended December 2025. Consolidated net profit surged by nearly 190% year-on-year to 390.40 crore. Revenue from operations also saw a healthy 16.4% increase, reaching 8,473 crore. Operational efficiency has improved, with EBITDA margins expanding to 6.4%. The company’s order pipeline remains strong, highlighted by a recent letter of acceptance for a 2,800 crore syngas purification plant project from Bharat Coal Gasification and Chemicals Limited. The broader sector context remains supportive as India's power demand continues to rise. National peak electricity demand reached record levels of 242.49 GW in the 2025-26 fiscal year. Total installed capacity has now crossed the 500 GW milestone, with non-fossil fuel sources accounting for 51.5% of the generation mix. Market analysts maintain a mixed outlook on the stock. While eight analysts currently hold "buy" ratings with target prices as high as 370 per share, others remain cautious due to valuation concerns, with the current price-to-earnings ratio standing at approximately 119.9. The government's current holding in the company stands at 63.17%. This stake sale is part of a revised disinvestment programme for the 2025-26 fiscal year, which targets total receipts of 33,837 crore. This move is expected to improve the stock's liquidity and increase public shareholding in the Maharatna PSU.

Fiscal Expansion Impacts Global Bond Markets
The global financial landscape is entering a high-stakes era of "fiscal exceptionalism," with total global debt now surging past **$323 trillion**. This record-breaking figure follows a massive **$12 trillion** increase in the first three quarters of alone. Governments are driving this trend, as public liabilities have climbed to nearly **93%** of global GDP. In the United States, the federal debt-to-GDP ratio has reached **121%**, fueled by persistent budget deficits averaging around **5%** of GDP. This fiscal expansion is mirrored in major economies like China, where public debt rose to **88%** of GDP, and the Eurozone, where issuance remains historically high to fund industrial transitions and defense. Central banks are simultaneously retreating from their roles as reliable buyers. The Bank of England has reduced its bond holdings from a peak of **£895 billion** to roughly **£551 billion**, while the Federal Reserve and European Central Bank continue to unwind their balance sheets. This "Quantitative Tightening" means private investors must now absorb a massive supply of government paper without the safety net of central bank support. The bond market is feeling the strain of this supply-demand mismatch. Long-term borrowing costs have reset significantly higher; US 30-year yields are currently testing the **4.8% to 5.1%** range, and Japanese long-bond yields have pushed to multi-year highs. Investors are demanding a higher "term premium"—the extra yield required to hold long-term debt—which is currently at its highest level in a decade. For emerging markets, the pressure is even more acute. External debt for lower-income countries reached **$1.2 trillion**, with interest payments doubling over the last ten years. These nations paid out **$741 billion** more in principal and interest than they received in new financing recently, highlighting a deepening liquidity squeeze as global capital gravitates toward higher-yielding, "safer" developed market bonds. The "crowding-out" effect is becoming a tangible risk. As governments dominate credit markets to fund domestic priorities and geopolitical shifts, the private sector faces higher costs. In many advanced economies, corporate borrowing is already slowing as firms react to these elevated rates. Market stability now hinges on a delicate balance. Governments must manage a projected **$130 trillion** in total debt by 2028 while navigating a world where central banks no longer suppress volatility. For now, the "bond vigilantes" have returned, forcing a disciplined reassessment of fiscal policy through the mechanism of higher market rates.
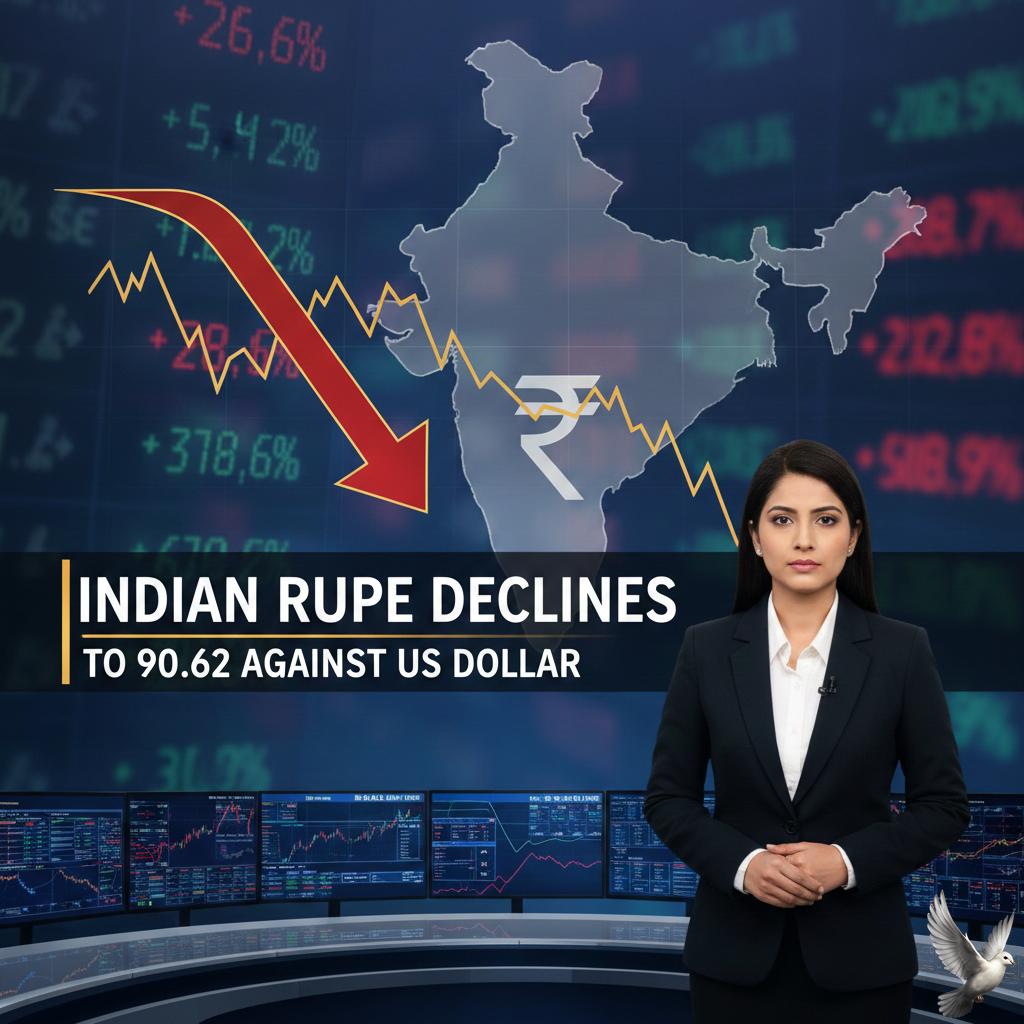
Indian Rupee Declines to 90.62 Against US Dollar
Market Brief: Indian Rupee Dynamics February 11, 2026 The Indian Rupee is navigating a period of heightened volatility, trading near the **90.56** to **90.62** range against the US Dollar. While the currency has shown signs of recovery from recent intraday lows of **90.77**, it remains sensitive to shifting trade policies and global energy prices. Market sentiment is currently reacting to the latest US-India interim trade framework updates. A revised fact sheet from Washington has introduced a mix of relief and caution. While the specific mention of "pulses" was removed from immediate tariff reduction lists, the document confirms India’s intent to eliminate or reduce duties on all US industrial goods. A significant pillar of the new trade arrangement involves energy and strategic alignment. India has committed to a massive **$500 billion** purchase of US energy, aircraft, and technology products. This follows an agreement to halt Russian oil imports, which prompted the US to lower reciprocal tariffs on Indian goods from **25%** to **18%**. Energy markets continue to exert pressure on the rupee's valuation. Brent crude is currently trading near **$69** per barrel, while West Texas Intermediate (WTI) remains above **$64**. Heightened tensions in the Middle East, particularly involving Iranian maritime corridors, have added a risk premium to these benchmarks, increasing the cost of India’s import bill. Despite these external pressures, domestic factors provide a crucial buffer. The Reserve Bank of India (RBI) recently maintained the repo rate at **5.25%**, signaling a neutral stance focused on stability. Furthermore, India’s foreign exchange reserves and consistent domestic institutional buying have prevented a sharper decline. Foreign Portfolio Investors (FPIs) have remained active, with inflows totaling nearly **$2 billion** so far this month. However, traders remain watchful of the **90.00** to **90.20** support zone. If geopolitical risks or importer demand for dollars intensify, analysts suggest the pair could drift toward the **91.00** level in the near term. The broader economic outlook for the 2025–26 fiscal year remains resilient, with GDP growth projected at **7.4%**. This underlying strength, combined with the RBI’s active management in the forex market, continues to define the rupee's defensive posture against global headwinds.

Precious Metals Surge Amid US Rate Cut Expectations Following Weak Consumer Data
Precious Metals Market Brief **February 11, 2026** Gold and silver futures began Wednesday’s session with renewed strength, buoyed by a shift in market sentiment toward a more accommodative Federal Reserve. Recent soft U.S. economic data has raised concerns over consumer spending and overall growth, triggering a flight to safety that benefits non-yielding assets. Gold Market Performance In domestic markets, 24-carat gold held firm above the **1.58 lakh** level. In Delhi, prices were quoted at approximately **15,894** per 10 grams, while Mumbai and Kolkata saw rates near **15,879**. These levels reflect a steady recovery following a period of profit-booking earlier in the month. Globally, spot gold is navigating the **4,900** to **5,100** zone. While prices corrected from recent peaks above **5,500**, the broader uptrend remains intact. Investors are increasingly viewing these pullbacks as healthy digestion of previous gains, especially as central bank demand remains a cornerstone of the market. Silver Trends and Industrial Demand Silver continues to exhibit higher volatility than gold, trading near the **2.90 lakh** per kilogram mark in major Indian cities. In southern markets like Chennai, premiums for physical delivery pushed rates closer to **3.00 lakh** per kilogram. Despite a sharp 17% monthly correction from its February 1 high of **3.50 lakh**, the long-term outlook for silver is supported by a structural supply deficit. The silver:gold ratio currently sits near **85:1**, suggesting to some analysts that silver remains undervalued relative to its yellow counterpart. Economic Drivers and Policy Outlook The primary catalyst for today’s upward movement is the Federal Reserve's current stance. The benchmark interest rate remains in the **3.5% to 3.75%** range. Recent commentary from Fed officials suggests a period of patience, with markets pricing in the possibility of further easing if labor market cooling persists. * **Inflation:** While core inflation remains slightly above the **2%** target, expectations of a downward trend later in 2026 are providing a tailwind for bullion. * **Safe-Haven Demand:** Geopolitical tensions and concerns over global trade policies continue to drive institutional inflows into gold ETFs and physical bars. * **Currency Impact:** A slight softening of the U.S. Dollar Index toward the **96.80** level has made precious metals more attractive to international buyers. Technical Outlook Gold is currently finding strong support in the **4,500 to 4,700** band on international exchanges. A sustained break above the **5,200** resistance level could clear the path for a retest of historical highs. Silver faces a critical technical hurdle in the **3.20 lakh to 3.50 lakh** per kg zone. Stabilizing above **3.00 lakh** is seen as the first step toward reclaiming its previous bullish momentum. Total global gold ETF holdings remain elevated at approximately **99.89 million ounces**, signaling that long-term investors are maintaining their hedges despite short-term price swings.

US Wealth Management Stocks Decline Amid AI Disruption Concerns
Recent market activity has seen a sharp divergence in the financial services sector as emerging generative AI tools rattle traditional wealth management and brokerage models. A major selloff on February 10, 2026, was triggered by the debut of advanced tax-planning automation, causing significant intraday volatility for established industry leaders. Market Impact and Key Declines The selloff was most pronounced in the brokerage space, where automation is seen as a direct threat to high-margin advisory services. Charles Schwab (SCHW) experienced a significant drop, plunging more than 9% during the February 10 session. This reaction followed the launch of a new AI tool by fintech platform Altruist, designed to automate complex tax strategies—a service historically reserved for human advisors. Broad market sentiment across the sector was similarly pressured: * The S&P 500 Financials sector was hit hard as investors re-evaluated business "moats." * Morgan Stanley (MS) saw its stock retreat from its January 15 all-time high of 190.18, closing near 180.78. * The volatility mirrored a 4% decline in the S&P 500 Insurance Index earlier in the week, sparked by similar AI-driven disruption in insurance brokerage. The Shift Toward "Software 2.0" Investors are increasingly concerned about fee compression as "Software 2.0" enters the wealth management space. New AI agents are now capable of analyzing 1040 forms, pay stubs, and meeting notes to generate interactive tax plans instantly. This transition threatens to commoditize advanced planning, with 83% of advisors already expecting to charge less than 1% for high-net-worth clients by the end of 2026. Sector Outlook and Resilience Despite the immediate selloff, market analysts suggest the reaction may be an overcorrection. Large-scale firms retain significant advantages through their vast data ecosystems and "unified client brains." Established players like Fidelity and JPMorgan are aggressively scaling their own AI infrastructure, with industry-wide AI spending projected to exceed $500 billion this year. The emerging consensus points to a "profitability paradox." While total assets under management are projected to rise globally, profit margins are under pressure from a stuck cost-to-income ratio of approximately 68%. The winners in this environment are expected to be firms that successfully use AI to augment rather than replace the human element, focusing on emotional management and complex trade-offs that algorithms cannot yet resolve. Current indicators suggest that while AI tax tools are a "door-opener" for client engagement, the human-in-the-loop remains essential for regulatory compliance and high-stakes decision-making. Wealth management stocks are now entering a phase where valuations will be tied to how effectively they decouple revenue growth from operational cost increases via these new technologies.
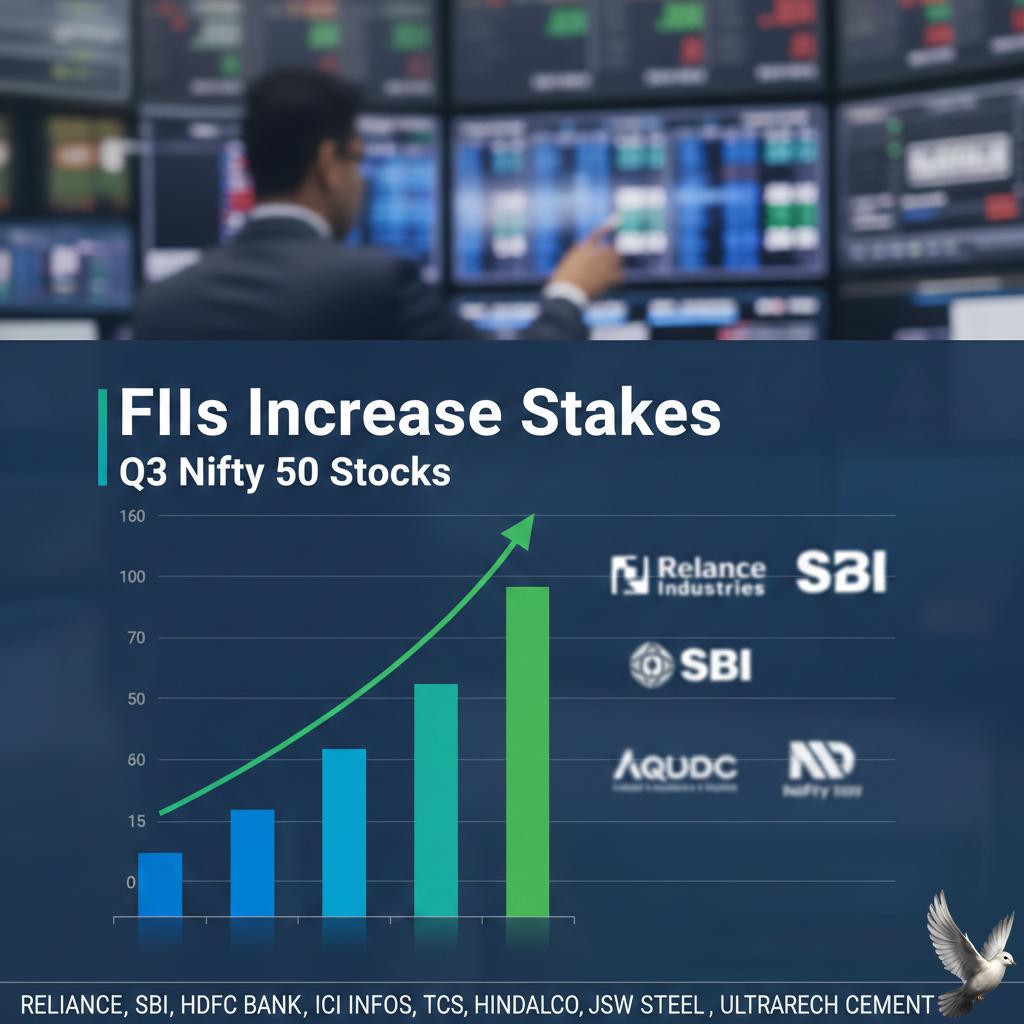
FIIs Increase Stakes in Reliance, SBI, and 8 Other Nifty 50 Stocks During Q3
Foreign Institutional Investors (FIIs) have shifted toward a highly selective investment strategy as of February 2026. While the broader market has seen significant institutional churn, FIIs are now focusing on high-conviction Nifty50 stocks, ending a long streak of aggressive offloading. Market indicators show a notable reversal in February, with FPIs injecting over **8,100 crore** into Indian equities so far. This follow’s a difficult January where outflows reached **38,740 crore**. The renewed interest is largely driven by optimism surrounding the India-US trade framework and the Reserve Bank of India’s decision to maintain the repo rate at **5.25%**. Specific Nifty50 giants have emerged as primary targets for foreign capital. Reliance Industries and State Bank of India (SBI) recently joined the list of preferred picks. Bharti Airtel continues to see rising foreign ownership despite reporting a **55%** decline in net profit, as investors focus on its **19.6%** revenue growth. Tata Motors and Asian Paints remain key fixtures in the FII strategy. Although Tata Motors’ passenger vehicle segment faced a consolidated loss of **3,486 crore** this quarter, institutional interest remains resilient. In contrast, foreign holdings were trimmed in other heavyweights like HDFC Bank and Jio Financial Services, where ownership fell to **29.4%** and **11.5%** respectively. The Nifty 50 index is currently hovering near the **26,000** mark, supported by these selective inflows. The index trades at a price-to-earnings ratio of **22.8**, which analysts consider a fair valuation level. However, a structural shift is underway as Domestic Institutional Investors (DIIs) have overtaken FIIs in total Nifty50 ownership for the first time, holding **24.8%** compared to the FII share of **24.3%**. Economic stability is providing a floor for these targeted investments. India’s GDP growth is projected at **7.4%** for the 2026 fiscal year, with consumer inflation remaining steady at **1.33%** as of December. This environment has encouraged FIIs to return as net buyers for three consecutive sessions in early February, providing much-needed liquidity to the large-cap segment. Short-term market sentiment remains cautious but positive. Resistance is expected between **26,000** and **26,300**, while immediate support is established at **25,800**. FII activity is expected to remain concentrated in sectors like telecommunications, select private banks, and consumer durables as they navigate global volatility and local earnings reports.
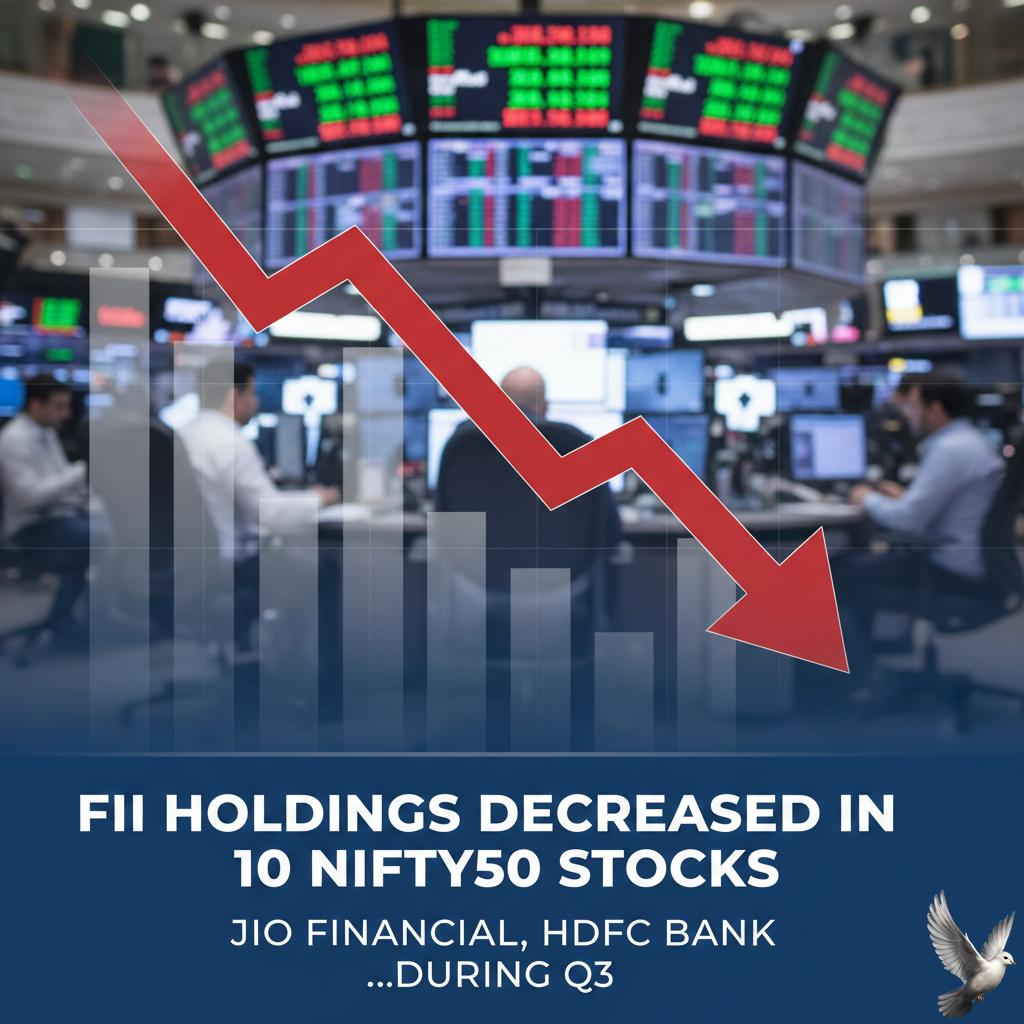
FII Holdings Decreased in 10 Nifty50 Stocks Including Jio Financial and HDFC Bank during Q3
Foreign Institutional Investors (FIIs) have significantly adjusted their positions in the Indian equity market, reducing holdings in **39 Nifty50 stocks** during the December 2025 quarter. This widespread trimming has led to a major milestone where Domestic Institutional Investors (DIIs) now hold a higher collective stake in the Nifty50 than their foreign counterparts. As of February 2026, FII ownership in the Nifty50 has settled at **24.3%**, a decline of **90 basis points** year-on-year. In contrast, domestic participation has surged to an all-time high of **24.8%**, fueled by consistent mutual fund inflows and retail participation. Key Stock Adjustments Foreign investors executed notable cuts in several blue-chip companies during the final quarter of 2025. **Bajaj Auto** saw FII holdings drop from **9.65% to 8.83%**, while **HDFC Bank** experienced a reduction from **48.38% to 47.67%**. Other major names facing exposure cuts included **Mahindra & Mahindra**, **Asian Paints**, and **State Bank of India**. Despite the broad exit from many names, foreign capital remains highly concentrated. Five major stocks now account for approximately **$268 billion** of total FII holdings in the Nifty 500. **HDFC Bank** remains the largest single holding by value at **$93.5 billion**, followed by **ICICI Bank** at **$58.5 billion** and **Infosys** at **$26.7 billion**. Recent Market Rebound The early days of February 2026 have signaled a potential shift in sentiment. After net selling nearly **₹34,350 crore** in December 2025 and **₹38,740 crore** in January 2026, foreign investors have turned net buyers in recent sessions. In the first ten days of February, FIIs have pumped approximately **₹4,970 crore** back into the cash market. This includes a significant single-day purchase of **₹2,254 crore** on February 9. This renewed interest is attributed to moderating valuations and the finalization of a new trade framework between India and the United States. Sector Performance and Outlook While FIIs reduced exposure in 15 of 24 sectors over the past year—most notably in Technology, Real Estate, and Consumer Durables—they have increased stakes in **PSU Banks, Telecom, and Oil & Gas**. The Nifty50 is currently trading at a forward price-to-earnings multiple of approximately **20.1x**, which is broadly aligned with its 10-year historical average. Market analysts observe that the valuation premium of Indian equities over other emerging markets has compressed to **47%**, down from **80%** in late 2024, making entry points more attractive for foreign capital. Support from domestic liquidity continues to act as a shock absorber. Monthly SIP flows remain robust, and DIIs have acted as net buyers of over **₹8,973 crore** during the recent market recovery phase, providing a structural floor to the indices even during periods of foreign caution.
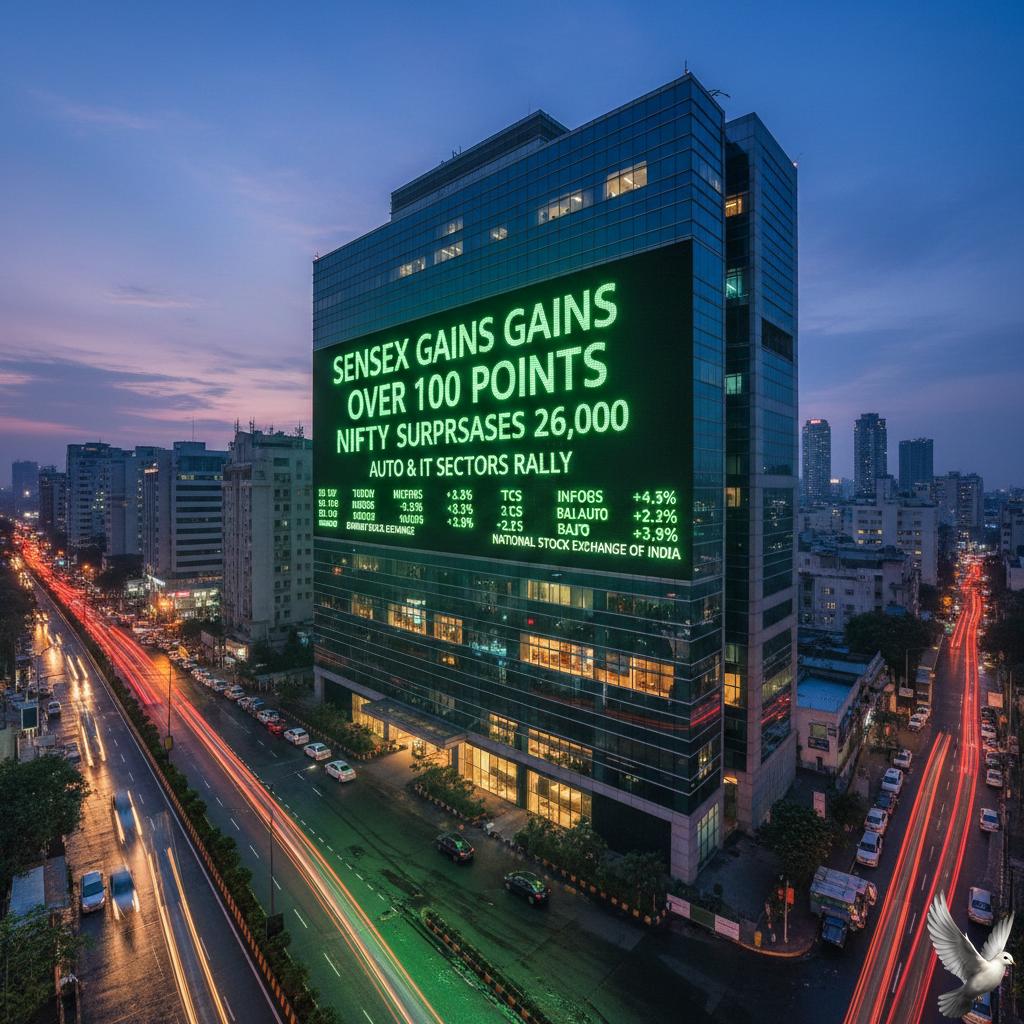
Sensex Gains Over 100 Points and Nifty Surpasses 26,000 Amid Rallies in Auto and IT Sectors
Market Pulse: Indian Equities Extend Rally Indian benchmark indices maintained their upward trajectory for a fourth consecutive session on Wednesday, February 11, 2026. The Nifty 50 successfully reclaimed the psychologically significant **26,000** mark during early trade, reflecting sustained investor confidence. The **BSE Sensex** tracked this momentum, trading near the **84,300** level. This extension of the rally follows a strong performance on Tuesday, where the Sensex gained **208.17** points and the Nifty added **67.85** points. Sectoral Performance and Drivers Buying interest was concentrated in heavy-weight sectors including **Auto, IT, Metals, and FMCG**. These gains are largely supported by a steady Q3 earnings season and positive sentiment surrounding an interim India-US trade agreement, which has eased previous tariff-related concerns. * **Auto Index:** Gained **1.4%**, bolstered by strong earnings from players like Mahindra & Mahindra. * **Media Sector:** Led the broader sectoral charts with a significant **2.4%** jump. * **FII/DII Activity:** Institutional flows have turned supportive, with Foreign Institutional Investors (FIIs) net buying **69.45 crore** and Domestic Institutional Investors (DIIs) infusing **1,174.21 crore** in the previous session. Technical Levels and Market Breadth The Nifty faces immediate resistance at the **26,000** to **26,100** range. Technical analysts point to a "buy-on-dips" strategy as long as the index sustains above the **25,830** support level. Despite the frontline strength, the broader market showed signs of selective profit booking. While mid-cap and small-cap indices initially outperformed, the market breadth shifted slightly as investors locked in gains following the three-day **960-point** surge in the Sensex. The **India VIX**, a measure of market volatility, remained stable in the **low-12** range, suggesting that near-term anxiety has cooled significantly following the post-budget fluctuations. Currency and Global Context The Indian Rupee saw slight volatility, trading around **90.74** against the U.S. Dollar. Globally, Asian markets provided a supportive backdrop, with the Nikkei and Hang Seng showing resilience, which assisted the firm opening in Mumbai. Investors are now shifting focus to upcoming global macroeconomic data, including U.S. retail sales and inflation figures, which are expected to influence foreign fund flows in the second half of the week.

Indian Markets Rise Following India-US Trade Developments; BFSI and Specialty Chemicals Lead Gains
Indian equity markets are witnessing a sustained rally in February 2026, driven by a landmark interim trade agreement between New Delhi and Washington. The Nifty 50 has recently crossed the **25,900** mark, while the Sensex continues to trade above the **84,000** level, reflecting a gain of over **0.50%** in recent sessions. The primary catalyst is a significant reduction in reciprocal tariffs, which have been slashed from **25%** to **18%**. This move is expected to boost India's real GDP growth to **6.9%** for the 2026 calendar year. Market sentiment is further bolstered by a projected narrowing of the current account deficit to **0.8%** of GDP. Expert Sudip Bandyopadhyay highlights that the BFSI sector remains a dominant leader, with the Bank Nifty opening near **60,800**. Private and PSU banks are attracting strong buying interest due to healthy asset quality and steady credit growth. The specialty chemicals and agrochemicals sectors are also seeing a reversal in fortunes. Capacity utilization is rising, and new government initiatives like "Chemical Arks" are expected to lower import dependence. This aligns with a broader shift where investors are prioritizing companies with clear paths to profitability over pure volume growth. Institutional activity shows a notable shift as foreign investors returned to the buying side, recording net inflows of over **₹2,254 crore** in a single recent session. Domestic institutional investors (DIIs) continue to provide a structural cushion, contributing over **₹1,174 crore** in daily net purchases. This liquidity is largely directed toward large-cap stocks, although mid-cap and small-cap indices have shown resilience, with the small-cap index recently jumping **2.65%**. Market breadth remains firm, with advances significantly outnumbering declines. While the outlook is positive, experts urge caution regarding global competitive pressures and potential shifts in US trade policy. The focus remains on quality stocks within asset-backed sectors that offer high earnings visibility and operational discipline.