Bullish News
Collection
State-Owned Enterprises Raise $2 Billion via Bond Market Ahead of Expected Interest Rate Increases
Indian state-run enterprises are moving to raise **175 billion rupees** ($1.93 billion) through bond sales this week. This surge in activity comes as firms rush to lock in financing before borrowing costs climb further toward the end of the fiscal year. Key issuers leading this wave include the National Bank for Financing Infrastructure and Development (**NaBFID**), Housing and Urban Development Corp (**HUDCO**), Small Industries Development Bank of India (**SIDBI**), and Power Finance Corp (**PFC**). These entities are navigating a high-rate environment to secure essential capital. Market attention is centered on **NaBFID**, which plans a **4,000 crore rupee** sale of 10-year bonds. With the 10-year government benchmark yield recently trading around **6.75%**, experts expect this paper to be priced at a spread of approximately **100 basis points** over sovereign levels. **HUDCO** is also active, planning a **1,500 crore rupee** perpetual bond issue. This is part of its significantly expanded borrowing plan, which was recently increased from **65,000 crore** to **80,000 crore rupees** for the current cycle. Analysts anticipate **HUDCO’s** three-year notes may carry rates between **7.75% and 8%**. The broader bond market is currently under pressure from heavy supply. Indian states recently held their largest weekly sale of the financial year, raising **486.15 billion rupees**. This massive influx of debt has pushed yields higher, making corporate fundraising more expensive and squeezing profit margins for state firms. Investor appetite remains a critical factor. While top-rated state companies still command interest, the success of these sales depends on their willingness to accept higher coupon rates. The **Reserve Bank of India** has maintained the repo rate at current levels, but the absence of liquidity-easing measures has kept the market cautious. Despite these challenges, corporate bond issuance in India has seen long-term growth, with outstanding volumes reaching **53.6 trillion rupees** in the recent fiscal year. State-owned firms continue to dominate this space, accounting for over **25%** of all issuances as they channel capital into infrastructure and industrial development.
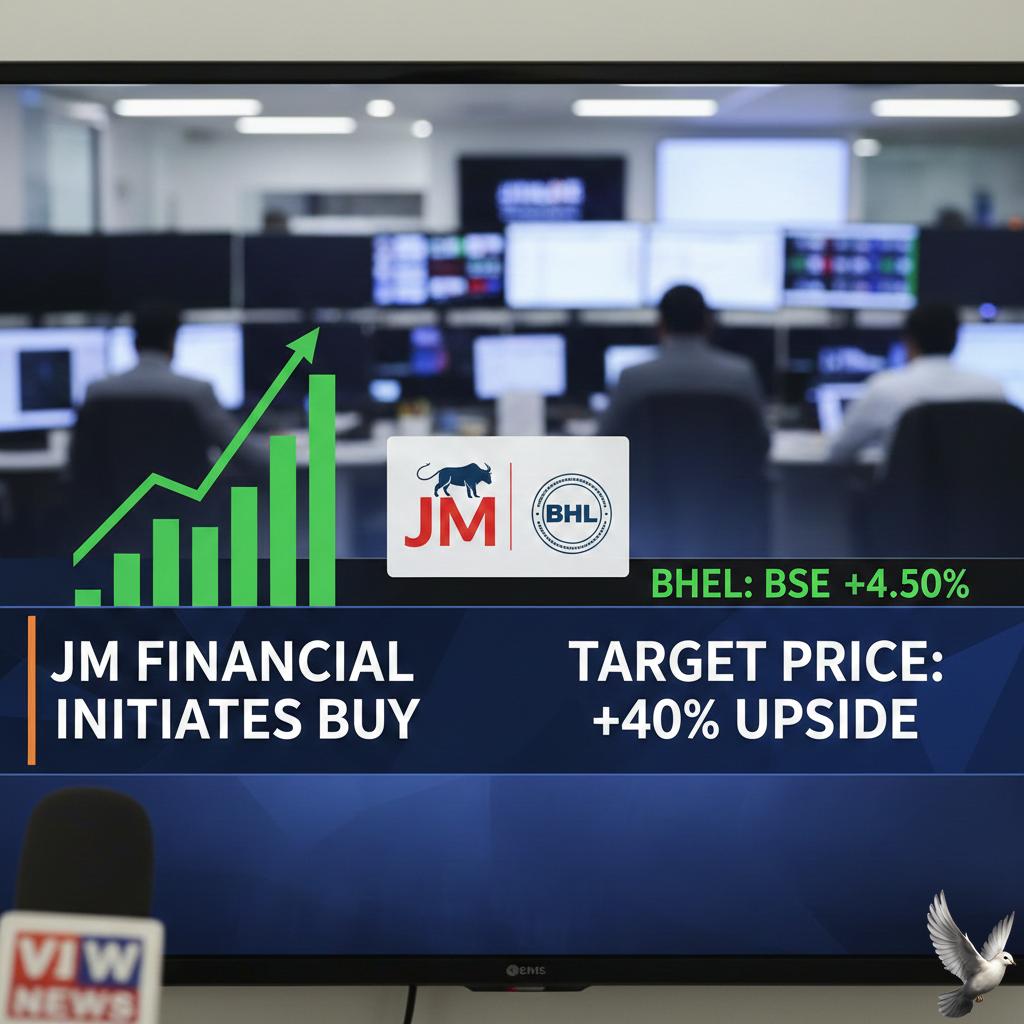
JM Financial Issues Buy Rating for BHEL with 40% Projected Upside
**BHEL Market Brief: Government OFS and Growth Outlook** The Indian government has initiated a significant stake sale in Bharat Heavy Electricals Limited (BHEL) through an Offer for Sale (OFS) starting February 11, 2026. The floor price is set at **Rs 254** per share, representing an **8% discount** to the previous closing price of **Rs 276.05**. The base issue covers a **3% stake**, with an additional **2% greenshoe option**, potentially raising up to **Rs 4,422 crore**. The market responded with immediate volatility, as BHEL shares fell approximately **6%** in early trading to hover around **Rs 260**. This price action reflects the typical short-term pressure associated with a large-scale divestment, though the OFS valuation remains pinned at roughly **21x FY28** estimated earnings. **Strategic Order Wins and Infrastructure Roadmap** Despite the immediate price dip, BHEL’s operational momentum is supported by a massive order book exceeding **Rs 2,00,000 crore**. A key highlight is the recent **Rs 5,400 crore** contract for a coal gasification and ammonium nitrate project in Odisha. This project marks the first commercial application of BHEL’s in-house pressurized fluidized bed gasification technology. The company is a primary beneficiary of India’s thermal power expansion roadmap. The Ministry of Power plans to add **97,000 MW** of coal-based capacity by 2035 to meet rising peak demand, which reached **241 GW** in 2025. With nearly **40 GW** of thermal capacity currently under construction nationwide, BHEL’s core power segment is positioned for sustained execution. **Financial Turnaround and Sector Performance** BHEL has demonstrated a sharp financial recovery, reporting a net profit of **Rs 382 crore** for the quarter ending December 2025. This follows a spectacular **254%** year-on-year profit surge in the preceding quarter. A critical driver for the bullish long-term outlook is the expansion of EBITDA margins, which recently climbed toward **7.7%** due to improved cost controls and better project execution. Beyond traditional coal, the company is diversifying into high-growth areas including nuclear power and coal gasification. These segments, alongside a robust industrial portfolio serving defense and railways, provide a hedge against the global shift toward renewables. Analysts maintain a wide but generally positive price target range, with some optimistic projections reaching **Rs 375**, citing the company’s pivotal role in India’s infrastructure-led growth narrative.

M&M Earnings: Stable Financials Amid Margin and Market Share Pressure
Mahindra & Mahindra (M&M) has reported a powerhouse performance for the third quarter of the 2025-26 fiscal year. The group has hit a historic milestone as its consolidated quarterly revenue crossed the **50,000 crore** mark for the first time, reaching **52,100 crore**. This represents a robust **26%** year-on-year increase. Profitability remains a standout highlight of the latest results. The standalone net profit surged by **33%** to reach **3,931 crore**. On a consolidated basis, the profit after tax (PAT) jumped an even more impressive **47%** to **4,675 crore**. When excluding specific regulatory impacts from new labour codes, the consolidated profit growth reaches **54%**. The automotive division continues to be the primary engine of growth. Total volumes for the quarter rose **23%** to over **302,000** units. Mahindra has solidified its leadership in the SUV category, commanding a revenue market share of **24.1%**, which is a gain of **90 basis points** compared to the previous year. Newer models are driving this momentum. The Mahindra 3XO has seen exceptional demand, contributing to the brand's highest-ever monthly SUV sales. While the 3XO and other fresh launches like the XUV 7XO and the recently introduced XEV 9S electric variant have impacted average selling prices, they have successfully captured a significant share of the premium and sub-compact segments. In the farm equipment sector, Mahindra maintains a dominant **44.0%** market share. While this reflected a marginal dip of **20 basis points** in the third quarter, the business remains highly profitable. Tractor volumes grew **23%** to approximately **150,000** units, and standalone margins in this segment expanded by **240 basis points** to reach **20.5%**. The services portfolio is also becoming a larger contributor to the bottom line. Tech Mahindra saw its EBIT margins improve by **290 basis points**, while Mahindra Finance reported a massive **97%** surge in profit. Additionally, Mahindra Logistics returned to profitability after nearly three years, further strengthening the group's diversified balance sheet. Investors have reacted positively to these developments. M&M shares recently traded near **3,700–3,780**, reflecting a gain of over **2%** following the earnings announcement. Market sentiment remains largely bullish, with 34 out of 35 tracking analysts maintaining a Buy or Strong Buy rating on the stock. [Mahindra Q3 FY26 Results Analysis](https://www.youtube.com/watch?v=LCEO6qKVvrs) This video provides a detailed breakdown of the 3XO's market impact and Mahindra's latest financial trajectory. http://googleusercontent.com/youtube_content/0
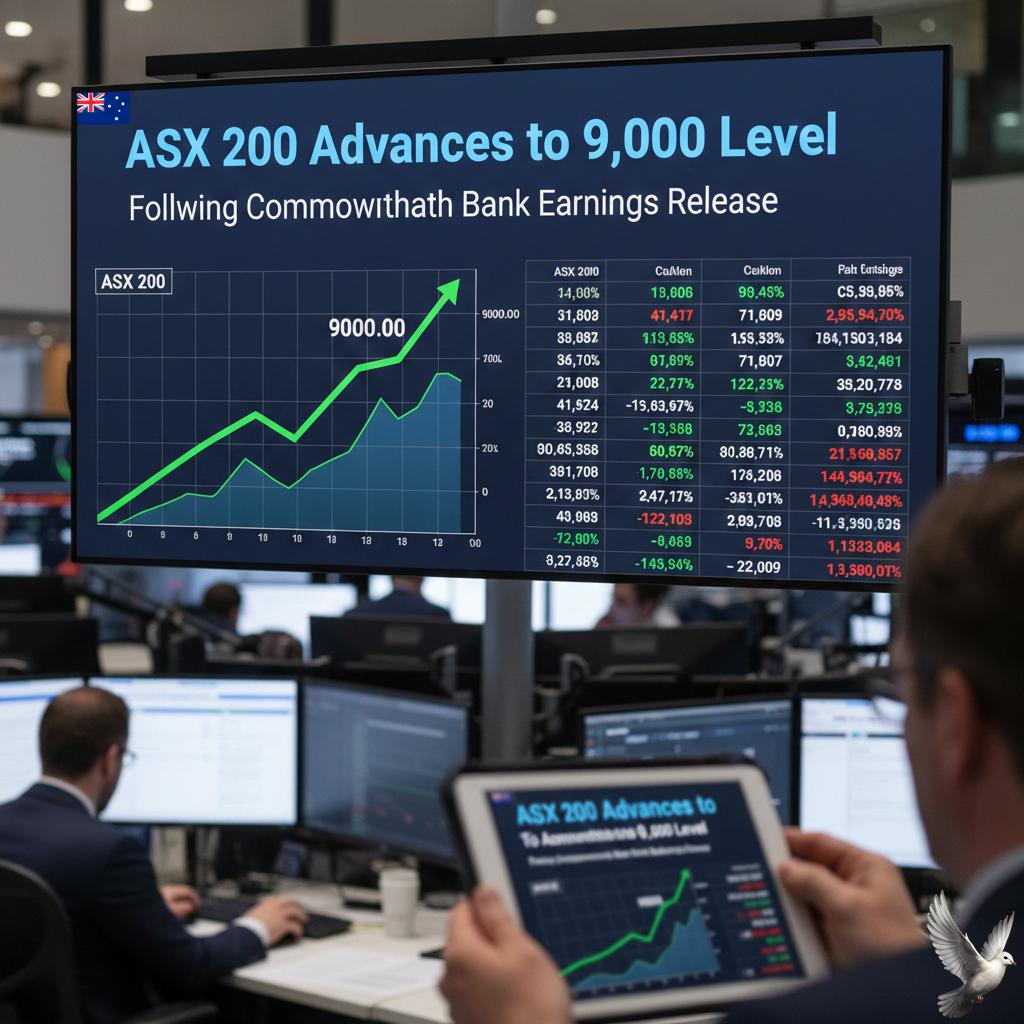
ASX 200 Advances to 9,000 Level Following Commonwealth Bank Earnings Release
Australian shares surged on Wednesday as the benchmark index reclaimed the psychologically significant **9,000-point** level. The rally was fueled by a dominant performance in the banking sector, which effectively countered a sharp sell-off in healthcare heavyweight CSL. The **S&P/ASX 200** closed up **1.66%**, or **147.40 points**, ending the session at **9,014.80**. This mark represents the strongest close for the index since late October 2025, signaling a renewed appetite for risk among local investors. Banking Sector Surge Commonwealth Bank of Australia (**CBA**) acted as the primary engine for the market's gains. Shares of the nation’s largest lender soared **7.99%** to close at **$171.42** following a robust half-year results announcement. CBA reported a record **$5.45 billion** half-year cash profit, supported by a **7%** increase in home loan balances and strong demand in the residential investment market. The bank also boosted its interim dividend to **$2.35** per share, exceeding analyst expectations. The "rising tide" of CBA's performance lifted the entire financial sector, which climbed **3.8%** as a whole: * **National Australia Bank (NAB)** rose **3.4%** * **Westpac** gained **2.1%** * **ANZ Group** added **1.5%** Healthcare Under Pressure In contrast, the healthcare sector hit its lowest level since May 2019. **CSL Limited** shares plummeted **13.74%**, closing at **$158.40** after a "dismal" earnings update. The biotech giant reported an **81%** drop in reported net profit to **$401 million**, weighed down by **$1.1 billion** in one-off costs and asset impairments. Investor confidence was further shaken by the sudden departure of CEO Paul McKenzie, with the stock briefly touching an eight-year low during intraday trade. Other Market Movers Energy and telecommunications also provided significant support to the benchmark index. **AGL Energy** shares jumped **11.75%** to **$9.89** after the utility beat half-year profit estimates and tightened its full-year earnings guidance. **Aussie Broadband** emerged as the top individual performer, rocketing **14.79%** to **$5.20**. The surge followed news of a strategic deal to acquire AGL Energy’s telecommunications business and customer assets. In the resources sector, **Evolution Mining** surged **8.21%** on the back of record half-year earnings and a **20-cent** interim dividend, while iron ore major **Rio Tinto** edged **1.40%** higher. Market sentiment remains focused on the ongoing corporate reporting season as a barometer for growth, providing a temporary distraction from persistent concerns regarding the timing of future interest rate movements by the Reserve Bank of Australia.
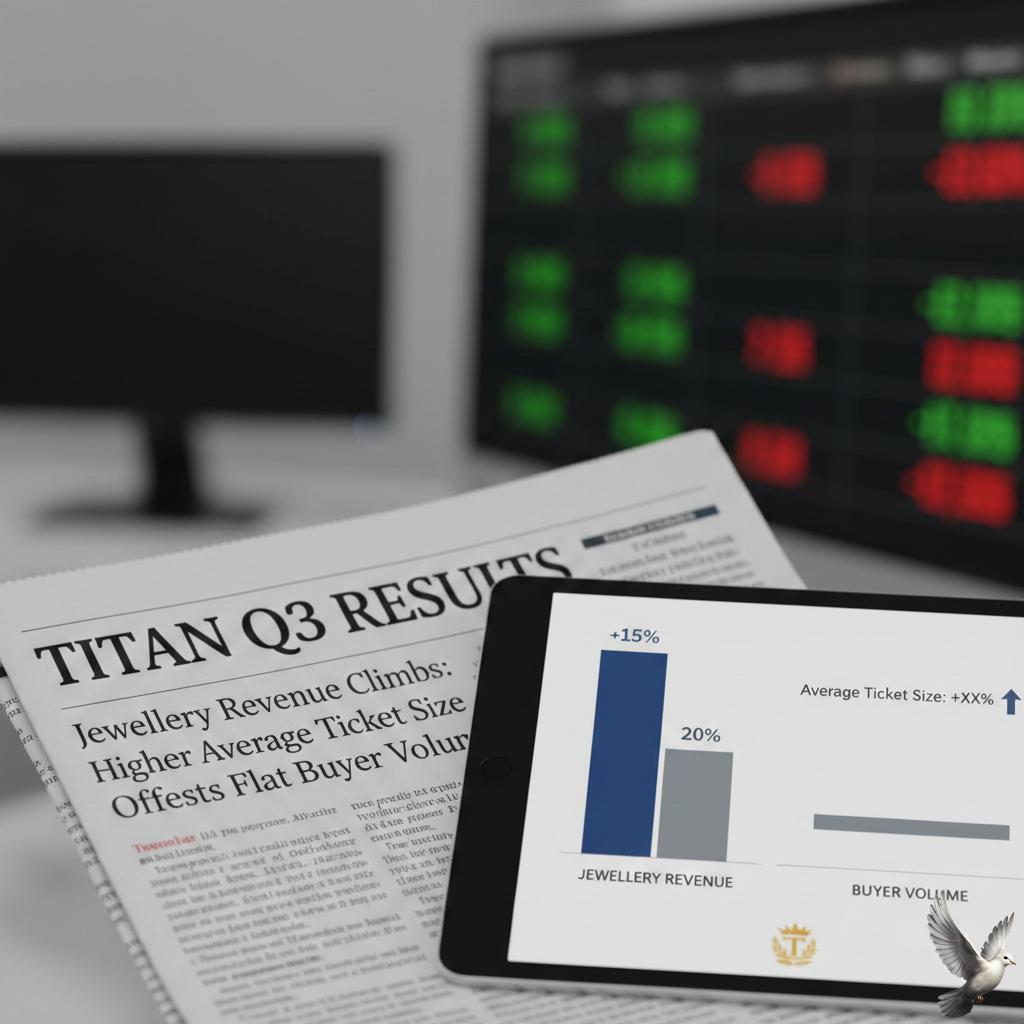
Titan Q3 Results: Jewellery Revenue Increases via Higher Average Ticket Size Amid Flat Buyer Volume
Titan Q3 FY26 Market Brief Titan Company delivered a standout performance in the third quarter of FY26, marked by a **61% year-on-year surge in consolidated net profit** to **₹1,684 crore**. This growth was primarily fueled by the jewellery division, which capitalized on a vibrant festive and wedding season. Total income for the quarter reached **₹25,416 crore**, representing a **43% increase** compared to the same period last year. The jewellery segment remains the dominant engine for the group, contributing **₹22,517 crore** to the top line with a **42% growth rate**. While gold prices remained elevated—hovering near **₹15,879 per gram for 24K gold** in February 2026—the company successfully converted these high rates into larger ticket sizes. Although customer footfall remained relatively flat, the average value per transaction rose significantly as buyers prioritized high-value items during auspicious periods. Strategic initiatives played a critical role in maintaining volume. Titan's gold exchange program saw substantial traction, as consumers traded in old gold to offset the impact of record prices. The domestic jewellery business, led by Tanishq, Mia, and Zoya, grew by **41%**, while the international segment reported a robust **83% jump** following aggressive expansion and the acquisition of a majority stake in Damas Jewellery. In the Watches and Wearables division, total income rose **14% to ₹1,295 crore**. The performance was anchored by the analog segment, which saw a **20% growth** in consumer sales driven by premiumization across the Titan, Fastrack, and Sonata brands. However, the wearables category faced headwinds, with smartwatch volumes declining by **27%** amid cooling demand in the mass-market tech segment. The EyeCare business also maintained a steady trajectory, with revenue climbing **18% to ₹231 crore**. This growth was supported by double-digit increases in both lenses and sunglasses. Overall operating margins for the company expanded by **155 basis points to 10.8%**, reflecting strong operational leverage and a favorable product mix across its lifestyle portfolio. Investor sentiment remains bullish following these results. Titan’s share price recently touched a new **52-week high of ₹4,378.40**, reflecting a year-to-date gain of approximately **6%**. Market capitalization currently stands above **₹3.8 trillion**, cementing Titan’s position as the leader in India’s organized retail and luxury goods sector. Emerging businesses, including fragrances and the Taneira saree brand, also showed promise with a **15% revenue increase**, further diversifying the group’s consumer footprint.
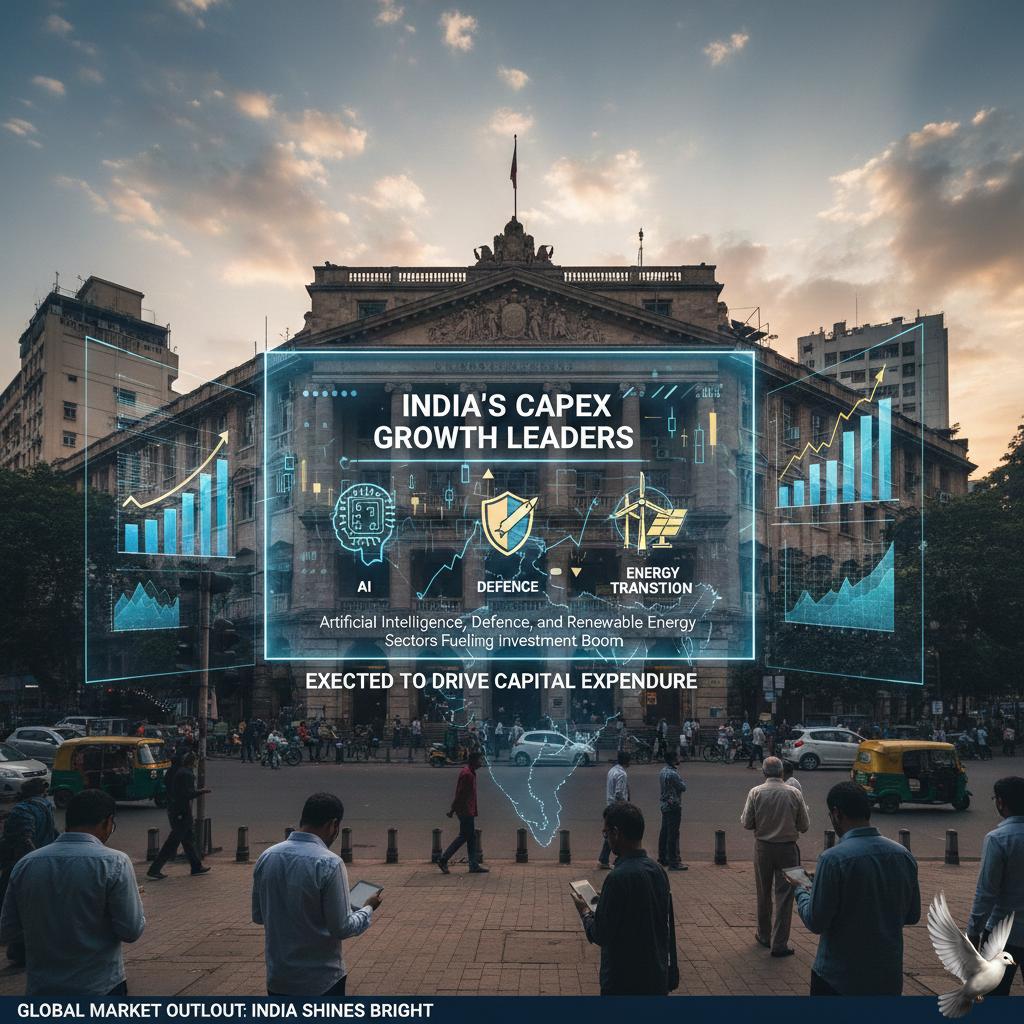
AI, Defence, and Energy Transition Expected to Lead India’s Capital Expenditure Growth
India is entering a phase of significant industrial expansion, characterized by a transition from incremental gains to a period of structural leadership. Recent data confirms a surge in industrial momentum, with the Index of Industrial Production (IIP) hitting a multi-year high of 7.8% growth. This revival is being led by a 8.1% jump in manufacturing, particularly in high-tech sectors like electronics and transport equipment, which are seeing growth rates exceeding 30%. The market is currently responding to a massive capital expenditure wave. The Union Budget 2026-27 has set a new benchmark by allocating 7.84 trillion INR (85.7 billion USD) to defense, a 15% increase aimed at achieving "Atmanirbharta" or self-reliance. This surge is creating a powerful multiplier effect across the domestic supply chain, especially as 2.19 trillion INR is dedicated specifically to capital outlay for modernizing military hardware through indigenous production. Artificial Intelligence has shifted from a buzzword to critical economic infrastructure. Under the IndiaAI Mission, a 103 billion INR investment is facilitating the deployment of 38,000 GPUs and the creation of AI Data Labs. This infrastructure is not just powering the tech sector but is being integrated into legacy manufacturing and banking to drive a long-term productivity cycle. Experts, including Morgan Stanley’s Chetan Ahya, view this AI-driven "smart manufacturing" as a key pillar that will sustain growth through the end of the decade. The energy transition is also attracting massive capital as India moves toward its net-zero goals. The new National Manufacturing Mission is prioritizing clean-tech production, from solar PV modules to green hydrogen. Specific budgetary incentives, such as customs duty exemptions on lithium-ion battery components and critical mineral processing, are designed to localize the clean energy supply chain and reduce import dependency. On the macroeconomic front, the Reserve Bank of India (RBI) is maintaining a delicate balance. While the central bank recently revised its FY26 inflation forecast slightly upward to 2.1%, the underlying core inflation remains muted at approximately 2.6%. The repo rate has been held steady at 5.25% with a neutral stance. This environment of stable rates and manageable inflation is expected to persist into 2027, providing the low-cost capital necessary to fund ongoing industrial expansion. India's export engine is also finding new gears. Recent trade agreements, such as the pact with the U.S., have significantly lowered tariffs on industrial goods. This has allowed companies in the tractor and heavy machinery sectors to target 500 million USD in exports over the next three years. As global demand for non-tech exports recovers in 2026, India's improving capacity utilization—currently around 74.8%—is poised to rise further, solidifying its position as a primary global manufacturing hub. [India's Manufacturing Momentum](https://www.youtube.com/watch?v=4HaSrmqE3mM) This video provides an expert analysis from Morgan Stanley's Chetan Ahya regarding India's potential to be the biggest economic surprise in Asia for 2026. http://googleusercontent.com/youtube_content/0

**US Equity Markets Shift Away From Stocks Disrupted by AI**
Market dynamics are shifting as Wall Street transitions from a "buy everything AI" phase to a strategic sell-off of traditional firms vulnerable to automation. Investors are increasingly focused on avoiding potential disruption rather than chasing winners, leading to a "sell first, ask questions later" mentality across service-heavy industries. Financial Services and Wealth Management The wealth management sector recently faced intense pressure following the launch of an AI-powered tax-strategy tool by the startup Altruist. The product, which automates personalized tax planning and analyzes financial documents without manual input, triggered a significant retreat in major stocks. On **February 10, 2026**, market reactions were swift: * **Raymond James Financial** plummeted **8.8%**, its steepest decline in years. * **LPL Financial Holdings** dropped **8.3%**. * **Charles Schwab** shares fell **7.4%**, moving away from its recent high of **$107.21**. This trend reflects deep-seated fears that AI will disintermediate human advisors and compress long-standing fee structures. Broader Sector Disruption The anxiety is not limited to finance. In early **February 2026**, product rollouts from firms like Anthropic and Insurify sparked similar panics in other verticals: * **Legal and Software:** Anthropic’s new productivity tools for in-house legal teams caused a sharp sell-off in legal software and information-services firms like **Thomson Reuters** and **RELX**. * **Insurance:** The S&P 500 insurance index sank **3.9%** in a single session after an AI-driven car insurance comparison tool raised concerns about the long-term viability of traditional brokers. * **Business Software:** Established players like **Salesforce** and **Adobe** have faced months of volatility as the market questions if their SaaS business models are becoming obsolete. Even **Palantir**, a former AI darling, saw shares drop more than **11%** in recent trading. The Great Divergence A "Great Divergence" is forming in the technology trade. While software and service companies are being penalized, infrastructure providers continue to attract massive capital. * **Capital Expenditure:** Hyperscalers (Alphabet, Meta, Microsoft, and Amazon) are projected to spend a combined **$527 billion** in **2026**, up from **$465 billion**. * **Semiconductors:** This sector remains a primary pillar, with global sales reaching **$179.7 billion** in a single quarter, supported by nearly **20%** year-over-year growth. * **Valuation Gaps:** AI infrastructure and chip companies are being rewarded for visible revenue links, while "AI Productivity Beneficiaries" are underperforming due to uncertainty regarding the timing of actual earnings gains. Strategic Outlook The narrative has shifted toward a "Crisis of Distinctiveness." In content-centric sectors like marketing and legal services, the abundance of low-cost synthetic assets is devaluing traditional service models. Current market data suggests that while high-net-worth clients still value human relationships, the administrative and technical aspects of wealth management—such as trade execution, tax harvesting, and compliance—are being rapidly commoditized by autonomous agents. Investors are now pricing in a future where only firms that successfully augment their staff with AI, rather than competing against it, will survive margin compression.

Copper Prices Rise Amid Weak Dollar and Softening Pre-Holiday Demand in China
Market Brief: Copper Resilience Amid Seasonal Lull **Copper prices** nudged upward this Wednesday, February 11, 2026, as a retreating **U.S. Dollar** provided a timely cushion for the metal. The greenback hit its lowest level since late January, making dollar-denominated commodities more attractive to international buyers. On the **London Metal Exchange (LME)**, benchmark three-month copper edged up **0.31%** to reach **$13,155** per ton. This follows a volatile period where prices hit historical peaks near **$14,500** per ton in late January before settling into the current consolidation range. Seasonal Demand and China’s Influence The market is currently navigating a significant seasonal slowdown. China, the world's largest consumer of the metal, is entering its **nine-day Lunar New Year** break. This holiday officially begins over the coming weekend and extends through **February 23**. Trading activity in Asia has thinned out as factories and construction sites suspend operations. Some Chinese rod and pipe producers reportedly halted production as early as **January 25**, with some not expected to resume until **March**. High raw material costs have also impacted the order books of Chinese fabricators, leading to a deliberate cooling in physical procurement. Inventory Dynamics Global inventory levels are showing a notable build-up, reflecting the current drop in immediate industrial demand: * **LME warehouse stocks** rose to **189,100** tons, the highest level since last May. * **Shanghai Futures Exchange (SHFE)** inventories surged to **248,911** tons, marking their highest point since March 2025. * **Total global stockpiles** across major exchanges have reached approximately **970,000** tons, representing a **21-year high** in accumulation. Long-Term Outlook Despite the short-term seasonal dip and rising inventories, the structural outlook for copper remains focused on a looming supply-demand imbalance. Major financial institutions forecast that while a small surplus of roughly **160,000** tons may exist through 2026, the global push for electrification and digital infrastructure is expected to drive a significant deficit by **2029**. For the first half of 2026, analysts anticipate prices will largely remain in the **$13,000** per ton range, finding strong technical support around the **$13,050** mark as market participants wait for Chinese industrial activity to normalize in March.
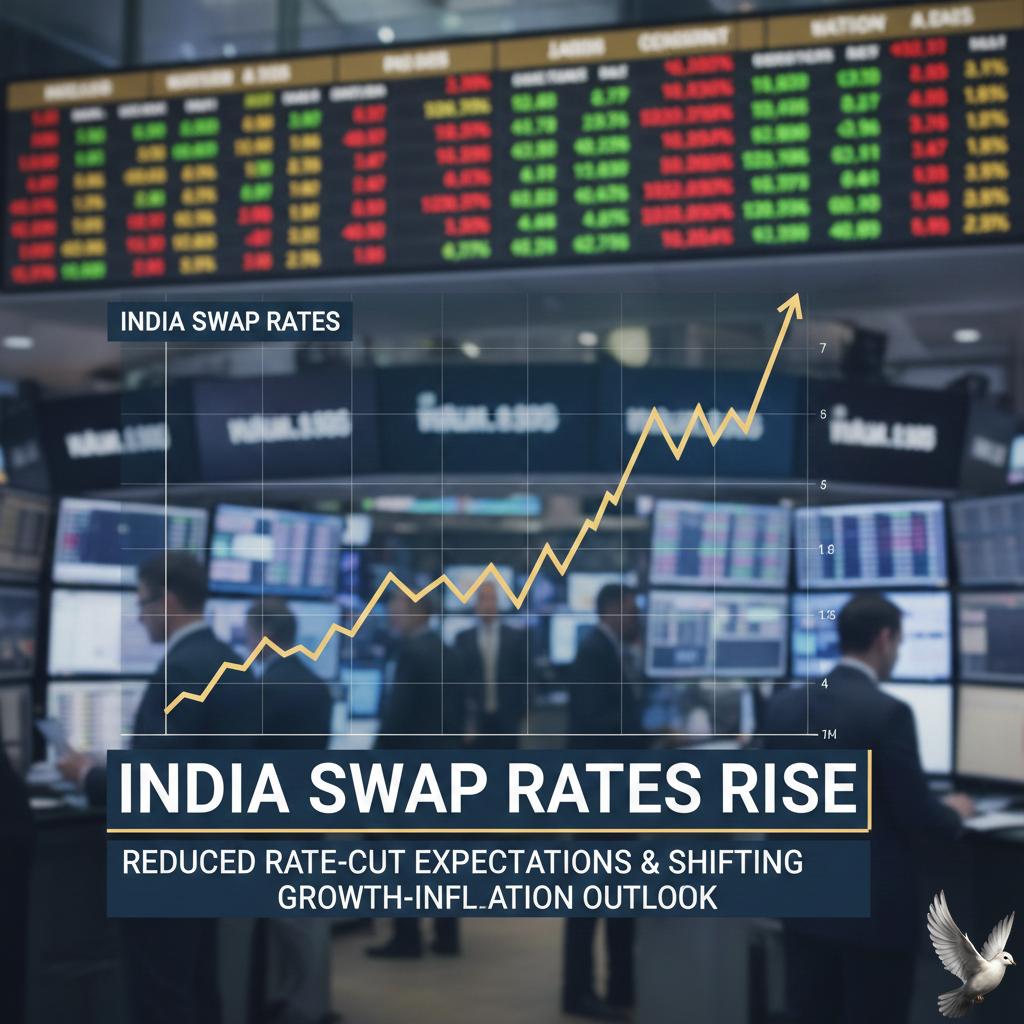
India Swap Rates Rise on Reduced Rate-Cut Expectations and Shifting Growth-Inflation Outlook
India’s financial markets are signaling a definitive shift in the monetary landscape. Recent data from the overnight indexed swap (OIS) market suggests that the Reserve Bank of India’s rate-cut cycle has likely concluded. Short-term rates have stabilized following the central bank’s decision on **February 6, 2026**, to maintain the repo rate at **5.25%**. While the RBI has implemented a cumulative **125 basis point** reduction since early 2025, the market is now pricing out further easing. Yield Curve Dynamics The OIS curve is experiencing a notable re-steepening. The **1-year OIS rate** currently stands at **5.50%**, which is **25 basis points** above the current repo rate. This premium indicates that traders are no longer betting on cuts and are instead beginning to factor in the possibility of a rate hike within the next **12 months**. Longer-tenor swaps are feeling upward pressure as well. The actively traded **5-year OIS** has climbed to **6.15%**, rising roughly **23 basis points** since the start of January. This movement reflects a market bracing for a transition from ultra-accommodative conditions to a more neutral environment. Growth and Inflation Outlook The hawkish tilt in swap rates is driven by a robust domestic economic trajectory. India’s real GDP growth for the **2025-26** fiscal year is now estimated at **7.4%**, up from previous projections. The outlook for early **2026-27** remains strong, with growth forecasted at **6.9%** for the first quarter and **7.0%** for the second. Inflation, while currently sitting at a low **1.3%** as of December, is expected to accelerate. Base effects and rising prices in precious metals are projected to push headline CPI to **3.2%** by March and further toward **4.2%** by mid-2026. This anticipated "U-turn" in price growth is a primary catalyst for the rising yields in longer-dated instruments. Bond Market Pressure The sovereign bond market is simultaneously grappling with a heavy supply of debt. State governments recently scheduled a massive auction of **486.15 billion rupees**, the largest weekly issuance of the year. This surge in supply has pushed the **10-year benchmark bond yield** toward the **6.80%** mark. Despite the RBI’s historical interventions—purchasing a record **6.83 trillion rupees** of debt this financial year—the lack of fresh liquidity measures in the February policy meeting has left investors cautious. The current environment favors an accrual-based strategy, as market participants align themselves with a "higher for longer" interest rate reality.
BPCL Share Price Performance and Market Trends Today
**TECH MARKET BRIEF: SEMICONDUCTOR & AI SECTOR UPDATE** The global semiconductor market is currently navigating a period of unprecedented expansion, with total industry sales projected to reach **$975 billion** in **2026**. This represents a **25%** year-on-year surge, driven almost entirely by the transition of artificial intelligence from experimental pilots to the backbone of enterprise architecture. Industry data indicates that while AI chips represent less than **0.2%** of total unit volume, they now account for approximately **50%** of total sector revenue. This structural divergence highlights a high-margin, low-volume paradigm that is reshaping global supply chains. **NVIDIA: PERFORMANCE & VALUATION** As of **February 11, 2026**, NVIDIA (NVDA) remains the primary beneficiary of this infrastructure boom. The stock is currently trading near **$188.54**, maintaining a formidable market capitalization of approximately **$4.58 trillion**. Financial performance continues to break records, with the company reporting **$57 billion** in revenue for its most recent quarter—a **62%** increase from the previous year. Most of this growth is concentrated in the Data Center segment, which contributed **$51.2 billion** to the total. Looking ahead to the upcoming earnings report on **February 25**, management has guided for revenue of **$65 billion**. Analysts maintain a bullish outlook, with price targets reaching as high as **$352** for the next **12 months**. **SUPPLY DYNAMICS & INFRASTRUCTURE SPENDING** The sector is facing significant pressure from a "high-stakes paradox." While demand for Blackwell architecture processors is described as "off the charts," global memory shortages have forced the prioritization of AI accelerators over consumer gaming hardware. * **Hyperscale Capex:** Major tech platforms (Amazon, Microsoft, Alphabet, and Meta) are projected to invest **$600 billion** in AI infrastructure in **2026**. * **Memory Pricing:** Severe shortages in essential components are expected to drive **50%** price spikes by mid-year. * **Energy Constraints:** The rapid buildout of gigawatt-scale "AI factories" is increasingly straining global electric power grids. **STRATEGIC TRENDS & NEW HARDWARE** The market is shifting toward "Physical AI"—systems capable of reasoning about the physical world. NVIDIA’s recent partnership with Dassault Systèmes to build industrial AI platforms exemplifies this move toward science-based virtual twins and autonomous manufacturing. On the hardware front, rumors point to a new flagship GPU, potentially the **RTX Titan** or **RTX 5090 Ti**, targeted for a **Q3 2026** release. In the interim, the company has introduced the **Vera Rubin** platform and **Spectrum-X** Ethernet switches to maintain its **90%** share of the AI data center processor market. Regional growth remains strongest in the **Americas and Asia Pacific**, which together hold over **80%** of the market share for logic and memory devices. The sector continues to consolidate as leadership moves beyond capturing demand to managing systemic supply risks.
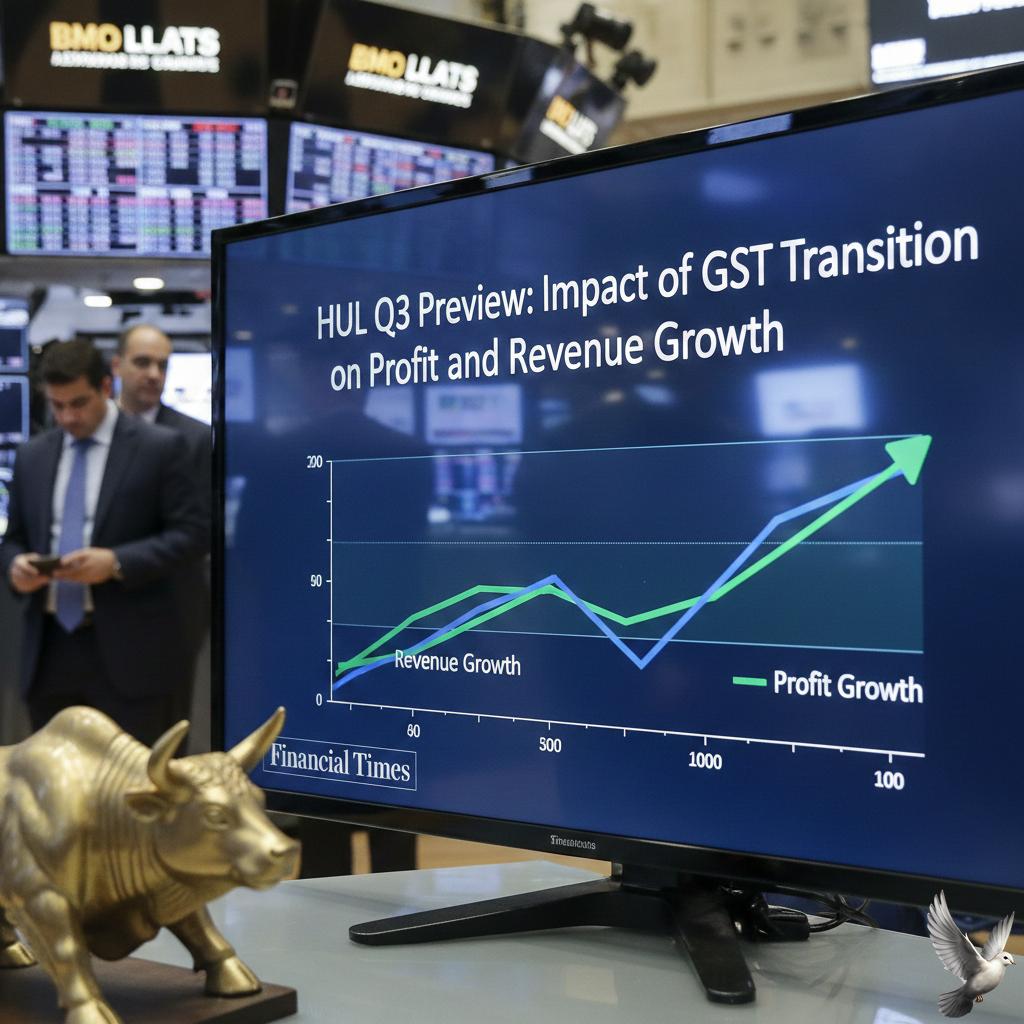
HUL Q3 Preview: Impact of GST Transition on Profit and Revenue Growth
Market Brief: Hindustan Unilever (HUL) Q3 FY26 Outlook Hindustan Unilever Ltd is scheduled to release its third-quarter financial results on **February 12, 2026**. This earnings cycle is particularly significant as it follows the recent demerger of the company's ice cream business into Kwality Wall’s India Ltd. Revenue and Profit Projections Market analysts anticipate a steady but nuanced performance. Total revenue is projected to grow by approximately **4%** year-on-year, reaching an estimated **16,022 crore**. This growth is supported by a recovery in festive consumption and a gradual stabilization of demand. Reported Net Profit is expected to average **2,568 crore**, representing a marginal **1%** increase from the same period last year. On a sequential basis, Profit After Tax is poised to rise by roughly **4%** compared to the preceding quarter. Volume and Margin Trends Underlying volume growth is forecasted to remain modest, hovering between **2%** and **3%**. The company has faced a transitional phase due to the implementation of the **GST 2.0** regime, which initially disrupted sales in October before demand normalized in November. The EBITDA margin is expected to settle around **23.6%**, reflecting a small uptick of **20 basis points**. This margin stability is largely attributed to the exit of the lower-margin ice cream segment and relatively stable prices for key raw materials like tea and certain chemicals. Strategic Market Drivers Rural India continues to show signs of resilience. Government initiatives in the **2026 Union Budget** aimed at boosting farmer incomes and improving rural infrastructure have created a favorable environment for volume recovery in Tier-2 and Tier-3 markets. Pricing power remains a critical focus. While inflationary pressure in palm oil exists, deflation in other commodities has allowed HUL to maintain stable pricing. Investors are closely monitoring management commentary regarding the "like-for-like" performance post-demerger and the long-term impact of GST rate rationalization on 40% of the company's portfolio. Current Market Standing Ahead of the results, HUL shares have shown a bullish trend, trading near **2,460** on the NSE. The stock has gained over **5%** since the start of the year, with a market capitalization exceeding **5.77 lakh crore**. Brokerages maintain a generally positive outlook, citing the company's strong distribution network and potential for premiumization in the beauty and personal care segments.

Tata Consumer Share Price: Daily Market Performance
NVIDIA Market Intelligence | February 2026 **Stock Performance and Market Value** NVIDIA continues to maintain its position as a global financial heavyweight, with a market capitalization currently holding at **$4.62 trillion**. As of mid-February 2026, the stock is trading near **$189**, reflecting a year-to-date increase of approximately **15%**. This performance significantly outpaces the broader semiconductor industry’s average growth of **8%**. While the stock has experienced periods of sideways movement since late 2025, investor sentiment remains largely "Buy" across major analysts. A key price target of **$253** is being watched as the market anticipates the upcoming earnings report scheduled for **February 25, 2026**. **Operational Financials** The fiscal year 2026 has been defined by record-breaking revenue milestones. In the most recent quarterly data, the company reported record revenue of **$57 billion**, a **62%** increase year-over-year. This growth is underpinned by exceptionally strong gross margins, which have stabilized at **73.6%**. Capital returns to shareholders have also been aggressive. During the first nine months of the current fiscal cycle, the firm returned **$37 billion** through share repurchases and cash dividends. The company maintains a remaining repurchase authorization of over **$62 billion**. **Data Center and AI Infrastructure** The Data Center segment remains the primary engine of growth, contributing **$51.2 billion** in a single quarter—up **66%** from the previous year. Demand for AI compute is described as "compounding," with cloud GPUs effectively sold out across major providers. The transition to the **Blackwell** architecture is moving at a rapid pace. Blackwell data center revenue recently grew by **17%** sequentially, and the platform is achieving **10x** the throughput per megawatt compared to previous generations. This efficiency is critical as the market shifts toward larger, more integrated AI clusters. **Competitive Landscape and Sector Trends** NVIDIA currently commands an estimated **55%** share of the total AI chip market. However, the landscape is becoming increasingly crowded. Major cloud providers are shifting toward custom silicon, and competitors like AMD are securing high-profile contracts with their latest accelerator series. The broader AI chip market is projected to reach **$121.73 billion** by the end of 2026. This expansion is driven by several key factors: * Rising demand for **autonomous vehicle** systems * Increased investment in **Edge AI** for real-time processing * Exponential growth in **Generative AI** video and agentic workloads **Strategic Outlook** Management has set a revenue target of **$65 billion** for the upcoming quarter. Growth is expected to be supported by the full-scale production of the DRIVE AV software platform for intelligent transportation and new professional visualization tools. Despite geopolitical constraints and export licensing shifts, the "virtuous cycle" of AI adoption across new industries—particularly in manufacturing and healthcare—continues to provide a robust floor for demand throughout 2026.

HCL Tech Share Price: Market Performance and Updates
Market Brief: India Equities and Macros **Wednesday, February 11, 2026** The Indian equity benchmarks remained resilient today as the **Nifty 50** hovered near the psychological **26,000** mark. The index traded around **25,951**, up by approximately **19 points**. The **BSE Sensex** mirrored this steady performance, holding firm at **84,270**. This follows a three-session winning streak fueled by the revival of foreign inflows and optimism surrounding the **India-US trade agreement**. Key Market Indicators Foreign Portfolio Investors (FPIs) have returned as net buyers, injecting **$1.7 billion** into Indian equities so far in February. This shift ends a three-month selling streak and provides significant liquidity support to the domestic market. Domestic Institutional Investors (DIIs) continue to provide a floor to the market, recording net purchases of **1,174 crore** in recent sessions. Market volatility, measured by the **India VIX**, remains low, staying below the **12** level. Sector Performance and Stocks The **Auto** and **Healthcare** sectors are leading the current momentum. **Mahindra & Mahindra** rose **1.8%** on strong quarterly expectations, while **Tata Steel** gained **2.9%** amid a rally in metal stocks. **State Bank of India (SBI)** hit a historic all-time high of **1,153.85**, outperforming the broader market with a yearly return of over **58%**. Conversely, the **IT sector** faced pressure, with **HCL Tech** slipping **2%** and **TCS** down **0.9%**. Profit-booking was also visible in **Bajaj Finance** and **Bharti Airtel**. Commodities and Currencies Gold prices saw a minor correction today after a sharp rally. **24 Karat gold** is trading at **15,851 per gram**, down by **27**. **Silver** prices remain steady at approximately **2.60 lakh per kg**. In the energy segment, **Brent Crude** is hovering around **$67.50 per barrel**, reflecting a slight decline. The **Indian Rupee (INR)** has shown stability following the recent RBI policy, trading near **90.52** against the US Dollar. Economic Outlook The **Reserve Bank of India (RBI)** maintained the repo rate at **5.25%** in its February meeting, keeping a "Neutral" stance. The central bank raised its **GDP growth forecast** for **FY26** to **7.4%**, up from **7.3%**. **Retail inflation** is projected at **2.1%** for the current fiscal year, remaining well within the target band. Optimism is further bolstered by the **Indo-US trade deal**, which targets a total trade value of **$500 billion**, and a similar pact with the **European Union**.

Cipla (CIPLA) Closing Share Price
Market Brief: NVIDIA Performance and Outlook NVIDIA continues to solidify its position as the primary architect of the global AI infrastructure. As of **February 11, 2026**, the company maintains a dominant market share of approximately **85% to 90%** in the AI accelerator space. The market capitalization currently stands at approximately **$4.62 trillion**. This follows a period of high volatility where the stock reached a **52-week high of $212.19** before stabilizing. The current stock price is trading near **$188.54**, reflecting recent investor caution ahead of the next major fiscal milestone. Financial Trajectory and Revenue Drivers Revenue growth remains aggressive, driven almost entirely by the Data Center segment. In the most recent reported quarter, NVIDIA achieved a record **$57 billion** in total revenue, marking a **62%** increase year-over-year. The Data Center division alone contributed **$51.2 billion** of that total. This surge is fueled by massive capital expenditure from "hyperscalers" like Amazon, which has guided for over **$200 billion** in AI-related spending for **2026**. Profitability remains exceptionally high. Non-GAAP gross margins are currently holding at **73.6%**, with management targeting the mid-**70%** range by the end of the fiscal year. Product Roadmap: Blackwell to Rubin The transition from the Blackwell architecture to the next-generation Rubin platform is the primary focus for institutional investors. Blackwell B200 and B300 units are currently the industry standard, supporting the shift toward "Agentic AI" with high memory capacities of up to **192GB**. The upcoming **Rubin (R100)** architecture, expected to ship in mid-**2026**, represents a significant technological leap. It will be the first to integrate **HBM4 memory** and **NVLink 6** interconnects. Early performance projections suggest the Rubin NVL144 system will offer **3.6 EFLOPS** of compute power. This is a massive increase compared to the **1.1 EFLOPS** provided by the current Blackwell-based solutions. Competitive Landscape and Headwinds Despite its lead, NVIDIA faces a shifting competitive landscape. Competitors like AMD have captured roughly **7% to 8%** of the market with their MI350 series. Simultaneously, major customers including Google, Amazon, and Meta are increasingly developing in-house custom silicon to reduce reliance on NVIDIA's high-margin GPUs. Geopolitical factors also remain a variable. Recent export control limitations on specific hardware have resulted in significant revenue adjustments, with some estimates suggesting a loss of nearly **$8 billion** in potential regional sales due to licensing restrictions. Upcoming Catalysts The next critical event for the market is the earnings report scheduled for **February 25, 2026**. Analysts are projecting a revenue target of **$65 billion** for the upcoming quarter. Investors are looking for confirmation that demand for AI training and inference remains "off the charts" and that the supply chain can keep pace with the rapid rollout of the Rubin architecture.
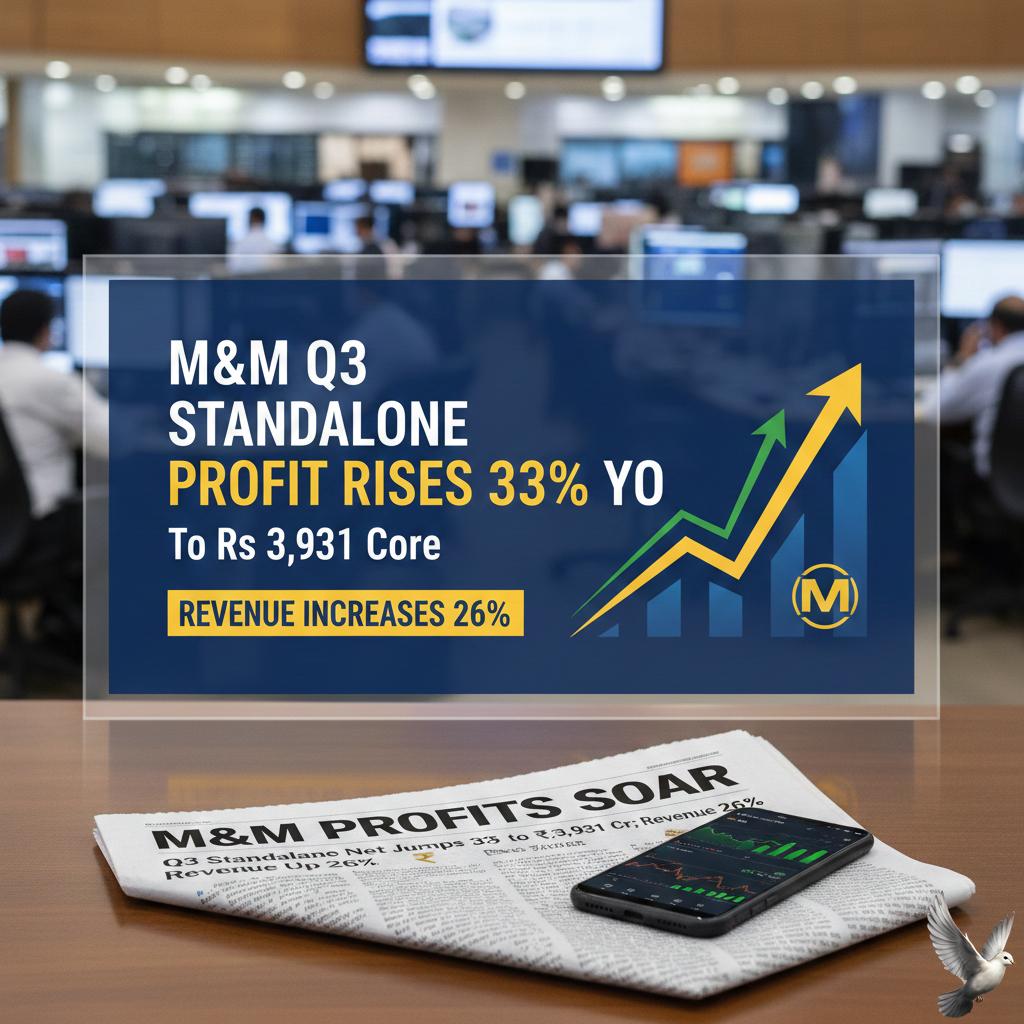
M&M Q3 Standalone Profit Rises 33% YoY to Rs 3,931 Crore as Revenue Increases 26%
Mahindra & Mahindra (M&M) has reported a powerhouse performance in its latest quarterly results, driven by an aggressive expansion in the SUV and tractor markets. The company’s consolidated revenue from operations surged to **41,470 crore**, marking a **17%** year-on-year increase. This growth was accompanied by a robust **20%** rise in consolidated profit after tax (PAT), which reached **3,181 crore**. The automotive division remains the primary engine of growth. M&M successfully secured the **#2** position in India's passenger vehicle market this February, capturing a **13.24%** market share. In the high-margin SUV segment, the company maintained its leadership with a **23%** revenue market share, a gain of **200 basis points**. SUV volumes alone grew by **20%** during the quarter, with total monthly sales in February reaching **50,420** units. Top-performing models continue to dominate their respective categories. The Scorpio series led the charts with **13,618** units sold in February, followed by the Thar and Roxx duo at **9,248** units. The XUV 3XO saw the highest year-on-year surge, with sales jumping **86%** to reach **7,861** units. Despite general industry headwinds, M&M’s utility vehicle portfolio remains resilient, outpacing several key competitors who saw volume dips in the same period. In the farm equipment sector, M&M achieved its highest-ever third-quarter market share at **44.2%**, up by **240 basis points**. Tractor sales for February stood at **23,880** units in the domestic market, reflecting a **19%** growth. This segment also saw significant margin expansion, with standalone profit before interest and tax (PBIT) margins rising to **18.1%**. The company is now pivoting sharply toward its "Born Electric" future. The recent unveiling of the **XEV 9S**, a flagship 7-seater electric SUV, marks a critical milestone. Starting at an aggressive price of **19.95 lakh**, the model is built on the new INGLO platform and promises a real-world range of **500 km**. Early market reception for new EV models like the **BE 6** and **XEV 9e** is already visible, with combined sales reaching **3,196** units in February. Financial services and IT arms also contributed to the group's stability. Mahindra Finance reported a **19%** growth in Assets Under Management (AUM), while Tech Mahindra saw an EBIT margin improvement of **480 basis points**. On the stock market, M&M shares recently touched a 52-week high of **3,276**, reflecting strong investor confidence in the company’s dual-track strategy of maintaining internal combustion dominance while scaling electric mobility. Looking ahead, the company is managing a high order backlog, with waiting periods for popular models like the XUV 7XO extending up to a year. With a healthy liquidity buffer of over **9,300 crore**, M&M is well-positioned to fund its upcoming EV pipeline and sustain its market-leading momentum across the automotive and agricultural landscapes.

Brokerages Raise Eicher Motors Target Price to Rs 8,800 Following Latest Analysis
**Eicher Motors: Q3 Performance and Market Brief** Eicher Motors shares surged to a fresh record high today, hitting an intraday peak of **7,805 INR** on the NSE. This rally follows a robust Q3 FY26 earnings report that exceeded analyst expectations and triggered a wave of price target upgrades across major brokerages. The parent company of Royal Enfield reported a **21%** year-on-year increase in consolidated net profit, reaching **1,421 crore INR**. Revenue from operations climbed significantly to **6,114 crore INR**, a **23%** growth compared to the same period last year. This performance was underpinned by a record-breaking festive season and a strategic boost from recent tax policy changes. **Royal Enfield Performance** The motorcycle division achieved a historic milestone, with annual domestic sales surpassing **1 million units** for the first time in a calendar year. For the October-December quarter, Royal Enfield sold **325,773 motorcycles**, marking a **21%** volume growth. Demand was particularly concentrated in the 350cc segment, where the company maintains a dominant market share of approximately **95%**. This segment benefited directly from the reduction in GST rates to **18%**, which allowed the brand to pass on price cuts of up to **22,000 INR** to consumers. **Commercial Vehicle Momentum** The Volvo-Eicher Commercial Vehicles (VECV) joint venture also delivered its strongest-ever quarterly performance. Sales volumes rose **24.2%** to **26,086 units**, contributing **183 crore INR** to the group's bottom line. Revenue from VECV operations increased by **21%** to **7,019 crore INR**, supported by leadership in light-to-medium duty trucks and record heavy-duty truck sales. **Growth Outlook and Strategy** The board has approved a major investment of **958 crore INR** to expand production capacity in Tamil Nadu. This expansion aims to increase annual capacity to **2 million units** to meet rising domestic and international demand. Management has provided a confident outlook for FY27, expecting to outperform the broader two-wheeler industry's high single-digit growth. The company is also preparing for a significant entry into the electric vehicle market and the premium 750cc segment to strengthen its global footprint. **Market Valuation** The company’s market capitalization has now crossed **2.14 lakh crore INR**. Following the results, at least 12 brokerages raised their price targets. Current analyst targets range from **7,500 INR** to as high as **8,300 INR**, citing improved EBITDA margins—which reached **25.46%** this quarter—and a resilient premiumization trend in the Indian market.

Titan Company Shares Rise Following 61% Year-over-Year Q3 Profit Growth
Market Brief: Global Equity and Macro Update **February 11, 2026** Global equity markets are navigating a period of measured optimism tempered by significant shifts in the labor market and central bank policy. Sentiment is currently driven by a transition from the aggressive rate-cutting cycles of 2025 to a "simultaneous hold" strategy, with approximately **70%** of central banks now maintaining steady interest rates. Domestic Equity Performance Indian benchmark indices show resilience, with the **Nifty 50** holding firm above the **25,950** mark and the **S&P BSE Sensex** trading near **84,288**. This momentum is supported by the recently signed India-US interim trade deal and steady foreign institutional inflows. The automotive sector is leading the rally, with the **Nifty Auto Index** surging over **2%** today and climbing **4.5%** over the last three sessions. Financials also show strength as the **Bank Nifty** sustains its position above the psychological **60,000** level. US Economic Catalysts All eyes are on the high-stakes **January Non-Farm Payrolls (NFP)** report, released today following a federal government shutdown delay. Markets are targeting a "Goldilocks" figure between **80,000** and **100,000** jobs to support equity valuations without reigniting inflation fears. The **US Dollar Index (DXY)** remains steady at **96.87**, while the **10-year Treasury yield** has softened to **4.18%**. Investors are pricing in a shift in Fed leadership toward a more "pragmatic" stance as the probability of a March rate cut remains a central debate for the **Dow Jones**, which is currently seeing futures rise by over **100** points. Commodities and Currencies Gold has climbed above **$5,060** per ounce, supported by a weakening dollar and persistent central bank demand, particularly from the PBoC. Silver has also seen a recovery, trading near **$82.41** with a **2%** daily gain. In the energy sector, **Brent Crude** is hovering around **$69.17** per barrel. The **Indian Rupee** has strengthened slightly to **90.57** against the dollar, benefiting from localized trade optimism and narrowing yield spreads. Strategic Outlook The global growth forecast for 2026 remains subdued at **2.6%**, with a **35%** probability of a recession lingering. However, corporate earnings remain a pillar of stability, particularly in the tech and auto sectors. Investors are now focused on upcoming inflation data and the finalization of the **Union Budget 2026** priorities, which are expected to dictate the next leg of the emerging market rally. Stability in the labor market and the trajectory of AI-driven capital expenditure continue to be the primary drivers of long-term risk appetite.

Nifty 500 Promoter Holding Reaches Record Low Amid Consistent Stake Sales: Motilal Oswal
Indian equity markets are undergoing a historic transformation in ownership structure. As of February 2026, promoter holdings in listed companies have reached an all-time low of 48.8%. This steady decline is primarily driven by high valuations and a vibrant primary market, allowing founders to liquidate stakes at elevated price levels. Domestic Institutional Investors (DIIs) have emerged as the new anchor for Indian stocks. Their ownership hit a record peak of 20.6% in December 2025, a significant jump from previous years. This surge is fueled by consistent retail participation through Systematic Investment Plans (SIPs), which now contribute roughly 31,000 crore to the market every month. Foreign Institutional Investors (FIIs) have seen their influence moderate, with their share in NSE-listed companies slipping to approximately 16.6%—a 13-year low. While foreign funds remain net sellers in the secondary market due to global uncertainties and rich valuations, they continue to show interest in primary market issuances and IPOs. The Nifty 50 and Sensex have demonstrated remarkable resilience despite volatile global cues. As of mid-February 2026, the Nifty 50 is trading near the 25,950 level, while the Sensex hovers around 84,270. Market sentiment remains supported by robust corporate earnings, particularly in the auto, banking, and healthcare sectors. Retail participation has also reached new milestones. The number of demat accounts in India has surged past 21.6 crore, reflecting a deep "retailisation" of the economy. While individual holdings dipped slightly to 7.25% recently, the sheer volume of new participants provides a structural buffer against external selling pressure. Key economic events, including the presentation of the Union Budget on February 1, 2026, have provided further clarity on policy direction. The market's ability to absorb nearly 1.1 lakh crore in foreign outflows since 2025 underscores the shift from a foreign-driven to a domestically-supported financial ecosystem. Sectoral performance shows a clear rotation. Banking and financials continue to lead the rally with Bank Nifty holding steady above 60,800. Meanwhile, the IT sector faces pressure from global tech cues, and specialty chemicals are seeing margin compression due to new labor compliance costs. India’s weight in global indices like the MSCI Standard Index remains steady at 14.1%, even as more domestic companies are added to the list. This evolving landscape suggests a more mature market where domestic liquidity now dictates the primary momentum, reducing the historical dependence on overseas capital.

Apollo Hospitals MD Suneeta Reddy Discusses Expansion and Omnichannel Pharmacy Growth Strategy
Apollo Hospitals (APOLLOHOSP) has reported a stellar financial performance for the third quarter of the 2025-26 fiscal year. The company recorded a consolidated net profit of ₹502.3 crores, reflecting a significant 35% increase compared to the same period last year. This growth was fueled by a 17% surge in consolidated revenue, which reached ₹6,477.4 crores. Market reaction to these results has been overwhelmingly positive. Shares of Apollo Hospitals climbed nearly 6% today, February 11, hitting a high of ₹7,640. The company’s market capitalization now stands at approximately ₹1.09 lakh crores. Investors were also rewarded with the announcement of an interim dividend of ₹10 per share, with the record date set for February 16. The hospital segment remains a powerhouse, posting a 14% revenue increase. Operational efficiency is high, with the hospital business maintaining EBITDA margins near 25%. Management has successfully improved profitability by focusing on complex cases, particularly in oncology and cardiology. Expansion is a central pillar of the current strategy. Apollo is on track to invest ₹8,000 crores to add 4,300 beds over the next four years. In the immediate pipeline, 700 new beds are expected to become operational in the coming months. Recent launches include a 250-bed facility in Pune, with additional upcoming capacity in Kolkata, Hyderabad, and Bengaluru. The Apollo HealthCo segment, which includes the digital platform and India’s largest pharmacy network, is nearing a critical financial milestone. Losses from the digital health business have narrowed significantly, and the online pharmacy division is expected to achieve EBITDA break-even by the end of this fiscal year. A major strategic restructuring is also underway. The company plans to merge its omnichannel pharmacy business with Keimed, a wholesale distributor. This new entity is projected to generate ₹25,000 crores in revenue by FY27 and is expected to be listed independently within the next 15 to 18 months. The broader Indian healthcare sector continues to show robust demand, with the market projected to grow at a CAGR of 17-22%. With a structural shortage of quality beds across India, Apollo is positioning itself to capture this demand through a mix of brownfield and greenfield projects, particularly targeting North India and Tier-2 cities. Analysts remain bullish, with approximately 86% maintaining a "Buy" rating. The stock's recent technical breakout above ₹7,565 suggests further potential upside, supported by strong institutional volume and improved earnings per share.
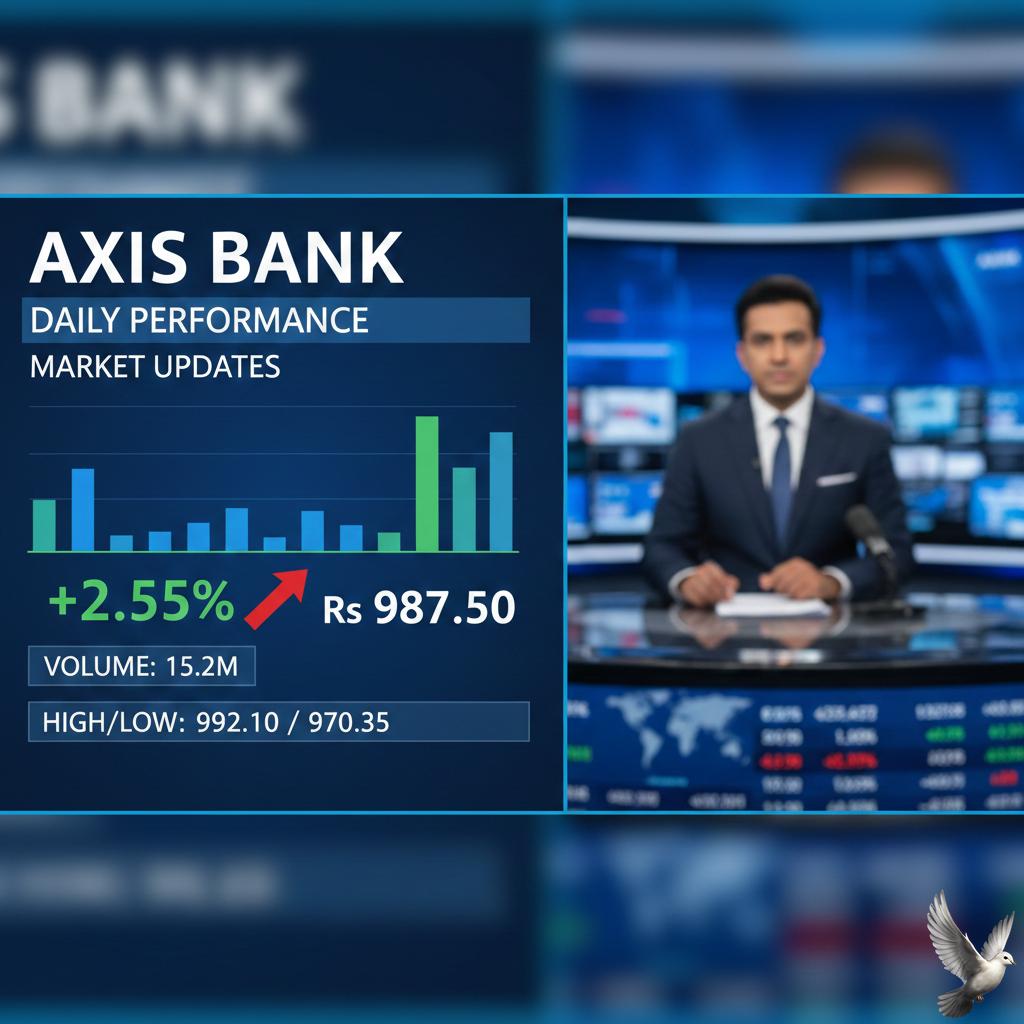
Axis Bank Daily Performance and Market Updates
Global Market Brief: February 11, 2026 Global equity markets are showing a constructive opening today, supported by steady institutional flows and a stabilization in risk sentiment. In the US, the Dow Jones Industrial Average remains firm near **50,182**, while Dow futures have added over **100 points** in early trading. Asian markets are largely reflecting this optimism. The Nikkei 225 surged over **4%** to reach **56,665**, recovering sharply from recent volatility. Conversely, the Hang Seng Index faces pressure, trading down **1.2%** at **26,559**, as tech sectors continue to digest shifts in global software demand. Domestic Indices and Institutional Activity The Indian market maintains a bullish bias as the Nifty 50 holds above the crucial **25,500** support zone. Current trading sees the index testing resistance near **26,000**. Bank Nifty continues to lead the domestic rally, sustaining levels above the psychological **60,000** mark with immediate targets set at **61,500**. Institutional activity has turned net positive. Foreign Institutional Investors (FIIs) recorded a modest buy of **69 crore**, while Domestic Institutional Investors (DIIs) provided significant support with an infusion of over **1,100 crore**. This combined net inflow of **1,200 crore** is providing a necessary cushion against global macro uncertainty. Commodities and Energy Energy prices are seeing a moderate recovery following a period of consolidation. Brent crude is trading near **$69.25** per barrel, marking a monthly increase of approximately **4.8%**. On the MCX, crude oil futures are hovering around **5,806**, as traders monitor tight supply signals and geopolitical developments in the Middle East. Precious metals are currently in a corrective phase after reaching historic highs. Gold has retreated to approximately **14,530 per gram** (22k), down from its peak, while silver is trading near **2,90,000 per kg**. Despite this retreat, safe-haven demand remains elevated due to a **12%** year-on-year decline in the US dollar index. Key Macroeconomic Indicators The economic outlook remains anchored by cooling inflation. Global headline inflation has dropped to **4.2%**, a significant decline from previous years. Domestic headline inflation is reported at a benign **1.33%**, well within the central bank's target range. * **Fiscal Deficit Target:** **4.4%** for FY26 * **India GDP Growth:** Projected at **7%** * **US Debt Refinancing:** **25%** of total debt due within 12 months * **Repo Rate:** Maintained at **6.5%** Sectoral performance is currently mixed. The IT sector faces a sharp **5.8%** decline due to global software revaluations, while the Auto and Metal sectors have gained **1.1%** and **1.2%** respectively, buoyed by strong export data and new trade agreements.