Bullish News
Collection
MRPL and Three Other Small-Cap Stocks Reach 52-Week Highs Following Monthly Gains of Up to 40%
Market Pulse: Small-Cap Breakouts Benchmark indices concluded the latest session with marginal changes, but the underlying sentiment remained constructive. The BSE Sensex settled slightly lower at **84,233.64**, down by **0.05%**, while the NSE Nifty 50 edged up by **0.07%** to finish at **25,953.85**. Despite the subdued movement in large-caps, the broader market showed significant strength. The BSE Small-Cap index outperformed the benchmarks, surging **5.4%**. This rally was driven by strong buying interest in specific stocks that reached fresh 52-week highs, signaling a robust "risk-on" appetite among mid-tier investors. Sector and Stock Highlights Mangalore Refinery and Petrochemicals (MRPL) emerged as a top performer, hitting a yearly high of **₹195.99**. The stock has delivered an impressive **39%** return in the last 30 days. Technical indicators remain bullish as the price stays above all major moving averages, supported by a significant **131%** jump in net profit growth. In the automotive and ancillary space, Force Motors reached a new peak of **₹24,999**. The company has witnessed a massive **215%** appreciation over the past year. Momentum has been fueled by strong demand in the commercial utility segment and a recent monthly gain of over **33%**. ZF Commercial Vehicle Control Systems also touched a fresh high of **₹15,950**. The stock surged nearly **5%** in a single session, outperforming the auto ancillary index. Investors are reacting positively to its debt-free balance sheet and record quarterly sales of **₹1,074 crore**. Craftsman Automation joined the rally, hitting a new high of **₹8,220**. The stock has recorded an **80%** return over the past year. Solid fundamental performance, including a quarterly revenue of **₹928 crore**, continues to attract institutional interest. Market Breadth and Indicators The divergence between the flat benchmarks and the surging small-caps highlights a rotation into value-oriented segments. While IT stocks like TCS and Infosys faced pressure due to global tech volatility, sectors such as Auto, Metal, and Pharma provided the necessary cushion to the Nifty. Institutional activity remains a key support pillar. Domestic Institutional Investors (DIIs) infused over **₹1,100 crore** into the cash market today, effectively neutralizing small-scale selling by foreign participants. The India VIX remains below **12**, indicating low immediate volatility and a steady, controlled uptrend for the domestic equity market.
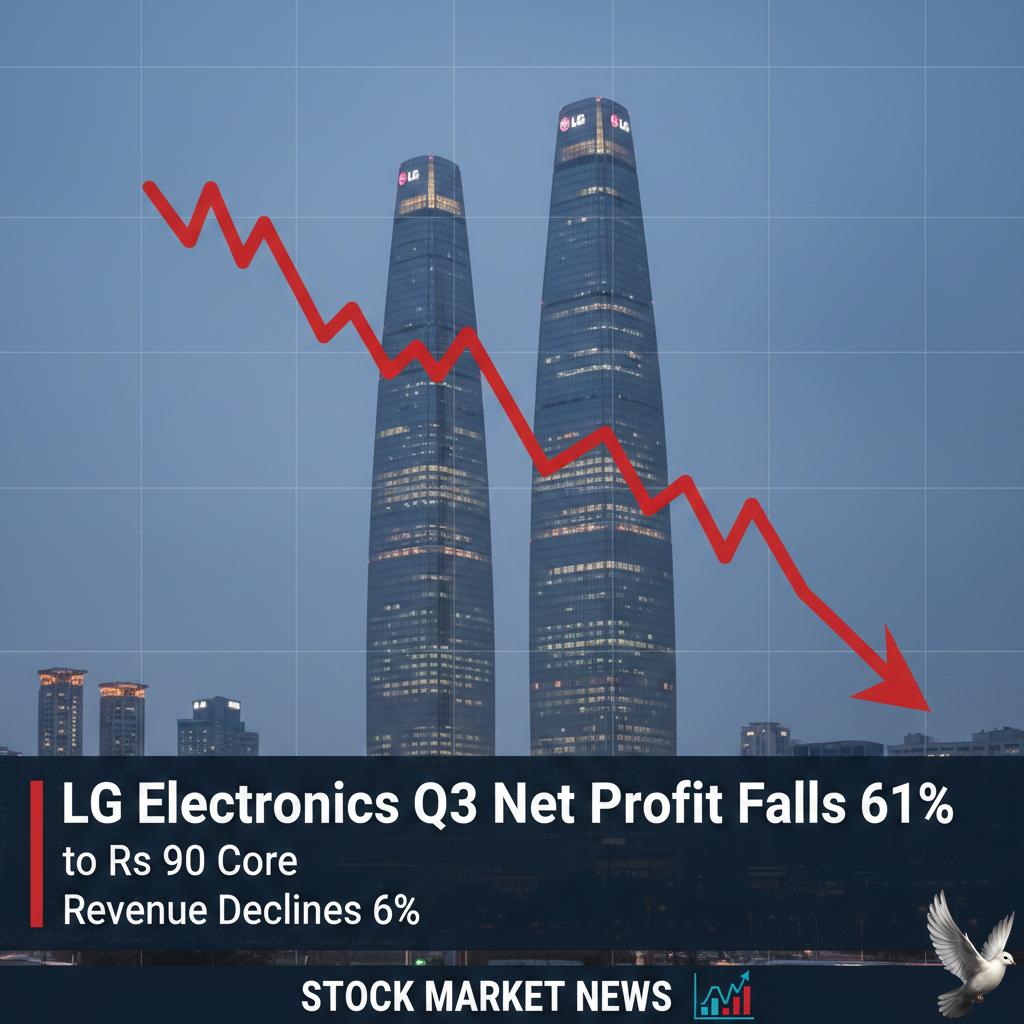
LG Electronics Q3 Net Profit Falls 61% to Rs 90 Crore as Revenue Declines 6%
LG Electronics has reported a sharp contraction in its India profitability for the latest third-quarter results. The consumer electronics giant witnessed a 61% year-on-year drop in consolidated net profit, which fell to 89.7 crore. Revenue from operations followed a similar downward trajectory, declining 6% to 4114 crore. This performance comes amid a cooling period for the Indian consumer durables market. While high-end segments like 75-inch televisions and 5-star energy-rated air conditioners remain popular in urban hubs, broader demand has slowed following the peak festive season. Rising logistics costs and global supply chain disruptions have heavily pressured margins. Operating expenses remain elevated due to higher commodity prices and increased marketing spend as brands compete for a smaller pool of active buyers. Market data as of February 2025 shows that while LG maintains a strong market share in premium categories, the industry faces headwinds from new energy compliance norms and rising e-waste recycling costs, which now impact revenue by roughly 1%. LG India is currently pivoting toward a "profitability-first" strategy. This includes a shift toward B2B segments, such as commercial HVAC systems and vehicle solutions, to offset the volatility of the retail consumer market. Looking ahead, the company is focusing on expanding its local manufacturing footprint and ramping up exports. The mid-to-long-term outlook remains tied to the recovery of mass-market demand and the stabilization of global freight rates, which have remained volatile through the start of 2025.
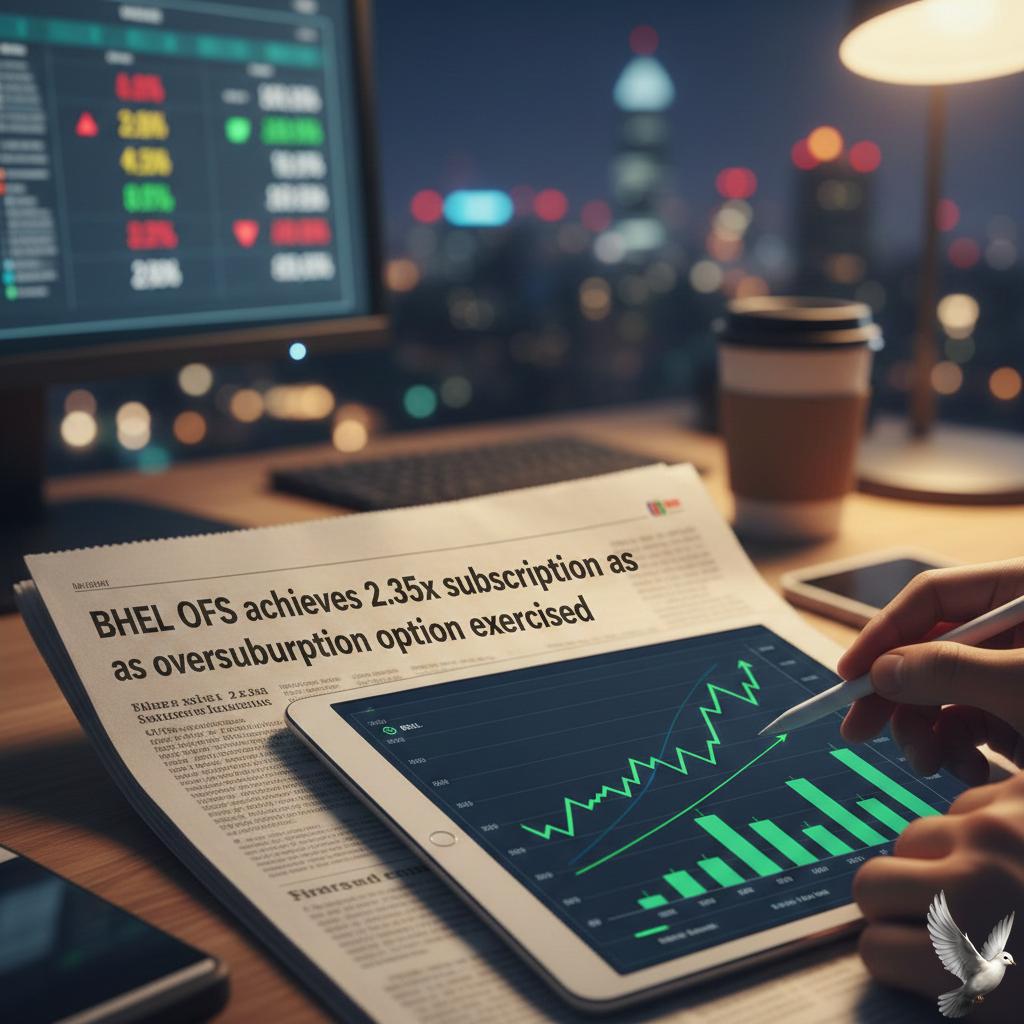
BHEL OFS achieves 2.35x subscription as oversubscription option exercised
BHEL Market Brief: OFS Oversubscription and Strategic Growth **Bharat Heavy Electricals Limited (BHEL)** confirmed its intent to exercise the oversubscription option for its current **Offer for Sale (OFS)**. The decision follows a robust response from non-retail investors, with the initial tranche seeing demand exceed the base offer size by **2.35 times**. The government is divesting up to a **5% stake** in the engineering major. This includes a **3% base offer** (roughly **10.44 crore shares**) and an additional **2% green-shoe option** (**6.96 crore shares**). The floor price for the transaction was set at **₹254**, representing a discount to recent market highs. Market Performance and Valuation As of **February 11, 2026**, BHEL shares traded near **₹260.65**, reflecting a daily decline of approximately **5.6%**. This volatility is largely attributed to the short-term supply pressure and the discounted pricing of the **OFS**. Despite the current dip, the stock has maintained a **36% gain** over the past year. The company’s market capitalization remains strong at approximately **₹96,122 crore**. Technical indicators show the stock is currently trading above its **200-day moving average**, though it has slipped below shorter-term moving averages amid the divestment news. Financial Resilience BHEL recently reported stellar **Q3 FY26** results, characterized by a **189.7% year-on-year surge** in consolidated net profit, reaching **₹390.40 crore**. Revenue from operations climbed **16.4%** to **₹8,473 crore**, driven by aggressive execution in the power and industrial segments. Operating efficiency has improved significantly, with **EBITDA margins** expanding from **4.2% to 6.44%**. The company remains virtually debt-free, a key factor supporting its long-term fundamental outlook despite the current share price fluctuation. Major Order Wins Operational momentum is bolstered by a massive **₹2,800 crore** contract secured from **Bharat Coal Gasification and Chemicals Limited (BCGCL)**. The project, located in Odisha, involves the development of a Syngas Purification Plant with a **42-month** execution timeline followed by **60 months** of operations and maintenance. This follows another major win from **Hindalco Industries** valued between **₹1,200 crore and ₹1,500 crore**. These contracts reinforce BHEL’s dominant position in India's thermal and industrial equipment sectors, providing high revenue visibility for the next four years. Sector Outlook BHEL continues to lead the power equipment market, currently accounting for over **50%** of India's conventional power generation capacity. The company is pivoting toward advanced technologies, including **Ultra Supercritical** thermal plants and green energy solutions, aligning with national energy security goals. While the **OFS** has introduced temporary price pressure, the record order book and improved profit margins suggest a stabilizing trend once the additional equity is absorbed by the market.
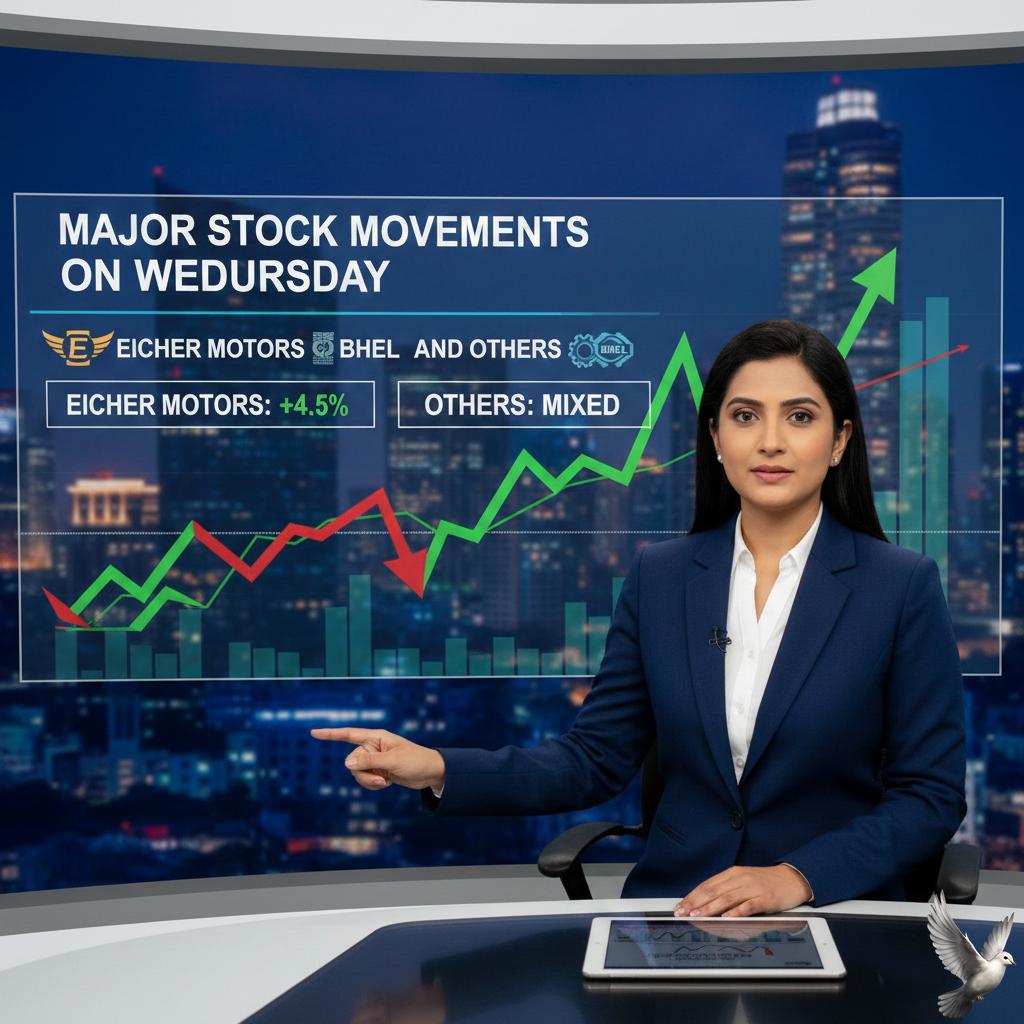
Major Stock Movements on Wednesday: Eicher Motors, BHEL, and Others
Indian equity benchmarks concluded a volatile session on February 11, 2026, with the **Nifty 50** ending nearly unchanged. The index edged up **18.70 points** or **0.07%** to settle at **25,953.85**, struggling to cross the psychological resistance of **26,000**. The **BSE Sensex** followed a similar rangebound trajectory, slipping slightly by **40.28 points** or **0.05%** to finish at **84,233.64**. Investors remained selective, balancing optimism from a recent US-India trade deal against mixed corporate earnings and global caution. **Sectoral Performance Highlights** The auto and healthcare sectors emerged as major drivers, while the IT space faced significant selling pressure. * **Auto Index:** Advanced **1.30%** behind strong buying in passenger vehicle leaders. * **Healthcare Index:** Rose **1.62%** as large-cap hospital chains reported robust quarterly numbers. * **IT Index:** Dropped **1.76%**, weighed down by global volatility and profit-taking in heavyweights like TCS and Infosys. **Top Stock Movers** **Eicher Motors** led the Nifty gains, surging **6.52%** to reach a fresh 52-week high after delivering earnings that beat market estimates. **Apollo Hospitals** followed with a **3.99%** jump, also supported by positive financial results. **State Bank of India (SBI)** performed strongly, rising **3.40%** as public sector banking sentiment improved. **SJVN** saw active interest following the declaration of an interim dividend of **₹1.15 per share** and a **51%** year-on-year increase in net profit. **The BHEL Disinvestment** **Bharat Heavy Electricals (BHEL)** shares experienced a sharp decline of **5.36%**, closing near **₹261.30**. This followed the government's launch of an Offer for Sale (OFS) to divest up to a **5% stake**. The floor price for the sale was set at **₹254 per share**, representing an **8% discount** to the previous closing price. The move is expected to fetch approximately **₹4,422 crore** for the exchequer if the greenshoe option is fully exercised. **Economic Indicators and Flows** Market stability was supported by continued domestic institutional support. **DIIs** remained net buyers with an infusion of over **₹1,100 crore**, while **FII** flows turned marginally positive at **₹69 crore**. Gold prices reached **₹158,613 per 10 grams**, marking a **1.1%** increase. In the currency market, the **Indian Rupee** traded at **₹90** against the US Dollar. Crude oil prices saw a slight uptick, with **Brent** rising to **$69.78 per barrel**. The India **VIX** cooled slightly by **1.01%** to settle at **11.55**, indicating that despite the resistance at higher levels, overall market panic remains low. Technical analysts suggest the immediate support for the Nifty remains firm at the **25,800** zone.

Vodafone Idea: Analyzing Buy, Sell, and Hold Outlook Amid Institutional Buying and Increased Promoter Stake
Market Brief: Vodafone Idea (Vi) **February 11, 2026** Vodafone Idea is navigating a pivotal stabilization phase as of early 2026. The company is characterized by a strategic tug-of-war between persistent debt challenges and strengthening promoter commitment. Recent market activity shows a significant uptick in institutional interest, with the stock outperforming sector peers in recent trading sessions. **Stock Performance & Market Sentiment** As of February 11, 2026, Vodafone Idea shares are trading at **₹11.85**, marking a **3.22%** daily gain. The stock has demonstrated significant momentum, rising **76%** over the last six months. Trading volumes have surged, reaching a staggering turnover of **₹7,565.8 crore** in a single day, signaling a potential shift in institutional sentiment despite the company's "sell-grade" status from several fundamental analysts. **Promoter & Institutional Backing** Kumar Mangalam Birla has personally signaled confidence by increasing his stake through open market purchases. Between late January and early February 2026, Birla acquired approximately **59.6 million shares** across multiple tranches, with a total outlay of roughly **₹66 crore**. This move has increased his direct holding to **0.07%**, a symbolic gesture that reinforces the promoter group’s commitment to a three-year turnaround strategy. Domestic mutual funds have also been observed accumulating shares, contributing to the stock's liquidity and price support. **Operational Metrics & Earnings** The Q3 FY26 financial results (October–December 2025) indicate narrowing losses. * **Net Loss:** Reduced to **₹5,286 crore**, a **20%** improvement year-on-year. * **Revenue:** Stood at **₹11,323 crore**, up **1.85%** compared to the same period last year. * **ARPU (Average Revenue Per User):** Rose to **₹186**, a significant climb from previous levels, driven by tariff hikes and customer upgrades to 4G and 5G services. **Subscriber Dynamics & Network** Subscriber erosion remains the primary operational hurdle. TRAI data for December 2025 reveals that Vi lost **9.4 lakh** wireless subscribers, while competitors Airtel and Jio gained millions. Vi currently holds a broadband subscriber base of **128.47 million**, maintaining its position as the third-largest player. The company is prioritizing its **₹45,000 crore** investment program to bridge the 4G coverage gap and expand its 5G footprint, which is viewed as essential to halting further user churn. **Debt & Regulatory Outlook** The company continues to carry a massive debt burden exceeding **₹1.82 lakh crore**. However, recent regulatory relief has improved the immediate outlook. The Union Cabinet's decision to freeze **₹87,700 crore** in Adjusted Gross Revenue (AGR) dues and allow staggered repayment until FY41 has materially reduced insolvency risks. This reprieve provides the necessary cash flow visibility for the company to focus on its network rollout and 5G deployment throughout 2026.

BSE Index Services Launches Two Government Securities Indices
BSE Index Services, a subsidiary of the Bombay Stock Exchange, has expanded its fixed-income suite with the launch of two new Government Securities (G-Sec) indices. These benchmarks are designed to facilitate passive investment vehicles, specifically Exchange-Traded Funds (ETFs) and Index Funds. The newly introduced BSE 4-8 Year G-Sec Index and BSE 8-13 Year G-Sec Index focus on the liquid segment of the sovereign bond market. Each index tracks the performance of the top three most liquid government securities within their respective maturity buckets. To ensure institutional viability, each constituent must have an outstanding issuance exceeding 7,500 crore. These indices arrive at a critical time for the Indian debt market. As of February 11, 2026, the benchmark 10-year G-Sec yield has eased slightly to 6.73%, reflecting a rangebound environment as traders anticipate upcoming inflation data. Despite recent supply pressures from large-scale state borrowing, the G-Sec market remains a primary focus for institutional and retail diversification. Passive investing in India is experiencing a significant surge. Total inflows into passive funds, including ETFs and index funds, jumped 50% in January 2026 alone, reaching 39,954 crore. The overall Assets Under Management (AUM) for the passive segment now stands at approximately 14 lakh crore, representing about 17% of the total mutual fund industry. The indices are reconstituted monthly and carry a base value of 100, with historical data tracked back to August 2015. They utilize a weighting system based on both turnover and outstanding amount to ensure they accurately reflect market liquidity. This structure provides a transparent benchmark for Portfolio Management Services (PMS) and mutual fund schemes seeking to offer structured exposure to government debt. For investors, these launches provide a low-cost, rules-based mechanism to gain exposure to sovereign credit. By targeting specific maturity windows—4 to 8 years and 8 to 13 years—the indices allow for more precise duration management. This is particularly relevant as the market navigates a plateau in interest rates, with the Reserve Bank of India maintaining the repo rate at 5.25% in its most recent February 2026 policy meeting. The expansion of the G-Sec index suite is expected to further deepen the debt market. As global and domestic institutional interest in Indian sovereign bonds grows, these benchmarks offer the necessary infrastructure for new passive products that cater to the evolving needs of long-term wealth builders and institutional treasuries.

10 Midcap Stocks with High Price-to-Earnings Ratios
Market Brief: February 11, 2026 The global financial landscape is characterized by a significant divergence between traditional industrial strength and a cooling technology sector. While major indices remain near record levels, investor sentiment is pivoting toward value-oriented sectors as the "AI fatigue" narrative weighs on high-growth software and service firms. Equity Market Performance The **Dow Jones Industrial Average** continues to demonstrate resilience, trading at approximately **50,259**, up **0.10%** for the day. This marks a sustained stay above the historic **50,000** psychological barrier. Conversely, the **S&P 500** saw a slight retreat to **6,952**, a decline of **0.33%**, while the **Nasdaq 100** fell **0.56%** to **25,185**. The technology sector is facing headwinds as heavyweights like **Alphabet** and **Nvidia** slipped **1.78%** and **0.75%** respectively. Market participants are increasingly scrutinizing the **$600 billion** in projected AI infrastructure spending for **2026**, questioning the immediate impact on free cash flow and traditional outsourcing demand. Commodities and Currencies Safe-haven assets are seeing renewed interest. **Gold** prices rose to **$5,110.30**, a gain of **1.58%**, as investors react to a weakening **U.S. Dollar Index**, which fell to **96.71**. This shift is largely driven by expectations of further **Federal Reserve** rate cuts later this year, following the current benchmark hold at **3.50%–3.75%**. **Silver** experienced a sharp rally of **5.38%**, reaching **$85.12**, while **Crude Oil (WTI)** climbed **2.05%** to **$65.27** per barrel. Energy prices remain sensitive to geopolitical developments and uncertainty surrounding U.S. trade policies. Emerging Trends and Indicators In Asian markets, the **Nifty 50** showed marginal gains of **0.07%**, closing at **25,953**, supported by a robust **3.23%** surge in **State Bank of India** to record highs. The automotive sector also outperformed, led by a **6.45%** jump in **Eicher Motors** following record quarterly results. * **U.S. Inflation:** Currently at **2.7%** (YoY). * **U.S. Unemployment:** Standing at **4.4%**. * **Bitcoin:** Trading at **$66,543**, down **2.1%** as capital rotates into precious metals. Digital asset sentiment has softened following the liquidation of nearly **$6.5 billion** in long positions earlier this month. Investors are now focused on upcoming **Producer Price Index (PPI)** data and **UK GDP** figures due for release later this week to gauge the next phase of global monetary easing.
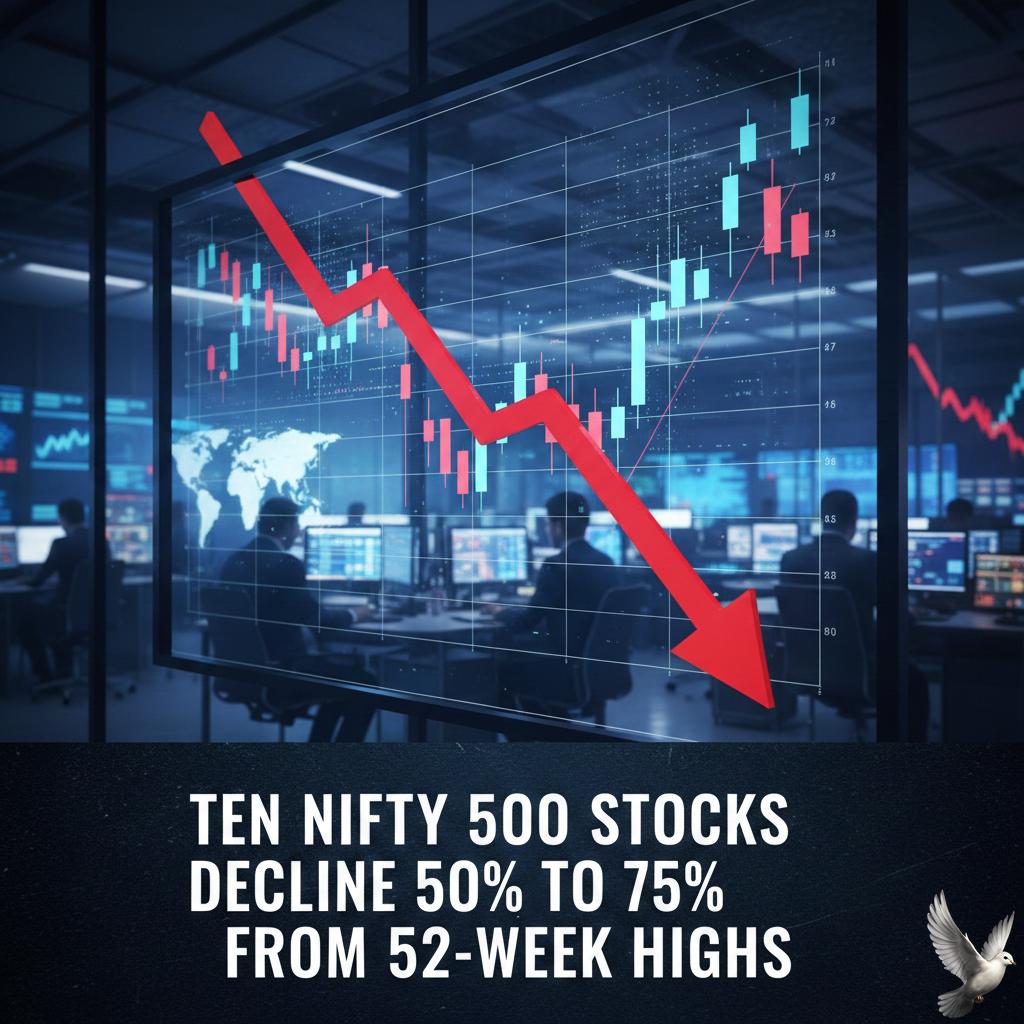
Ten Nifty 500 Stocks Decline 50% to 75% From 52-Week Highs
As of February 11, 2026, global markets are operating in a landscape defined by regional divergence and a shift toward defensive stability. While the era of concentrated growth led by a few mega-cap tech firms has faded, a more balanced market structure is emerging. Global Market Performance US equity futures remain constructive, with the Dow Jones leading gains as investors move toward value-oriented sectors. In Asia, the Japanese Nikkei-225 continues a strong rally following local political stability. The MSCI All-World Equity Index reflects a steady start to the year, showing a 2.5% return in early 2026. However, growth is no longer uniform. Developed Asia Pacific and select Latin American markets are currently outperforming US-centric exposures. Key Economic Indicators Central banks are adopting a more cautious "Goldilocks" stance. The Reserve Bank of India has maintained its repo rate at 5.25%, citing a rare period of high growth and low inflation. India’s GDP growth forecast for the 2025-26 fiscal year has been revised upward to 7.4%. In the United States, attention is fixed on January labor data. Expectations point to modest growth of roughly 69,000 new jobs, with the unemployment rate holding steady at 4.4%. Market participants are pricing in two to three interest rate cuts for the remainder of 2026. Commodities and Energy Gold prices have entered a phase of choppy consolidation after reaching record highs in late January. The 24K benchmark currently trades near 15,851 per gram, recovering slightly from a sharp post-peak correction. Energy markets remain volatile due to geopolitical friction. Brent crude is trading around 70.14, while US crude maintains a level of 65.27. Natural gas continues to face structural pressure, hovering near a critical support level of 3.07. Copper futures are showing resilience, holding above 5.90 per pound. Despite a seasonal slowdown in Chinese demand, supply challenges from major mines are providing a price floor. Technology and Innovation The tech sector has transitioned into a "Year of Truth" for generative systems. The focus has shifted from experimental pilots to mature enterprise integration. AI-optimized hardware remains a primary growth driver. Global semiconductor revenues are projected to reach 975 billion in 2026, a 25% increase from the previous year. Enterprise spending is moving toward "Cloud 3.0" architectures, which prioritize data sovereignty and low-latency inference for autonomous agents. However, consumer hardware like PCs may face price hikes of up to 9% due to persistent memory chip shortages.
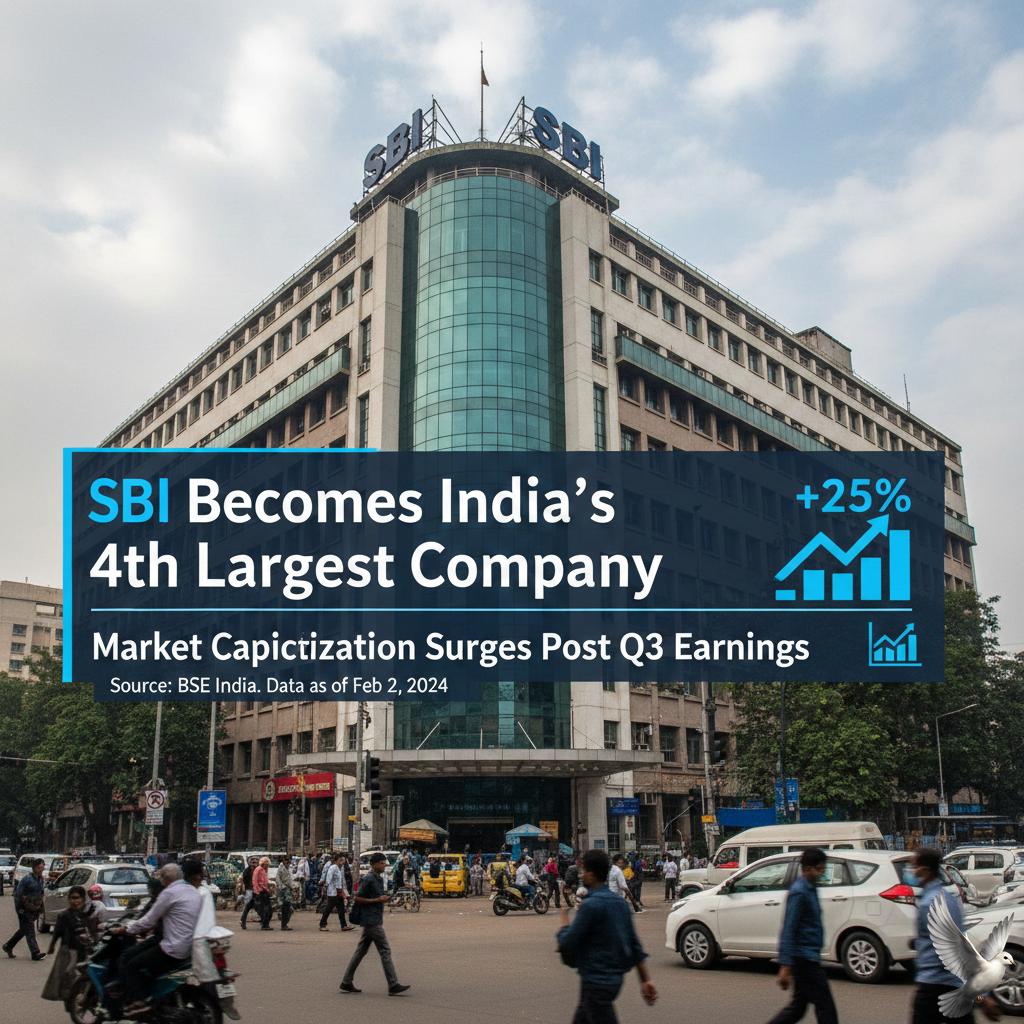
SBI Becomes India's Fourth-Largest Company by Market Capitalization Following Q3 Growth
State Bank of India (SBI) has achieved a historic milestone, overtaking Tata Consultancy Services (TCS) to become India’s fourth-largest listed company by market capitalization. This shift highlights a major trend in investor sentiment as the market prioritizes robust financial earnings over a cooling technology sector. As of February 11, 2026, SBI’s market valuation surged to approximately 10.94 lakh crore, surpassing TCS, which stood at roughly 10.53 lakh crore. This rally was fueled by a sharp 11% gain in SBI's share price this week alone, reaching an all-time high of 1,183. In contrast, TCS shares have faced pressure, declining about 9% over the past month. The primary catalyst for this ascent is SBI’s record-breaking Q3 FY26 performance. The lender reported its highest-ever quarterly standalone net profit of 21,028 crore, reflecting a 24.5% year-on-year growth. This surpassed market expectations and was driven by strong core income and improved recovery trends. Net interest income (NII) for the quarter rose by 9% to 45,190 crore, supported by a healthy 15% expansion in loans. Despite a slight industry-wide pressure on margins, SBI maintained a steady domestic net interest margin (NIM) of 3.12%. Asset quality also saw notable improvement, with the gross non-performing asset (GNPA) ratio falling to 1.57%. Market analysts remain bullish as SBI management raised its credit growth guidance to a range of 13%–15% for the fiscal year. This optimism is further bolstered by new regulatory avenues, such as direct lending to Real Estate Investment Trusts (REITs) and increased opportunities in merger and acquisition financing. While the banking giant continues its upward trajectory, the broader sector is navigating short-term hurdles. A nationwide bank strike scheduled for February 12, 2026, may lead to limited disruptions in branch services. Additionally, new service charges for IMPS transactions above 25,000 are set to take effect from February 15. SBI now joins an elite club of Indian firms valued above the 10 lakh crore mark. It currently ranks behind only Reliance Industries, HDFC Bank, and Bharti Airtel. The bank's year-to-date return of 21% significantly outperforms the benchmark Nifty 50, which has seen a marginal decline of 1% in the same period.
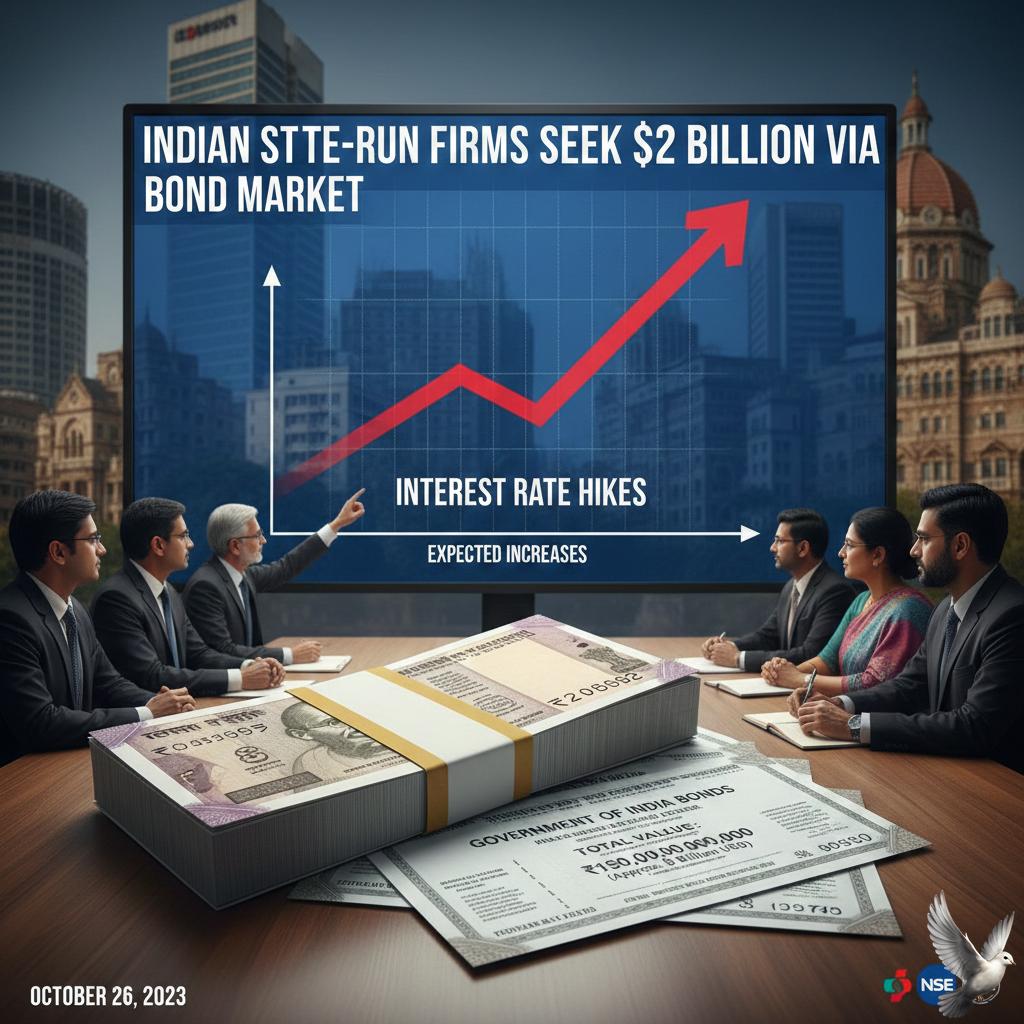
Indian State-Run Firms Seek $2 Billion via Bond Market Amid Expected Interest Rate Hikes
The Indian corporate bond market is entering a phase of tactical pragmatism. Market leaders are no longer waiting for a significant drop in borrowing costs, choosing instead to lock in financing at current levels. This shift comes as the realization takes hold that yields are unlikely to soften materially in the immediate future. The benchmark 10-year Government Securities (G-Sec) yield is currently hovering around 6.73%, remaining resilient despite recent policy shifts. This benchmark serves as the floor for corporate debt pricing. While the Reserve Bank of India (RBI) initiated a 25-basis-point cut to the repo rate in late 2024—bringing it to 5.25%—the central bank maintained a status quo in its February 2026 meeting. This "higher for longer" stance on liquidity has effectively capped any aggressive rally in bond prices. Issuance activity remains robust despite these elevated rates. State-run giants and private conglomerates are actively tapping the primary market, with weekly issuances frequently exceeding 125 billion rupees. This volume is notably higher than the historical weekly average of 50 to 100 billion rupees. Companies have accepted the current yield environment as the "new normal," prioritizing capital access over the gamble of waiting for cheaper debt. The appetite for longer-duration paper is also growing. A recent 50-year government bond auction was oversubscribed by four times, signaling deep institutional interest from insurance companies and pension funds. In the corporate sector, triple-A rated 3-year bonds are currently pricing near 7.85%, while state government securities have seen cut-off yields jump to 7.63%—the highest levels seen in nearly two years. Corporate balance sheets are better positioned to absorb these costs than in previous cycles. The net debt-to-EBITDA ratio for top-tier Indian firms has improved significantly, falling to approximately 1.2x. This deleveraging provides a safety buffer, allowing firms to fund expansion through a mix of debt and internal accruals without straining interest coverage ratios, which currently stand at a healthy 5.8%. Looking ahead, the market expects a shallow rate-cut cycle. With inflation projected to settle within the 2% to 6% target band, the focus has shifted toward liquidity management. Investors are increasingly favoring short-to-medium duration products, where the risk-reward profile remains most attractive. The underlying message is clear: the era of waiting for "perfect" rates has ended, replaced by a steady stream of strategic issuances.
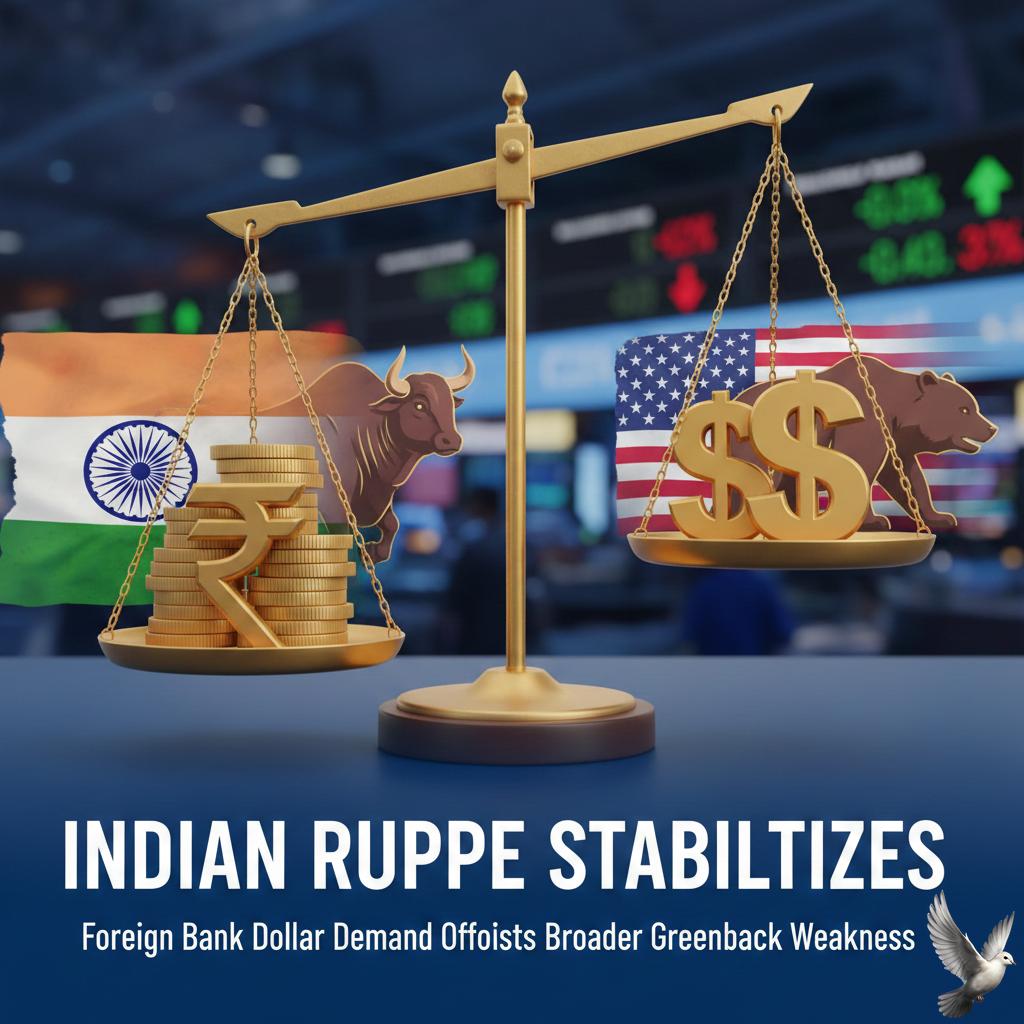
Indian Rupee Stabilizes as Foreign Bank Dollar Demand Offsets Broader Greenback Weakness
The Indian rupee faced renewed pressure during Wednesday’s session, depreciating by **14 paise** to close at **90.70** against the U.S. dollar. This downward movement followed a brief period of strength, as increased dollar bids from foreign banks and sustained demand from importers outweighed broader global trends. While several Asian peer currencies gained ground against a softening greenback, the rupee’s performance remained subdued. The local unit opened at **90.56** and fluctuated within an intraday range of **90.46** to **90.75**. The decline comes despite recent optimism surrounding the newly unveiled India-U.S. interim trade framework, which initially sparked a rally in the currency. Market participants are currently balancing positive domestic factors against external headwinds. Foreign Institutional Investors (FIIs) remained net buyers in the equity market, with recent purchases totaling approximately **₹69.45 crore**. These inflows, alongside India’s record-high foreign exchange reserves of **$723.77 billion**, provide a critical buffer for the Reserve Bank of India to manage volatility. However, rising energy costs continue to impact the currency’s outlook. Brent crude futures edged up to **$69.34** per barrel, expanding India’s import bill and putting structural pressure on the exchange rate. Analysts note that while the **90.00–90.20** zone remains a strong support level for the rupee, persistent demand for the dollar could push the pair toward the **91.00** mark in the coming sessions. On the domestic front, equity benchmarks showed resilience. The Nifty50 stayed near the **26,000** threshold, closing at **25,987**, while the Sensex ended at **84,415**. Investors are now shifting their focus to upcoming domestic inflation data and global labor market reports to gauge the next move for interest rates. Expectations for the rupee throughout 2026 remain mixed. While some institutional forecasts suggest a potential slide toward the **93.00–94.00** range due to external pressures, others point to India’s projected GDP growth of **6.4%** to **7.0%** as a stabilizing force that could anchor the currency during periods of global uncertainty.

US Equity Futures Steady Prior to January Jobs Report
Market Brief: U.S. Equities and Economic Outlook **February 11, 2026** U.S. stock futures moved higher on Wednesday morning as the market prepared for a critical influx of delayed economic data. Investor sentiment remains cautious but constructive following a session where the **Dow Jones Industrial Average** secured its third consecutive all-time high, closing at **50,188.14**. The **S&P 500** recently dipped **0.33%** to **6,941.81**, while the **Nasdaq Composite** fell **0.59%** to **23,102.48**. Despite these minor retreats, futures for all three major indices are trending in positive territory today, with the **Dow** up approximately **0.2%** in pre-market activity. Labor Market and Inflation Focus The central focus for the trading week is the rescheduled January Jobs Report. Following government disruptions that delayed several key releases, analysts expect non-farm payrolls to show a modest addition of **70,000** jobs. This would represent a slight acceleration from the **50,000** jobs added in December. The unemployment rate is projected to hold steady at **4.4%**. Wage growth is also under the microscope, with a forecasted cooling to **3.6%** year-over-year. Market participants are looking for evidence of a "soft landing," where the labor market stabilizes enough to justify a shift in Federal Reserve policy later this year. Corporate Performance and Sector Trends Cloudflare (NET) remains a focal point in the software sector after reporting fourth-quarter results. The company posted an **EPS** of **$0.28**, beating the **$0.27** estimate. Management issued strong revenue guidance for the upcoming year, fueled by high demand for cybersecurity and AI-integrated services. The technology sector continues to face valuation scrutiny, however. Soft retail data for December, which showed flat growth against an expected **0.4%** increase, has redirected some capital toward defensive sectors like utilities and real estate. Financials have also seen volatility, particularly after new automated tools sparked competitive fears for traditional wealth managers. Monetary Policy and Yield Stability Federal Reserve officials have maintained a "cautiously optimistic" tone. The target policy rate remains at **3.50%–3.75%** after a pause in January. While inflation expectations for the next year have declined to **3.1%**, the Fed is waiting for the Consumer Price Index (CPI) report on Friday to confirm that price pressures are truly subsiding. The **10-year Treasury note** has shown remarkable stability, with yields moving within a narrow range of **0.39 percentage points** over the last six months. This reduced volatility in the bond market has provided a supportive backdrop for equities, even as the dollar weakens against a basket of global currencies.
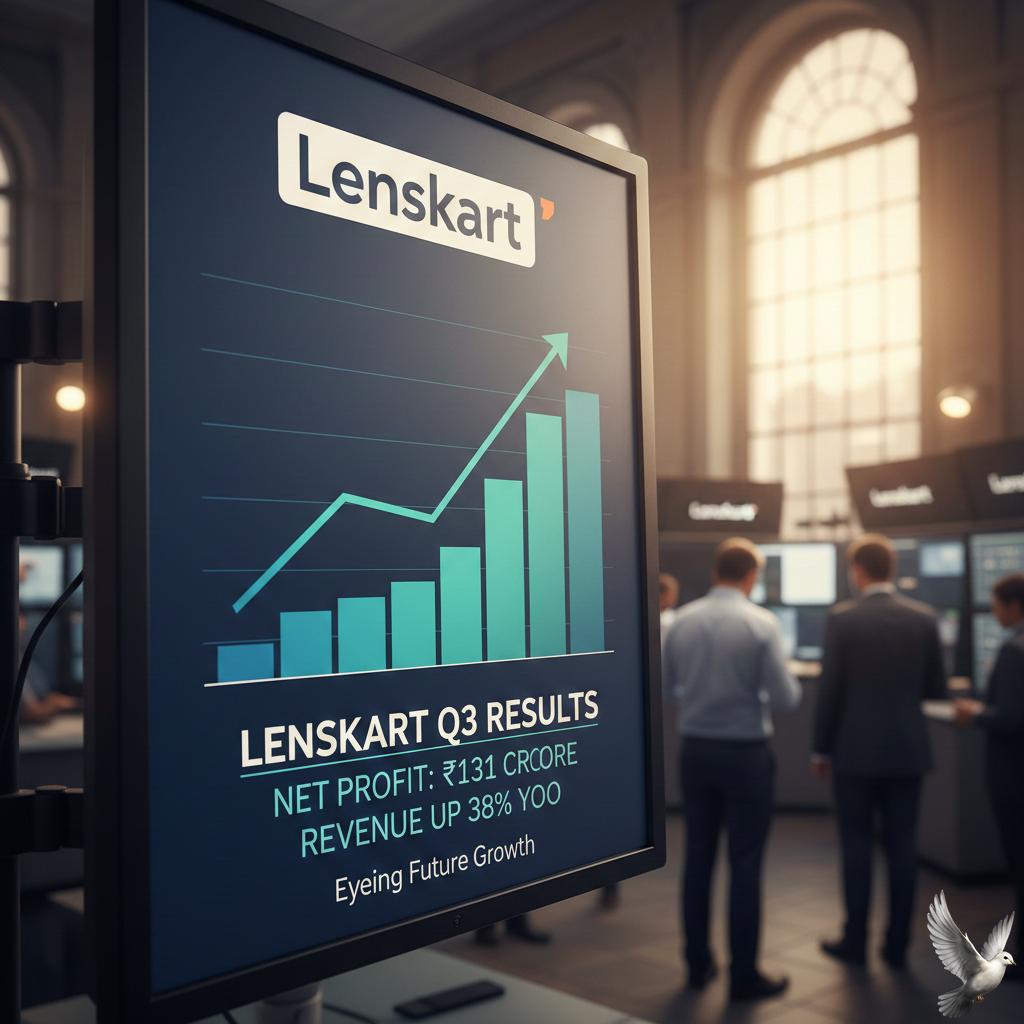
Lenskart Q3 Results: Net Profit Reaches Rs 131 Crore as Revenue Grows 38% YoY
Lenskart Solutions has delivered a historic financial performance, signaling its transition from a high-growth startup to a profitable market leader. The company reported a massive **6,982%** surge in net profit, reaching **Rs 131 crore** for the quarter ending December. This turnaround follows years of heavy investment and is underpinned by a **38%** rise in operating revenue, which touched **Rs 2,308 crore**. For the full fiscal year 2025, the firm solidified this momentum with a consolidated net profit of **Rs 297 crore**, a stark contrast to the **Rs 10 crore** loss recorded just one year prior. Revenue for the annual period grew by approximately **23%** to reach **Rs 6,653 crore**. This growth was fueled by aggressive retail expansion and a dominant position in the organized eyewear sector. The company's footprint now exceeds **2,800** stores globally. While the domestic market remains the primary engine with over **2,100** stores in India, international operations have scaled rapidly. Overseas markets—including Japan, Singapore, and Thailand—now contribute roughly **40%** of total revenue. In the 2025 fiscal year alone, the brand sold over **27 million** eyewear units across its global network. Operational efficiency has improved alongside scale. EBITDA margins rose to **14.6%** in FY25, up from **12.4%** the previous year. Lenskart’s vertically integrated model, which includes a massive manufacturing plant in Bhiwadi capable of producing **20 million** frames annually, allows for significant cost control. The company currently estimates its production costs to be **35% to 40%** lower than the industry average. The market has responded to this shift with a high-profile public listing in late 2025. Following a **Rs 7,278 crore** IPO, the company’s market capitalization stands at approximately **Rs 82,138 crore**. Investor interest remains high as the brand moves into new tech segments, recently launching its first smart eyewear series priced at **Rs 4,000**. Looking ahead, the organized eyewear market in India is projected to grow at a **19%** compound annual rate through 2030. With only **24%** of the domestic market currently organized, there is substantial room for further penetration. The company plans to utilize **Rs 2,150 crore** from its fresh issue to add **620** new stores and further upgrade its technology and cloud infrastructure.
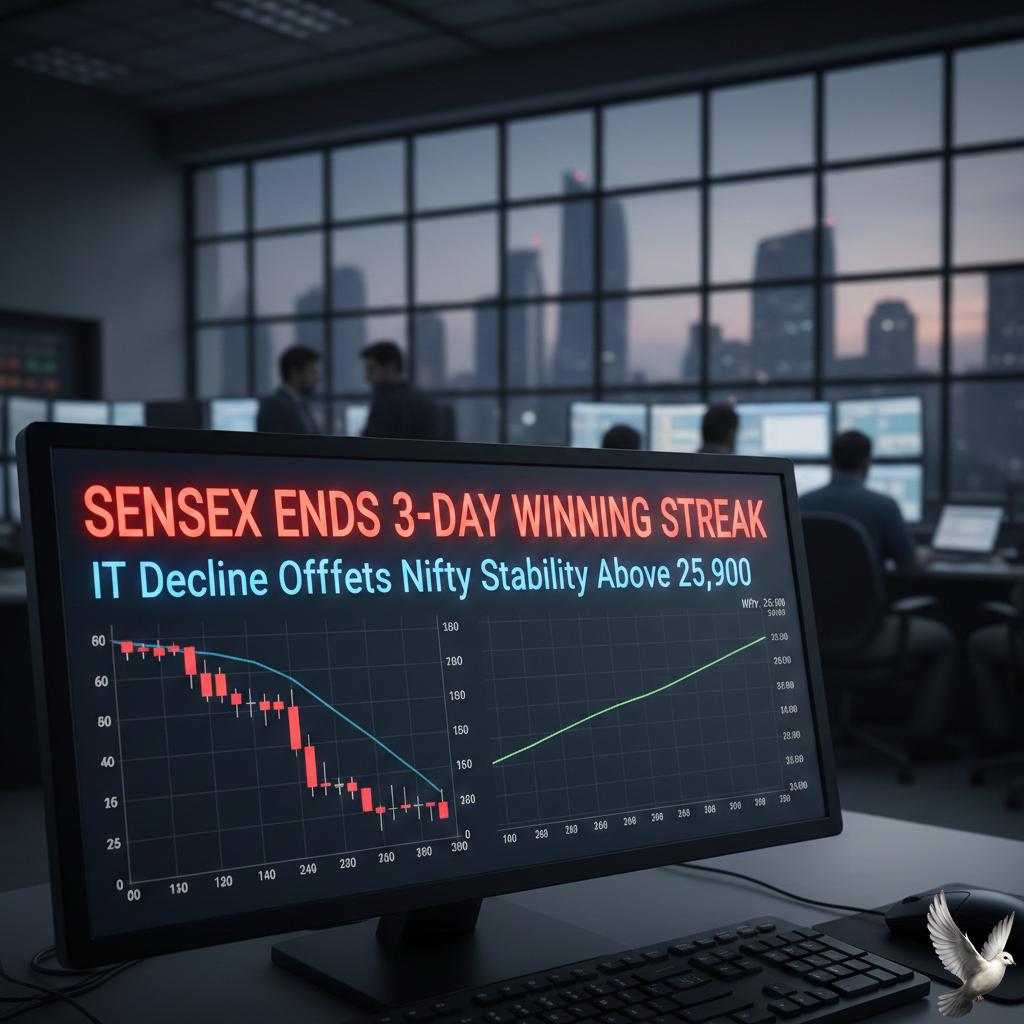
Sensex Ends 3-Day Winning Streak as IT Decline Offsets Nifty Stability Above 25,900
Market Pulse: India Benchmarks End Flat Amid Choppy Trade The Indian equity benchmarks concluded Wednesday, **February 11, 2026**, on a neutral note. The **Sensex** and **Nifty 50** both exhibited sideways movement, reflecting a cautious atmosphere as investors weighed mixed global cues against domestic corporate earnings. The **BSE Sensex** edged lower by **40.28 points**, or **0.05%**, to settle at **84,233.64**. This minor decline snapped a three-day winning streak for the 30-share index. In contrast, the **NSE Nifty 50** managed to hold onto marginal gains, rising **18.70 points**, or **0.07%**, to close at **25,953.85**. Market participants noted that the **Nifty** repeatedly tested the psychological resistance of **26,000** during the session but failed to sustain levels above it. Sectoral Highlights and Movers The **PSU Bank** index emerged as a top performer, jumping **1.28%** to reach **9,272.75**. **State Bank of India (SBI)** led this charge with a **3.23%** rally, which propelled the lender to the **4th spot** in India's overall market capitalization rankings, overtaking TCS. The **Auto sector** also saw strong momentum, with the **Nifty Auto** index climbing over **2%**. **Eicher Motors** was a standout gainer, surging **6.5%** following robust quarterly results that saw a **21%** increase in net profit to **Rs 1,421 crore**. Other gainers included **Britannia Industries**, which rose nearly **3%** on a **17%** jump in year-on-year profit. On the downside, the **IT sector** faced significant pressure. **TCS** slipped **2%**, while other heavyweights like **HCL Tech** and **Infosys** also traded in the red. These losses in the technology space acted as a primary drag on the **Sensex**. Economic Indicators and Institutional Activity The **Indian Rupee** weakened slightly, trading at **90.66** against the **US Dollar**, compared to the previous close of **90.56**. In the fixed income market, the yield on the **10-year benchmark federal paper** eased to **6.715%**. Institutional flow remained supportive despite the flat index performance. **Domestic Institutional Investors (DIIs)** were significant net buyers, infusing **Rs 1,174 crore** into the market. **Foreign Institutional Investors (FIIs)** also maintained a positive bias, contributing a net purchase of **Rs 69.45 crore**. Global Context and Commodities Global markets provided a mixed backdrop. While the **Dow Jones** hit record highs earlier in the week, investors remained alert to upcoming US labor data. In the commodities space, **Brent crude** for April settlement rose to **$69.77 per barrel**. Domestic **Gold** futures for April delivery were seen at **Rs 1,58,109**, marking a gain of **0.83%**. Meanwhile, the **MSCI February 2026** index review announced the addition of **Aditya Birla Capital** and **L&T Finance** to the Global Standard Index, while **IRCTC** was excluded.
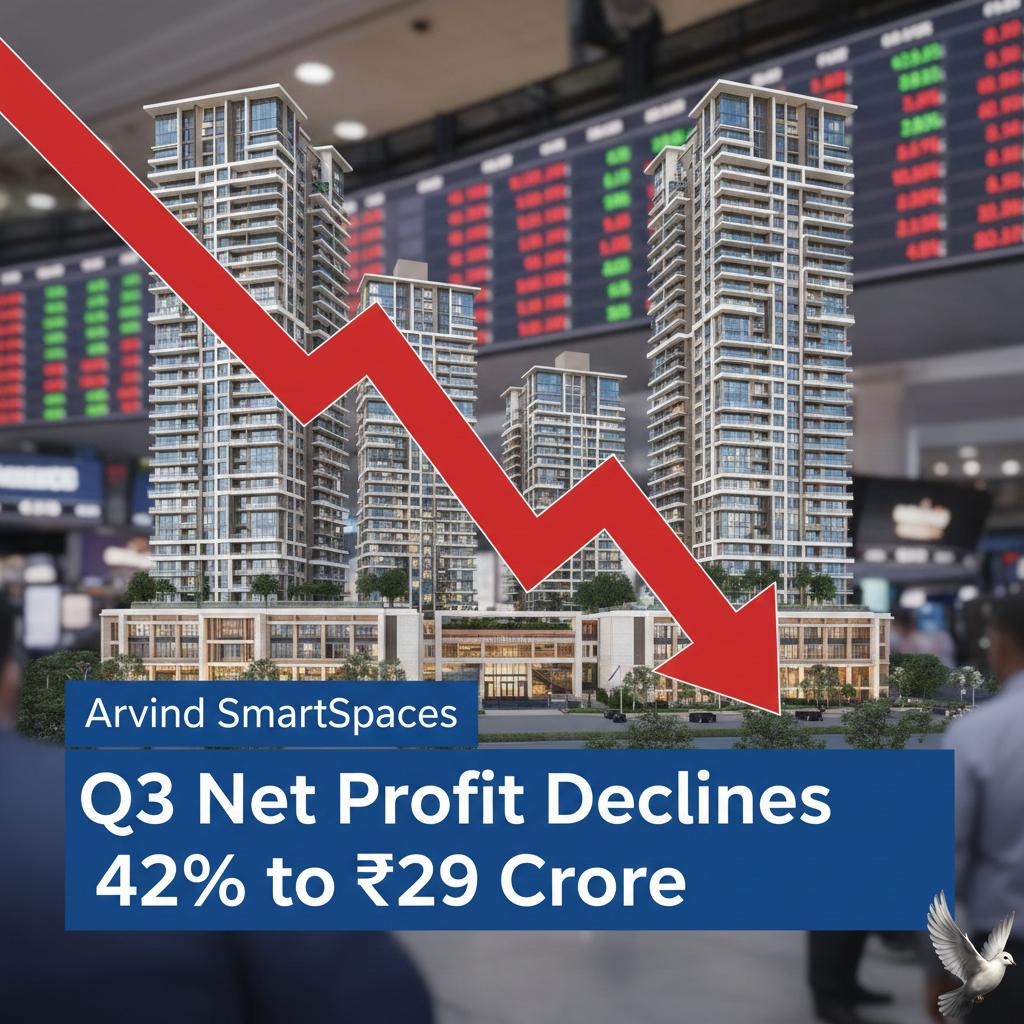
Arvind SmartSpaces Q3 Net Profit Declines 42% to ₹29 Crore
Market Brief: Arvind SmartSpaces Q3 FY26 Performance Arvind SmartSpaces Limited reported its financial results for the quarter ended December 31, 2025, revealing a divergence between operational growth and reported accounting figures. The company's net consolidated profit after tax stood at **29.21 crore**, marking a **41.79%** decline compared to the **50.18 crore** recorded in the same period last year. Total consolidated income for the quarter reached **170.50 crore**, a decrease of **20.87%** from the previous year's **215.47 crore**. This dip is largely attributed to the timing-based nature of revenue recognition in the real estate sector, which often creates a lag between sales activity and financial reporting. Despite the drop in reported profit, operational momentum remained strong. New sales bookings surged by **48%** year-on-year to reach **331 crore**. Customer collections also saw a healthy increase of **38%**, totaling **317 crore** for the quarter. These metrics indicate sustained market demand for the company’s residential portfolio. Liquidity remains a key strength for the developer. Operating cash flow for the quarter jumped by **128%** to reach **169 crore**. The company’s net debt remains disciplined at **79 crore**, maintaining a low net debt-to-equity ratio of **0.13**. The company is aggressively expanding its project pipeline, adding new high-rise developments in Bengaluru and Ahmedabad with a combined topline potential of approximately **1,810 crore**. For the 2026 fiscal year, the management has targeted a total business development potential of **2,510 crore**. A significant leadership transition has been formalized. Priyansh Kapoor, formerly the CEO for the Mumbai region at Godrej Properties, has officially taken over as the Managing Director and CEO. Kamal Singal, who led the company for over 15 years, has moved into a strategic role as Whole-time Director for Strategy and Investments, where he will mentor the executive team. In the equity markets, the stock was trading around **583.50** on February 11, 2026. While the share price has faced short-term volatility, falling approximately **30%** over the last six months, it maintains a long-term growth profile with a five-year return exceeding **600%**. The broader Indian real estate market in early 2026 is shifting toward a more mature growth phase. Demand is increasingly driven by end-users seeking premium developments and lifestyle upgrades. With stable interest rates and a robust unrecognized revenue backlog of **3,289 crore**, the company is positioned to convert its current booking momentum into future financial gains.

IndiQube Spaces Reports Rs 17 Crore Q3 Loss Amid Rising Expenses
IndiQube Spaces Ltd. has reported its financial results for the third quarter of FY26, showcasing a period of aggressive scaling and significant revenue growth. The Bengaluru-based flexible workspace provider recorded a total income of **Rs 411.09 crore** for the quarter ended December 2025. This represents a robust **45.5%** increase compared to the **Rs 280.48 crore** reported in the same period last year. Despite the surge in top-line performance, the company reported a consolidated net loss of **Rs 17.06 crore** for the quarter. This is a slight increase from the **Rs 13.72 crore** loss posted in the previous year. Management attributed this to higher expenses, primarily driven by rapid expansion costs, a **34%** rise in employee benefits, and significant lease accounting adjustments under Ind AS norms. Operationally, the firm has substantially widened its footprint. IndiQube now manages over **9.55 million sq ft** of space, having added nearly **1.5 million sq ft** in the last year alone. Its presence has expanded to **17 cities** following recent entries into Bhubaneswar, Indore, and Kolkata. The company currently operates **129 centers** with a total capacity of **212,000 seats** and maintains a healthy portfolio occupancy of **84%**. A key highlight of the latest report is the company’s improved balance sheet health. The debt-to-equity ratio saw a dramatic reduction, falling to **0.15** from **0.80** year-on-year. Additionally, the Return on Capital Employed (ROCE) improved to **23%**, up from **15%** in the prior year. The firm continues to benefit from an annuity-led revenue model, with recurring revenues contributing **94%** of its total mix. The broader Indian flexible workspace market is currently experiencing a "hyper-growth" phase. Projections suggest the total flex stock will reach **100 million sq ft** by the end of 2026. This demand is largely fueled by Global Capability Centres (GCCs) and the sustained adoption of hybrid work models by large enterprises and technology firms. Investor sentiment remains cautiously optimistic as the company works toward bottom-line profitability. On February 11, 2026, the stock was trading around **Rs 177**, giving the firm a market capitalization of approximately **Rs 3,751 crore**. While high interest costs and depreciation remain challenges, the narrowing of sequential losses—down from **Rs 30 crore** in Q2—signals an improving trajectory as the company nears the close of the fiscal year.

Ashok Leyland Q3 Results: Net Profit Increases 4% to Rs 796 Crore as Revenue Grows 22%
Ashok Leyland has demonstrated significant financial resilience in its latest third-quarter performance for the 2025-26 fiscal year. The Hinduja Group flagship reported a standalone net profit of 796.02 crore, representing a 4.5% year-on-year increase. This growth was achieved despite absorbing a substantial one-time labor-related charge of 308 crore, highlighting the underlying strength of its operational core. Revenue from operations witnessed a powerful surge, climbing 21.68% to reach 11,533.85 crore. This top-line expansion was driven by robust volume growth across all primary segments, including Medium and Heavy Commercial Vehicles (MHCV) and Light Commercial Vehicles (LCV). The company’s ability to outpace general industry trends suggests a significant expansion in market share, particularly as the sector enters a fresh replacement cycle. Operating efficiency reached new heights with the company reporting its highest-ever Q3 EBITDA of 1,535 crore, a 27% increase over the previous year. EBITDA margins expanded to 13.3%, up from 12.8% in the same period last year. This result marks the 12th consecutive quarter where Ashok Leyland has maintained double-digit margins, underscoring a consistent focus on profitable growth and cost leadership. The balance sheet has strengthened considerably, ending the quarter with a net cash position of 2,619 crore. This is a massive leap from the 958 crore reported in the previous year's third quarter. This liquidity provides a strong foundation for the company’s ongoing transition toward battery-electric and alternate-fuel products, which remain a central pillar of its long-term strategy. The equity markets responded with enthusiasm, pushing the share price to an all-time high of 215.42 during intraday trading on February 11, 2026. This reflects a staggering one-year return of approximately 110%, vastly outperforming the broader benchmark indices. Institutional interest remains high, with mutual funds consistently increasing their holdings over the past four quarters to reach 8.24%. Broader market conditions remain favorable as the Indian commercial vehicle industry benefits from improved freight demand and post-GST momentum. Total vehicle retail sales in India surged 17.61% in January 2026, with the commercial segment specifically rising by 15.07%. Ashok Leyland is well-positioned to capitalize on this trend, especially with its recent expansion into electric vehicle manufacturing in Lucknow and a steady pipeline of new defense orders worth over 700 crore. Export performance also provided a strong tailwind, with volumes increasing by 33% during the quarter. The company continues to see significant contributions from the Gulf Cooperation Council (GCC) countries and is aggressively targeting SAARC and ASEAN markets. With a goal to reach a 35% MHCV market share, the company is leveraging its Saathi platform and localized battery technology development to secure its leadership in the next generation of mobility.

Textile Stocks Extend Decline Amid Ongoing Bangladesh Supply Chain Concerns
Market Alert: Indian Textile Sector Under Pressure Indian textile equities faced significant selling pressure for a second consecutive session on **February 11, 2026**. The downturn follows the finalization of a reciprocal trade agreement between the **United States and Bangladesh**, which has introduced new competitive variables into the South Asian garment export landscape. The market reaction was sharp, with several major players recording notable losses: * **Pearl Global Industries** fell **10.14%** * **Kitex Garments** dropped **6.80%** * **Welspun Living** declined **5.79%** * **Arvind Ltd** slipped **4.88%** * **KPR Mill** retreated **2.87%** The US-Bangladesh Trade Framework Under the new deal signed on **February 9, 2026**, the U.S. has lowered the general reciprocal tariff for Bangladeshi goods to **19%**. While this headline rate is slightly higher than the **18%** tariff recently secured by India under its own interim trade framework, a specific "zero-tariff" clause for Bangladesh has unsettled investors. The agreement establishes a mechanism allowing a specific volume of Bangladeshi apparel to enter the U.S. at **0% duty**, provided the products are manufactured using U.S.-sourced cotton or man-made fibers. This "bulk swap" arrangement potentially gives Bangladesh a pricing edge in high-volume categories like T-shirts and trousers. Strategic Impact on Indian Exporters The U.S. remains India's primary textile destination, accounting for approximately **$10.5 billion** in annual exports. Industry analysts suggest the immediate threat to Indian finished garments may be tempered by several factors: * **Raw Material Costs:** Bangladesh must factor in higher freight and logistics costs to import U.S. cotton. * **Indian Exemptions:** Indian exporters also benefit from lower effective duties if they incorporate at least **20%** U.S. cotton into their products. * **Infrastructure:** India maintains a more diversified "fibre-to-fashion" base compared to Bangladesh's narrower focus on garment assembly. Shifting Trade Flows A critical secondary impact involves India's cotton and yarn exports. Bangladesh has historically been a major buyer of Indian raw materials, importing **$1.6 billion** in cotton yarn in **2024**. The new deal incentivizes Bangladesh to pivot toward U.S. suppliers, potentially disrupting traditional trade routes between the two neighbors. While the Indian textile market is projected to grow at a **CAGR of 5.3%** through **2033**, the reintroduction of an **11%** import duty on raw cotton in India on **January 1, 2026**, has added a layer of domestic cost pressure. Exporters are now navigating a tighter margin environment as regional competition intensifies.
MSCI Index Review: Seven Small-Cap Stocks Added to Latest Rebalancing
The MSCI February 2026 index review has triggered a significant reshuffle in the Indian equity landscape. Seven prominent stocks have been added to the MSCI Global Small Cap Index, a move expected to drive substantial passive capital inflows by the end of the month. The key additions include Premier Energies, NSDL, Emcure Pharmaceuticals, JSW Cement, Ashapura Minechem, Canara HSBC Life Insurance, and Thyrocare Technologies. These inclusions come as global funds prepare to adjust their portfolios effective February 27, 2026. Premier Energies is currently trading near 823.80, reflecting a 9.8% gain over the last week. Analysts project this inclusion will attract approximately $15 million in passive inflows. The company recently reported a robust quarterly net profit of 391.71 crore. National Securities Depository (NSDL) has also captured market attention with its share price hovering around 998.85. The market leader in the depository space is anticipated to see inflows of roughly $8 million. Despite a recent technical snag delaying some settlements, the stock maintains a market capitalization of over 19,000 crore. Emcure Pharmaceuticals is witnessing a 48% boost in its Q3 FY26 profits, with shares trading near 1,515.70. The stock has gained 21% over the past year and is expected to benefit from $7 million in index-related buying. In the broader Global Standard Index, MSCI added Aditya Birla Capital and L&T Finance while removing IRCTC. Aditya Birla Capital is set for the largest impact, with estimated inflows of $257 million, while L&T Finance follows with $238 million. Conversely, IRCTC is projected to see outflows of $142 million following its exclusion. The Indian market remains resilient amid these changes. The Nifty 50 is holding firm at 25,935.15 and the Sensex is positioned at 84,273.92. India’s overall weightage in the MSCI Standard Index remains steady at 14.1%, even as the number of represented Indian companies rises to 165. Institutional activity continues to support this momentum. Foreign Institutional Investors (FIIs) have been net buyers for three consecutive sessions, while Domestic Institutional Investors (DIIs) purchased equities worth over 1,174 crore in recent trading. Market participants are focused on the February 27 deadline, when index-tracking funds will execute the final adjustments during the closing minutes of trade. This rebalancing typically leads to heightened volume and localized volatility in the affected securities.
Selective Stock Performance Diverges from Broader Muted Earnings Trends: Rohit Srivastava
The Indian equity market is currently navigating a period of narrow leadership, where the performance of a select few heavyweights is masking broader underlying caution. As of February 11, 2026, the Nifty 50 is hovering near the **26,000** mark, while the Sensex trades around **84,200**. Despite the headline indices showing resilience, the market environment is increasingly stock-specific. Investors are focusing on companies with high earnings visibility rather than participating in a broad-based rally. Banking and Auto Outperformers State Bank of India (SBI) continues to be a standout performer, reaching a new 52-week high of **₹1,174.80**. The bank's momentum is supported by a record quarterly profit of **₹21,028 crore** and a significant improvement in asset quality, with Gross NPAs falling to **1.57%**. Mahindra & Mahindra (M&M) is also demonstrating selective strength, with shares trading near **₹3,680**. The company recently reported a **33%** jump in quarterly net profit, driven by robust demand in the SUV and farm equipment segments. Index Performance and Levels While the Nifty 50 has gained approximately **12.6%** over the past year, recent sessions show it facing stiff resistance at the **26,050** level. Support remains firm between **25,750** and **25,800**. * **Nifty 50:** ~25,950 * **Bank Nifty:** ~60,700 * **Sensex:** ~84,200 Divergent Sectoral Trends The market is witnessing a sharp divergence between sectors. The Auto and Banking packs are the primary drivers of the current upside. Conversely, the IT sector has faced significant pressure, with the Nifty IT index seeing notable declines due to global tech volatility and AI-related shifts. Foreign Institutional Investors (FIIs) have shown signs of stabilizing their activity, turning marginal buyers in recent sessions with net purchases around **₹69 crore**, while Domestic Institutional Investors (DIIs) provided a stronger cushion with net buying exceeding **₹1,100 crore**. Macroeconomic Backdrop Market sentiment is being shaped by the recent Union Budget, which proposed a fiscal deficit target of **4.4%** for FY26. While changes in derivative taxation initially dampened spirits, a record capital expenditure plan is providing long-term support for infrastructure and manufacturing stocks. India remains the fastest-growing large economy with a projected GDP growth of **7.3%** for the current fiscal year. However, with the market trading at a price-to-earnings ratio of approximately **23x**, the focus remains strictly on bottom-up stock selection and fundamental clarity.