Bullish News
Collection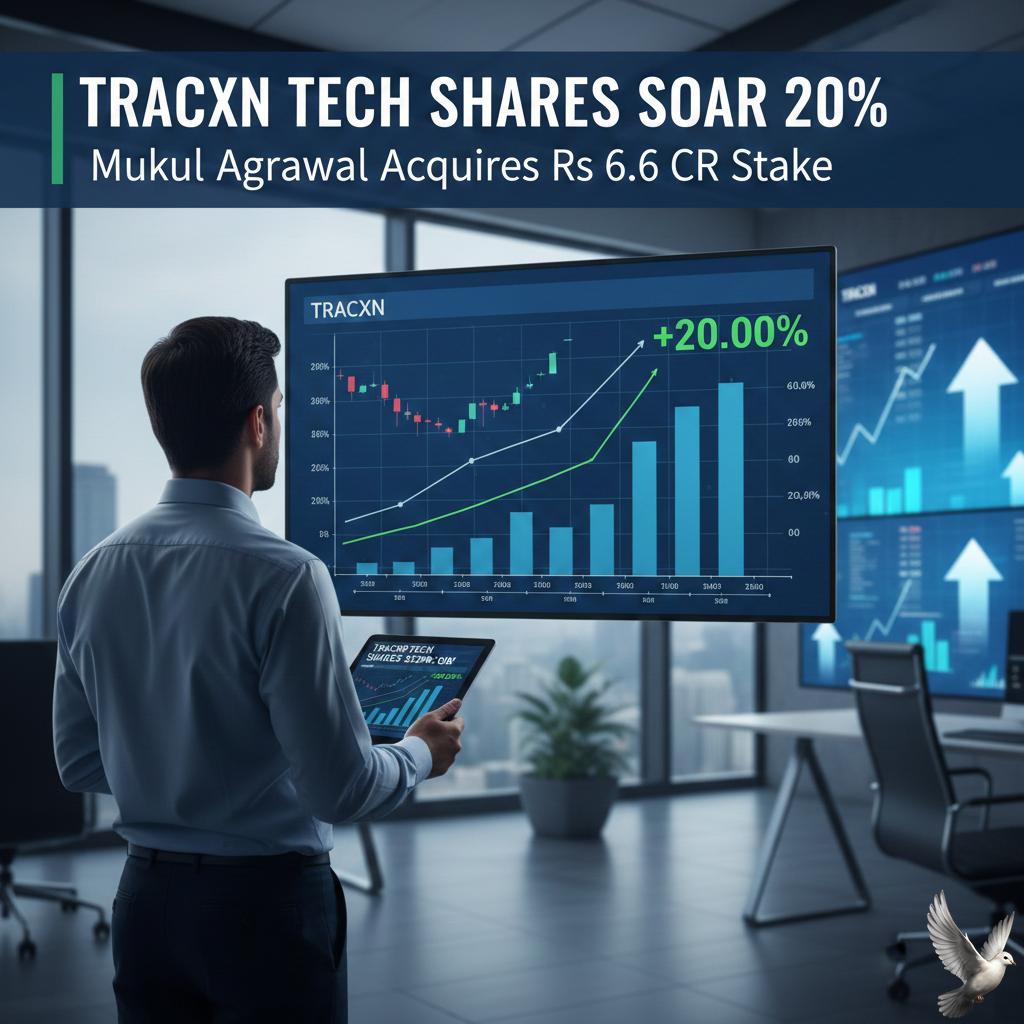
Tracxn Tech Shares Surge 20% Following Mukul Agrawal's Rs 6.6 Crore Stake Acquisition
Tracxn Technologies shares experienced a significant surge this week, hitting the upper circuit after ace investor Mukul Agrawal acquired a 1.88% stake in the company. The transaction involved 20 lakh shares purchased via bulk deals at an estimated price of 33 per share, totaling approximately 6.6 crore. Despite this sharp rally, the stock remains a market laggard. Over the past year, the share price has eroded by more than 50% and is down roughly 14% since the start of 2026. The company’s market capitalization currently hovers around 366 crore, reflecting the continued pressure on small-cap tech valuations. Financial performance for the quarter ending December 2025 showed signs of strain. Tracxn reported a net loss of 0.81 crore, a sharp decline compared to the profit of 2.22 crore in the same period last year. Revenue remained relatively flat at 21.04 crore, down 1.27% year-on-year, as the company grapples with higher employee costs and a dip in the average selling price per account. The company operates a data intelligence platform tracking over 4 million private entities for a global client base of 1,500 organizations. While the domestic India business shows momentum with 43% growth in customer accounts, international markets—which contribute 70% of revenue—face headwinds due to decade-low deal volumes in the global venture capital segment. Management is currently prioritizing expansion over immediate profitability. The sales team is expected to grow from 34 to 60 representatives by the end of 2026. Additionally, the company is leveraging AI-driven data production to reduce operational headcounts by 30% while significantly increasing data coverage. Investor sentiment is cautiously optimistic following the entry of high-profile backers, but the path to recovery remains tied to a revival in global private market activity. The stock currently trades at a Price-to-Book ratio of approximately 6.1, and the company maintains a debt-free balance sheet with sufficient cash reserves to cover contingent liabilities.

2026 Gold and Silver Market Outlook and Investment Comparison
Precious Metals Market Update: February 2026 The precious metals sector is witnessing a significant leadership shift as February 2026 unfolds. Gold has emerged as the primary choice for stability, consistently outperforming silver in a reversal that has caught many market participants off guard. As of February 10, 2026, **Gold** is trading near a formidable **$5,000 per ounce** on international markets. In domestic trading, prices are hovering around **₹1,58,060 per 10 grams**, representing a recovery of nearly **5%** over the past week. This resurgence follows a sharp market correction in late January, with gold proving its resilience as a premier safe-haven asset. Silver Volatility and Correction **Silver** continues to face intense price swings, characterized by its dual identity as both an industrial input and a speculative vehicle. After hitting a historic peak of **$121 per ounce** in late January, silver experienced a dramatic "flash crash," losing more than **35%** in a single day—its largest percentage drop in history. Currently, silver is attempting a recovery, trading at approximately **₹3,00,000 per kg** (domestic) and near **$80 per ounce** (global). While today's rebound saw a **5.3%** jump, the metal remains roughly **14%** lower for the month. Analysts note that silver’s recent movements were fueled more by speculative fear-of-missing-out (FOMO) than by industrial fundamentals. Key Market Drivers The primary catalyst for recent market shifts is the nomination of a more hawkish Federal Reserve leadership, which has strengthened the **US Dollar**. A stronger dollar traditionally dampens the appeal of precious metals, yet gold has managed to retain buyer interest more effectively than its white-metal counterpart. * **Central Bank Activity:** Institutional buying remains high, with gold now representing roughly **15%** of total central bank reserves. * **Margin Requirements:** The CME Group recently raised margin requirements for silver from **11% to 15%**, forcing leveraged traders to liquidate positions and accelerating silver’s downward volatility. * **Industrial Outlook:** Despite the paper market crash, silver remains in a structural deficit due to its essential role in AI hardware, electric vehicles, and solar panels. Investment Outlook Gold is currently favored by experts for investors seeking "steady returns" and a hedge against fiscal concerns. Its price behavior remains significantly more predictable than silver, which has transitioned from a steady industrial metal into a high-risk "leveraged proxy" for speculative appetite. Market indicators suggest gold could target the **$5,600 to $6,000** range by year-end 2026 if geopolitical tensions and tariff uncertainties persist. Silver’s path remains more fractured; while industrial demand is robust, the metal must clear overhead resistance between **₹3.20 lakh and ₹3.50 lakh per kg** to regain its former momentum.

M&M Q3 Results Preview: Projected Profit and Revenue Growth Driven by Sales Volumes
**MAHINDRA & MAHINDRA: Q3 FY26 PERFORMANCE BRIEF** Mahindra & Mahindra (M&M) enters the final stretch of the fiscal year with strong bullish momentum. The company is set to announce its Q3 FY26 financial results on **February 11, 2026**, with market expectations pointing toward significant double-digit growth across all primary financial metrics. **MARKET PERFORMANCE & VALUATION** As of February 10, 2026, M&M shares are trading near **3,644 INR**, reflecting a steady upward trajectory. The stock has demonstrated resilience with a **1-week return of approximately 4.4%**. The company’s market capitalization currently stands at a robust **4.37 trillion INR**, supported by a Price-to-Earnings (P/E) ratio of **28.76**. **REVENUE AND PROFIT FORECASTS** Analysts anticipate a breakout quarter driven by volume-led growth and healthy realizations. Revenue is projected to climb by **29% year-on-year**, potentially reaching the **388.6 billion INR** mark. Profit After Tax (PAT) is the standout metric, with forecasts suggesting a massive **34% surge** compared to the same period last year. This earnings boost is attributed to high operating leverage and a richer product mix favoring premium SUVs. **AUTOMOTIVE SECTOR MOMENTUM** The SUV portfolio remains the primary engine of growth. Recent data from January 2026 confirms this white-hot demand, with SUV sales hitting **63,510 units**, a **25% increase** year-on-year. A critical highlight is the record-breaking reception of new models like the XUV7XO and XEV 9S. In a stunning display of brand power, M&M clocked **93,689 bookings** worth **20,500 crore INR** in just four hours on January 14. Total vehicle sales for the recent month reached **104,309 units**, up **24%**. **FARM EQUIPMENT AND TRACTORS** The farm division has staged a remarkable recovery. Domestic tractor sales surged **46%** in January, reaching **38,484 units**. This growth is underpinned by favorable monsoon conditions, high reservoir levels, and robust rural liquidity. Exports in this segment also showed exceptional strength, growing by **72%** as the company expands its global tractor dominance. **OPERATIONAL OUTLOOK** Operating margins are expected to remain healthy as raw material costs stabilize. M&M is also aggressively expanding its infrastructure, recently announcing a **15,000 crore INR** capital expenditure plan over the next decade to scale its vehicle and tractor production units in Maharashtra. Management is focused on maintaining this momentum through a "multi-technology" approach, balancing its dominant Internal Combustion Engine (ICE) lineup with a rapidly expanding Electric Vehicle (EV) portfolio. Global brokerage firms have maintained a positive outlook, citing M&M as a top pick within the Indian automotive space.
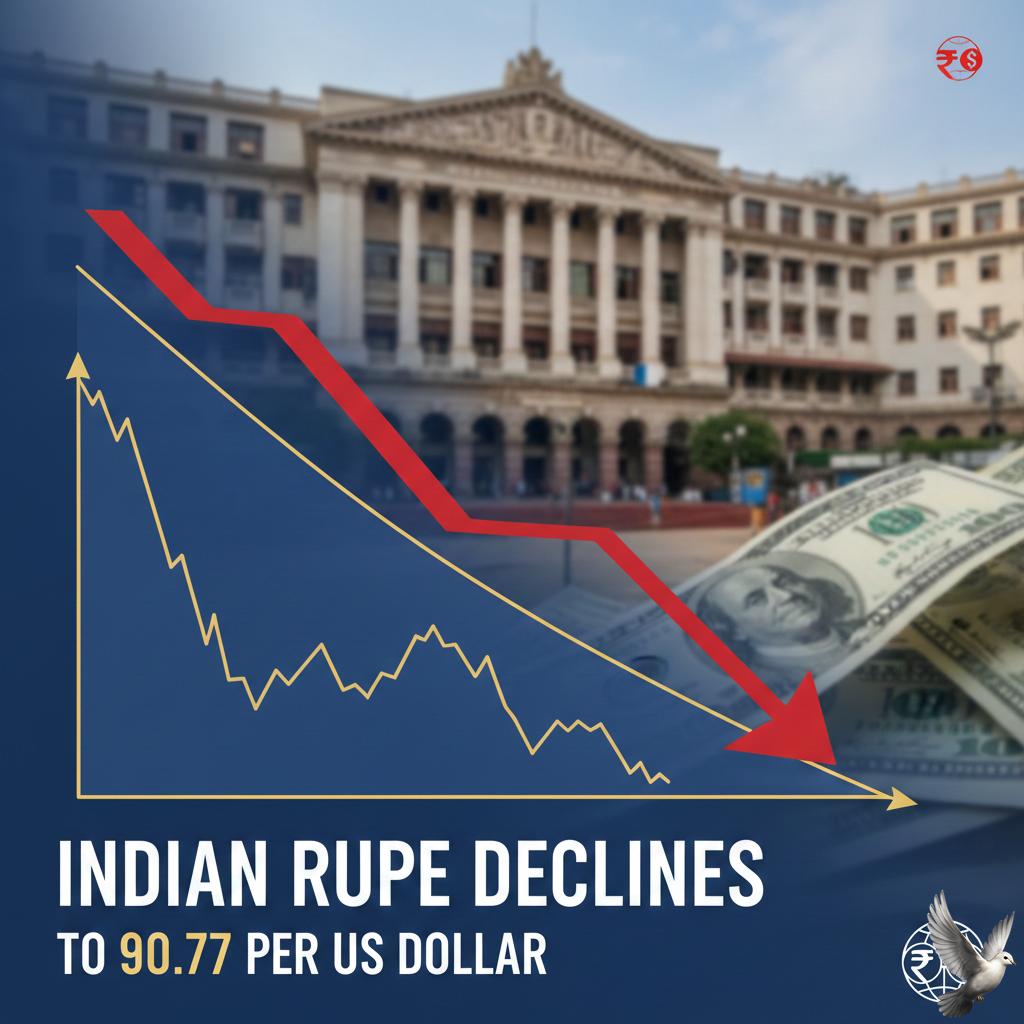
Indian Rupee Declines to 90.77 Per US Dollar
The Indian Rupee faced renewed volatility in early trading on February 10, 2026, as market participants parsed the specifics of the recently announced India-US interim trade framework. After a period of sharp fluctuations, the currency was observed hovering around the **90.70** level against the US Dollar. Initial market euphoria following the February 7 announcement saw the rupee temporarily rally. However, this momentum has since cooled as the focus shifts to the fine print of the agreement. While the US has committed to lowering reciprocal tariffs on Indian goods to **18%**—down from previous highs of **50%**—India has signaled a massive intent to procure **$500 billion** in US energy, aircraft, and technology products over the next five years. This procurement commitment, while strengthening bilateral ties, raises questions regarding the long-term trade balance. Investors remain cautious about US regulatory practices and the definitive nature of India's import obligations compared to the more framework-oriented assurances from Washington. The Reserve Bank of India (RBI) remains a pivotal player in stabilizing the local unit. Recent data shows India’s forex reserves reached a record high of **$723.77 billion** as of late January, providing the central bank with significant firepower. Traders report that the RBI has been active on both sides of the market, selling dollars to stem excessive depreciation while occasionally buying near the **90.05** mark to prevent rapid appreciation that could hurt export competitiveness. Domestic equity markets offered some cushion to the currency. The Sensex recently reclaimed the **84,000** mark, trading near **84,238** in early sessions today, while the Nifty 50 held above **25,900**. This positive trend in stocks, supported by nearly **Rs 2,255 crore** in daily inflows from Foreign Portfolio Investors, has helped offset some of the downward pressure on the rupee. Technical analysts suggest that the **89.80 to 90.00** zone now acts as a firm support base for the rupee. If the currency continues to falter past recent lows, market expectations point toward a move toward the **90.80 to 91.20** range. Global factors, including a steady Dollar Index at **97.58** and Brent crude prices easing to approximately **$67.41** per barrel, continue to influence the broader trajectory. Looking ahead, the currency is expected to remain sensitive to the finalization of trade terms. While the deal provides a strategic floor, the structural preference of the RBI to accumulate reserves and the high corporate demand for dollars suggest a gradual depreciation path toward the **92.00** level by the end of 2026.

Tracxn Technologies shares rise 20% following stake acquisition by Mukul Agrawal
Market Brief: Tracxn Technologies **Tracxn Technologies (TRACXN)** witnessed a sharp resurgence in early February 2026. The stock surged **20%** to hit its upper circuit limit, reaching an intraday high of **Rs 40.56**. This momentum was primarily driven by a high-profile bulk deal. Ace investor **Mukul Agrawal** spearheaded the movement by acquiring **20 lakh shares** (approximately **1.88%** equity) in the company. The transaction was valued at **Rs 6.6 crore**, with the acquisition executed at an average price of **Rs 33 per share**. Financial Performance & Valuation The market reaction follows a period of financial cooling. For the quarter ended **December 31, 2025 (Q3 FY26)**, the company reported: * **Revenue from operations:** **Rs 21.04 crore**, reflecting a marginal **2%** decline year-on-year. * **Net Loss:** **Rs 0.81 crore**, compared to a profit of **Rs 1.42 crore** in the same period last year. * **Total Expenses:** Scaled to **Rs 22.80 crore**, driven by operational costs and ESOP expenses. Despite the recent circuit-limit rally, the stock continues to face long-term headwinds. Over the past **12 months**, the share price has eroded by more than **56%**. The current market capitalization stands at approximately **Rs 433 crore**. Technical Data & Market Context The stock has established a **52-week range** between a low of **Rs 31.04** and a high of **Rs 73.89**. While the entry of a marquee investor has provided a floor for the valuation, the company's Price-to-Earnings (P/E) ratio remains in negative territory at **-26**, reflecting ongoing profitability challenges. Tracxn continues to operate as a global SaaS-based intelligence platform, tracking over **2.5 million** entities. Its strategic focus for **2026** involves deepening its data reach into regulatory filings and private market M&A transactions, aiming to capitalize on the shift toward autonomous data systems in the venture capital and private equity sectors. The current shareholding pattern remains dominated by retail and individual investors, who hold over **61%** of the company, while promoters retain a **34.44%** stake. Institutional participation remains selective, with Foreign Portfolio Investors (FPIs) holding less than **1%** of the equity.
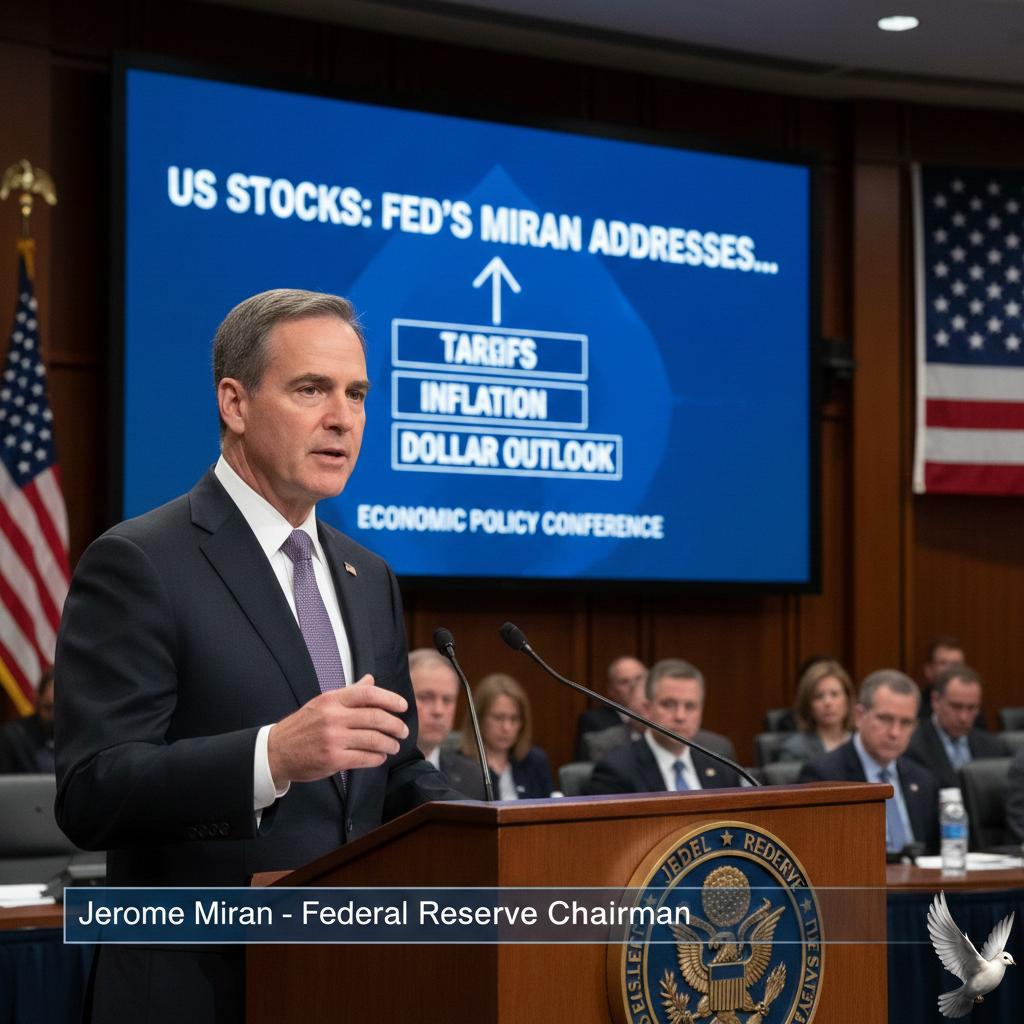
US Stocks: Fed’s Miran Addresses Tariffs, Inflation, and Dollar Outlook
Federal Reserve Governor Stephen Miran has reported that recent trade policies have been significantly less damaging to the U.S. economy than critics initially projected. According to Miran, foreign companies have absorbed a large portion of the costs associated with new tariffs, limiting the direct impact on American consumers. The U.S. economy continues to demonstrate resilience as of February 2026. While many analysts feared a spike in inflation, Miran argues that the burden of these trade measures has fallen primarily on foreign exporters who are unable to easily shift their production or supply chains. Key financial data supports this outlook of fiscal benefit. The federal government has collected approximately **$90 billion** in customs duties in the 2026 fiscal year through December. This represents a staggering **332% increase** compared to the same period in the previous year. For the full 2025 calendar year, total tariff-related collections reached **$287 billion**, nearly tripling previous records. Market shifts are also becoming visible as the administration refines its strategy. A historic trade deal with India was reached this week, reducing reciprocal tariffs from **25% to 18%** and removing certain penalties in exchange for commitments to stop purchasing Russian oil. Additionally, reports indicate the administration plans to carve out Big Tech from upcoming chip tariffs to protect investments in artificial intelligence data centers. Despite a projected slowdown in real GDP growth to **1.5%** for 2026, the average effective tariff rate on imports has climbed to **11.4%**, the highest level since the 1940s. Proponents argue these revenues provide a critical buffer for government finances, potentially raising up to **$2 trillion** over the next decade. The broader market remains cautiously optimistic. Equity indices have seen recent gains, with the BSE benchmark rising over **2,800 points** following trade clarifications. While household costs for specific items like apparel and electronics have seen some upward pressure, the overall inflationary impact is currently estimated at a manageable **0.9% to 1.3%**. Strategic exemptions for essential household goods and critical technology sectors are being used to balance revenue goals with consumer affordability. This evolving trade framework suggests a transition toward a rules-based system that prioritizes American manufacturing and supply chain security.

RailTel Shares Rise 7% Following ₹455 Crore Railway Contract Award
RailTel Corporation of India shares surged 6.6% to reach 354.40 on Tuesday, following the announcement of a major infrastructure contract. The company secured a Letter of Acceptance from West Central Railway for a project valued at 454.95 crore. The project involves large-scale infrastructure work and is scheduled for completion by September 24, 2028. RailTel has been given a 960-day execution timeline to deliver the contract. This win reinforces the company's position as a key technology provider for the national carrier. This contract adds significant volume to RailTel’s robust order book, which was last reported at 8,251 crore as of late 2025. The company’s project pipeline has seen rapid expansion, with new orders in the first half of the current fiscal year growing three times faster than the previous year. Financial performance for the December 2025 quarter showed steady revenue growth. RailTel reported a turnover of 924 crore, representing an 18.1% increase year-on-year. While quarterly net profit stood at 62 crore—a slight 4.1% dip compared to the same period last year—operating income remains on an upward trajectory. The stock is currently trading at a Price-to-Earnings ratio of 34.1. Its Price-to-Book ratio stands at 5.42, reflecting market confidence in its Navratna PSU status. Foreign Institutional Investors have also shown increased interest, raising their stake to 3.68% in the most recent quarter. Market momentum for the railway sector remains high as the government allocates 2.52 lakh crore in capital outlay for the 2025-26 period. A significant portion of this budget—approximately 68 crore—is specifically earmarked for signaling and telecommunications, where RailTel maintains a dominant footprint. Short-term technical indicators show a bullish trend, with the stock trading above five of its eight short-term simple moving averages. However, long-term indicators suggest some resistance as the stock remains below its 52-week high of 478.95. The West Central Railway order is a domestic project and does not involve related-party transactions. This transparency, combined with a debt-free balance sheet and a consistent dividend payout of 37%, continues to support RailTel’s valuation in the ICT and telecom infrastructure space.

Impact of Data Center Tax Holidays on Power and Real Estate Equities
The Union Budget 2026-27 has introduced a transformative policy framework that positions India as a premier global hub for data processing and cloud services. A cornerstone of this strategy is the new tax holiday extended until 2047 for foreign companies providing global cloud services from data centers located within India. This long-term fiscal certainty is designed to attract massive capital from global hyperscalers and institutional investors. By aligning incentives with the 20- to 30-year lifecycle of data center assets, the government has addressed the industry’s need for multi-decade stability. The market impact is already visible through record-breaking expansion figures. India’s operational data center capacity surged to 1.5 GW by the end of 2025, with projections indicating a jump to 1.7 GW by the close of 2026 and nearly 2 GW by 2027. This rapid build-out is backed by a projected investment of over 30 billion USD in capital expenditure through 2030. Beyond direct tax breaks, the budget has simplified operational hurdles by introducing a 15% safe harbor on costs for related-party services. This move significantly reduces transfer pricing litigation risks, providing the clear return visibility that global funds require before committing to large-scale infrastructure. The ripple effects across proxy sectors are substantial. Real estate demand for data centers is expected to reach 9.3 million square feet by 2027. Developers are pivoting from speculative projects to high-density, AI-ready campuses, particularly in primary hubs like Mumbai, which holds 52% of current capacity, and Chennai, which commands 20%. Infrastructure and power plays are seeing a parallel surge. As data centers consume massive amounts of energy, the budget’s focus on renewable integration is critical. Large-scale 2 GW renewable energy partnerships and 76,000 crore INR outlays for the semiconductor and electronics ecosystem are creating a vertically integrated supply chain. The geography of investment is also shifting. While the "big five" metros remain dominant, 2026 is seeing a strategic migration to Tier-2 cities like Hyderabad, Kochi, and Visakhapatnam. These secondary markets are benefiting from lower land costs and new submarine cable landing stations, facilitating the rise of edge computing. For the digital services sector, the integration of the IndiaAI Mission—with an allocation of over 10,300 crore INR—complements the physical infrastructure. This ensures that the newly built data centers are populated with high-value AI workloads, sovereign data processing, and global cloud exports. India is no longer just a consumer market; it is evolving into a global exporter of compute power. With tax certainty secured for the next 21 years, the data center industry has moved from a niche real estate play to a core pillar of the national economic strategy.

Silver and gold prices decline as silver slips below Rs 2.6 lakh per kg
The bullion market is currently navigating a period of high sensitivity as participants await critical macroeconomic signals. Precious metals showed consolidation on the Multi Commodity Exchange (MCX) and international platforms as of February 10, 2026. This follows a period of extreme price swings triggered by shifting expectations for U.S. monetary policy. MCX and International Price Levels On the domestic front, MCX Gold futures for April delivery are trading near **158,394** per 10 grams, a slight recovery of **0.21%** following recent volatility. Silver futures for March delivery on the MCX are hovering around **262,745** per kg, maintaining a marginal gain of **0.05%** during the early session. In international markets, spot gold has stabilized near **$5,066** per ounce. The metal remains below its January 29 record high of **$5,594**. Spot silver is trading at approximately **$81.20** per ounce, recovering from recent sharp liquidations but staying significantly below its all-time peak of **$121.64**. Federal Reserve and Economic Data Market attention is firmly fixed on the Federal Reserve’s interest rate trajectory. The Fed recently held rates steady in the **3.50% to 3.75%** range. Investors are now bracing for the release of the delayed January jobs report on February 11 and the Consumer Price Index (CPI) on February 13. These data points are viewed as decisive for the March policy meeting. While the Fed has paused its cutting cycle, many analysts still price in at least two rate cuts later in 2026. The nomination of Kevin Warsh as the next Fed Chair has introduced a hawkish sentiment, providing modest support to the U.S. Dollar and capping the upside for non-yielding bullion. Market Sentiment and Drivers Volatility in the metals complex has been amplified by speculative activity and technical corrections. A sharp rebound in the U.S. Dollar earlier this month led to a significant "speculative blowoff," particularly in silver, which saw a nearly **50%** intraday wipeout from its January highs before stabilizing. Despite near-term fluctuations, structural support for gold remains robust. Central banks continue to be steady buyers, with total official reserves in gold now accounting for nearly **20%** of global reserves. Geopolitical risks, including ongoing U.S.-Iran discussions and expansionary fiscal policies in Japan, provide a secondary layer of support for safe-haven assets. Outlook for Investors The market is characterized by "buy the dip" behavior among retail and institutional investors. While the partial U.S. government shutdown has been resolved, fiscal concerns and the potential for a less independent Federal Reserve keep the long-term bullish case intact. Analysts anticipate that gold may sustain support around **$4,680** per ounce on a closing basis this week, while silver is expected to hold near the **$65** per ounce level. Continued volatility is likely as the market recalibrates in response to this week’s inflation and employment headlines.

Gold Prices Moderate Amid Anticipation of US Economic Reports
The gold market is demonstrating significant resilience as of February 10, 2026, with spot prices maintaining a firm footing above the critical **$5,000 per ounce** threshold. Following a period of historic volatility, the yellow metal has transitioned into a consolidation phase, currently trading near **$5,004 to $5,056 per ounce**. In domestic markets, the rally has reached unprecedented heights. On the Multi Commodity Exchange (MCX), gold futures for April delivery are trading near **₹1,58,060 per 10 grams**, approaching the **₹1.58 lakh** milestone. Retail prices for 24K gold in major Indian hubs like Mumbai and Delhi have stabilized around **₹15,806 per gram**, reflecting a year-on-year surge of approximately **85%** compared to early 2025. Silver has mirrored this upward trajectory but with heightened intensity. After a dramatic recovery from a recent "flash crash" floor, silver prices have surged back to **₹3,00,000 per kilogram** in the retail market, a one-day jump of roughly **5.3%**. Internationally, spot silver is holding steady above **$80 per ounce** as it recovers from the extreme liquidations seen in late January. The primary catalyst for this current strength is a softening U.S. dollar, which hit its lowest levels since early February. This currency weakness, combined with a "bargain-hunting" sentiment following last week's correction, has provided a supportive floor for precious metals. Investor attention is now squarely fixed on a critical slate of U.S. economic data. The upcoming release of non-farm payrolls and Consumer Price Index (CPI) figures is expected to provide the definitive roadmap for the Federal Reserve’s interest rate path. Market participants have already priced in at least two 25-basis-point rate cuts for 2026, with the first widely anticipated by June. Any indication of a cooling labor market or slowing inflation in the upcoming reports would likely reinforce the case for lower rates, further increasing the appeal of non-yielding assets like bullion. Beyond the U.S. macro environment, structural demand remains a pillar of market support. Central banks continue to be aggressive buyers, with the People's Bank of China reporting its 15th consecutive month of gold accumulation. While equity markets like the Dow Jones remain near record highs, the widening performance gap between stocks and gold suggests that institutional investors are quietly rotating into defensive positions. This divergence indicates that gold is currently functioning as an early warning signal for systemic risks that have not yet been fully absorbed by the broader stock market. Near-term volatility is expected to remain elevated. Analysts suggest that while the broader fundamental outlook for 2026 remains bullish—with some forecasts pointing toward **$5,400 per ounce** by year-end—the market will face immediate technical resistance as it attempts to break through the psychological barriers set during last month's peak.

Alphabet Bond Sale Sparks Discussions on AI-Driven Corporate Debt Trends
**Alphabet Bond Issuance & AI Spending Surge** Alphabet, the parent company of Google, has successfully raised $20 billion through a massive bond sale, marking its largest-ever U.S. dollar debt offering. The deal, finalized on February 9, 2026, saw overwhelming demand with investor orders peaking at over $100 billion. This capital injection is a strategic move to finance an aggressive expansion in artificial intelligence infrastructure. The $20 billion total exceeded initial expectations of $15 billion, signaling intense market appetite for Big Tech debt. In a historic move, Alphabet is also exploring the issuance of 100-year bonds in international markets like the UK and Switzerland. This represents the first time a major technology firm has attempted such a long-term offering since the late 1990s. **Unprecedented Capital Expenditure** Alphabet’s borrowing follows a bold forecast of $185 billion in capital expenditures for 2026. This figure is more than the company spent over the previous three years combined. The vast majority of these funds is dedicated to building next-generation data centers and purchasing the high-end processors required to run advanced AI models like Gemini. The trend extends across the sector. The four largest U.S. hyperscalers—Amazon, Alphabet, Meta, and Microsoft—are projected to spend a combined $650 billion on AI infrastructure this year. Amazon alone has targeted a $200 billion outlay, while Meta’s spending is expected to jump by nearly 87%. **Broader Corporate Bond Market Trends** The surge in tech borrowing is pushing the global corporate bond market toward record levels. Analysts expect total non-financial issuance to expand by 5% in 2026, building on a robust 2025 where companies raised trillions to secure resources for the AI arms race. While investor demand remains high, the scale of debt has introduced some market volatility. Average high-grade corporate bond spreads recently edged wider as money managers assess the long-term risks of such massive spending. Despite these jitters, Alphabet’s successful sale indicates that the market currently prioritizes AI growth over debt concerns. **Key Financial Indicators** Alphabet’s Google Cloud division is a primary driver of this investment, showing 48% year-over-year revenue growth. The company’s contracted backlog has surged to $240 billion, providing a solid foundation for future returns. As of February 2026, Alphabet maintains a resilient balance sheet with a low debt-to-equity ratio, even as it pivots from being a net saver to a high-volume borrower. This shift highlights a major transition in the technology sector, where physical infrastructure and massive capital outlays have become the primary battleground for industry dominance.
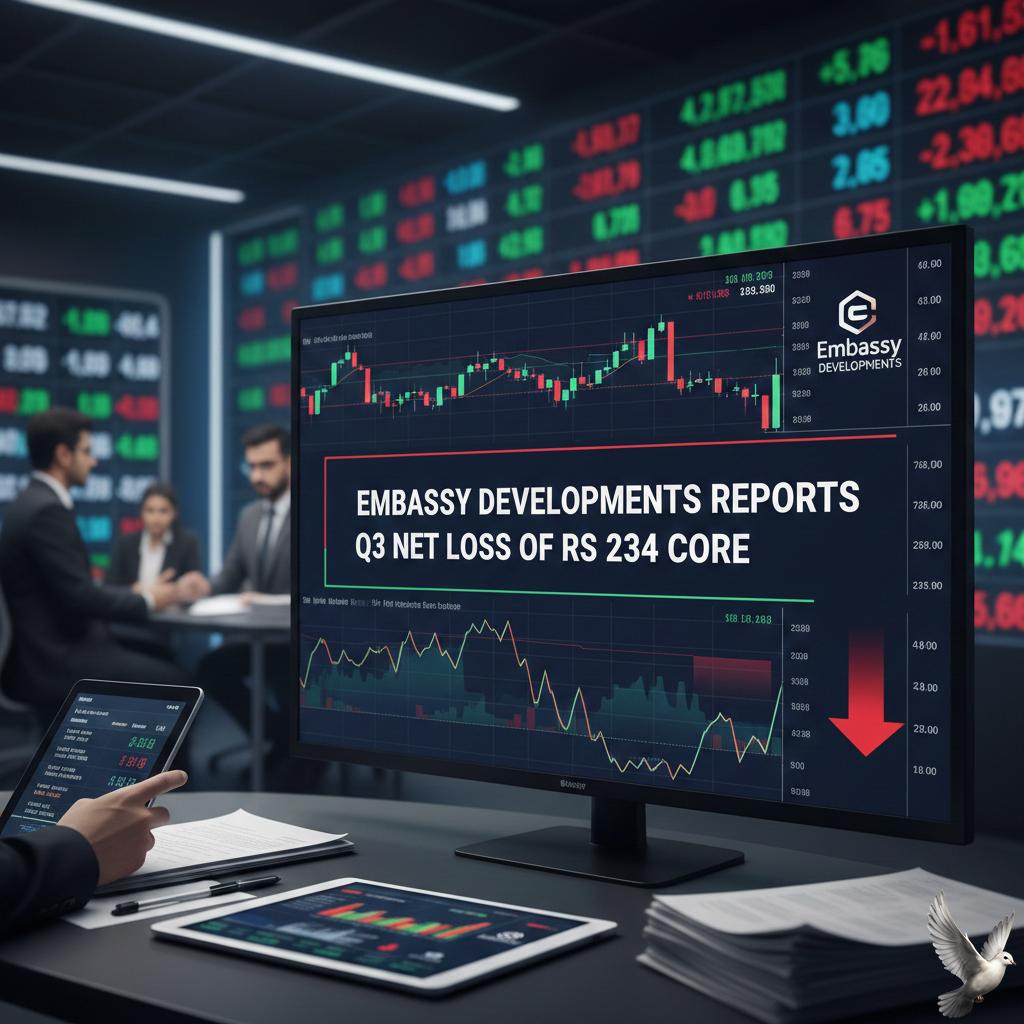
Embassy Developments Reports Q3 Net Loss of Rs 234 Crore
Market Brief: India’s Corporate Pivot and Q3 Performance The Indian equity landscape is witnessing a significant shift in corporate earnings trajectory as the current fiscal year progresses. Benchmark indices are maintaining a positive bias. On February 10, 2026, the **BSE Sensex** rose over **250 points** to trade near **84,232**, while the **Nifty 50** comfortably crossed the **25,900** mark. This momentum is supported by a notable recovery in private capital expenditure, which has seen a **13.1%** year-on-year increase in fixed assets among listed companies. Sectoral Profitability Trends Corporate results for the third quarter of FY26 highlight a transition from stabilization to growth. Major financial institutions have set a strong tone, with the State Bank of India reporting a **24.5%** jump in standalone net profit to **Rs 21,028 crore**. This is a sharp contrast to the broader cautiousness seen in late 2025. The retail and consumer segments are also displaying resilience. Consolidated Gross Merchandise Value in the beauty and fashion sector reached **Rs 5,795 crore**, reflecting a **28%** year-on-year increase. These figures underscore a broadening consumption base despite global macroeconomic uncertainties. Operational Costs and Margins While top-line growth remains steady, profitability for many firms is being balanced against rising operational costs. A primary factor this quarter is the implementation of new Labour Codes, which has led to exceptional outgoes for several companies. One prominent firm reported an exceptional impact of **Rs 28.48 crore** related to these regulatory changes. This follows a period where the company had posted a net loss of **Rs 26.54 crore** in the year-ago period, marking a crucial turnaround point in its financial health. Economic Indicators and Outlook The broader economic environment remains supportive. India’s real GDP growth for FY26 is projected at **7.4%**, the fastest among G-20 economies. External buffers are robust, with foreign exchange reserves standing at approximately **$701.4 billion** as of early 2026. Infrastructure and core sectors continue to drive volume, with cement production surging **13.5%** and steel rising **6.9%**. This industrial momentum, combined with the recent India-US trade deal, is expected to provide a tailwind for export-linked sectors and small-to-medium enterprises throughout the remainder of the year. The cooling of the **India VIX** volatility index to around **12.19** suggests that market participants are becoming more comfortable with current valuation levels, even as they navigate a new tax structure in the derivatives segment.

FIIs Invest Rs 11,500 Crore in Metal Stocks Amid Sector Growth Expectations
Market Brief: Indian Metals Surge **Foreign Institutional Investors (FIIs)** have made a dramatic pivot toward Indian metal stocks. In **January 2026**, these investors poured **₹11,526 crore** into the sector. This massive inflow occurred even as the broader market faced a brutal selloff, with FIIs dumping **₹35,960 crore** across other major segments like financials and healthcare. This concentrated buying has fueled speculation of a new **commodity super cycle**. Experts point to a structural shift driven by the global energy transition. Demand for primary metals is surging, with the global primary aluminum market expected to swing into a deficit this year. Critical Price Indicators Metal prices are reflecting this supply-demand tension. In domestic markets, benchmark prices have seen significant movement: * **Aluminum Ingot:** Trading near **₹312–₹320 per kg** * **Copper Cathode:** Averaging around **₹1,246–₹1,289 per kg** * **Zinc Ingot:** Holding steady at **₹323–₹332 per kg** On the **London Metal Exchange (LME)**, aluminum has recently crossed the **$3,100 per tonne** mark. Analysts forecast copper could average **$10,710** through the first half of **2026**, driven by infrastructure needs for AI data centers and defense. Domestic Sector Performance The **Nifty Metal Index** has emerged as a top market performer, gaining over **7.7%** year-to-date and climbing **41%** over the past year. Individual stock rallies have been even more pronounced: * **NALCO:** Up **18%** in 2026 * **Vedanta:** Gained **12%** following demerger progress * **Hindustan Copper:** Surged **10%** in just five weeks * **Hindalco:** Up **8%** with rising foreign stake ownership Capacity and Infrastructure Push Indian producers are aggressively expanding to meet this demand. **Tata Steel** has committed **₹15,000 crore** in capital expenditure for the current fiscal year, aiming to nearly double its domestic capacity to **40 million tonnes** by **2030**. Similarly, **JSW Steel** is targeting a massive **50 million tonne** annual capacity. The government is supporting this growth through the **PLI 1.2 Scheme for Specialty Steel**, which has already seen **85 agreements** signed with **55 companies**, committing **₹11,887 crore** in new investments. Growth Drivers The sector is benefiting from three primary tailwinds: * **Electric Vehicles (EVs):** High-intensity use of copper and aluminum in batteries and wiring. * **AI Infrastructure:** Massive steel and aluminum requirements for structural server racks and cooling systems in data centers. * **Trade Policy:** A recent **interim trade deal** with the U.S. has reduced certain tariffs to **18%**, enhancing the export competitiveness of Indian aerospace and automotive-grade metals. The combination of limited global supply and localized capacity expansion suggests a long-term structural upturn for Indian metal producers.

Sensex Rises 150 Points and Nifty Holds Above 25,900 as Smallcaps Outperform
**Market Brief: Indian Equities Extend Rally** The Indian stock market sustained its upward momentum on **Tuesday, February 10, 2026**, marking a third consecutive session of gains. Both benchmark indices opened higher, buoyed by a landmark **India-US interim trade framework** and the return of consistent foreign capital inflows. The **SENSEX** advanced by over **200 points** in early trade to reach **84,203**, while the **NIFTY 50** climbed above the **25,900** mark. This follow-through buying comes after a strong performance on Monday, where the Sensex ended at a one-month high of **84,065.75**, up **0.58%**. **Small-Cap and Mid-Cap Performance** While large-cap stocks provided a steady floor, the **NIFTY Smallcap index** continued to lead the charge, outperforming the frontline gauges with an early gain of **0.55%**. This follows a massive **2.65%** surge in the previous session. Mid-cap stocks also showed resilience, with the **BSE MidCap** index closing Monday up **2.1%**. Market sentiment has been significantly bolstered by a recovery in retail investor interest and the stabilization of private capital expenditure. **Banking and Sectoral Drivers** Public sector banks are currently the primary engine of the market rally. **State Bank of India (SBI)** surged over **7%** to reach record highs after reporting a **24.5%** jump in net profit, hitting **₹21,028 crore** for the December quarter. The **NIFTY Consumer Durables** index also showed strength, rising **1.3%**. Other sectors contributing to the positive sentiment include: * **Auto:** Led by Tata Motors and Titan. * **Metals:** Buoyed by firm global commodity prices. * **Healthcare:** Showing steady gains between **0.5% and 1%**. **Macroeconomic Backdrop** The Reserve Bank of India recently maintained the repo rate at **5.25%**, signaling a neutral stance. The central bank revised its **FY26 GDP growth forecast to 7.4%**, citing robust domestic consumption and a revival in manufacturing. External validation from **Moody’s** further supported the bullish outlook, as the agency projected India to remain the fastest-growing **G-20 economy** in the coming fiscal year. **Corporate Earnings Pulse** A wave of strong Q3 results continues to drive individual stock action. **BSE Ltd** shares jumped **5%** following a nearly threefold profit surge to **₹602 crore**. Similarly, **Navin Fluorine** reported a net profit increase of **122%**, reaching **₹185 crore**. Despite the broader rally, the **India VIX** volatility index settled near **12.19**, indicating a cooling of investor nervousness and a shift toward a "risk-on" environment. The market remains focused on the **26,000 level** for the Nifty as the next major psychological resistance, with support firmly established at **25,640**.

Aye Finance IPO: GMP, Subscription Status, and Brokerage Reviews on Day 2
Market performance for the Aye Finance initial public offering remains cautious as it enters its final stages. The Rs 1,010 crore issue, which opened on February 9, has seen a subdued response from major investor categories despite the company's established position in the MSME lending sector. As of February 10, 2026, the IPO was subscribed approximately 12% overall. Retail investors have been the primary drivers of demand, subscribing to 26% of their allotted portion. In contrast, interest from Qualified Institutional Buyers and Non-Institutional Investors remains thin, with subscription rates hovering at 13% and 1% respectively. The price band for the offer is set between Rs 122 and Rs 129 per share. The issue includes a fresh equity portion of Rs 710 crore and an offer for sale worth Rs 300 crore from existing investors. The company currently commands a valuation of approximately Rs 3,184 crore at the upper price limit. Grey market sentiment reflects this measured outlook. The Grey Market Premium is currently flat at Rs 0, suggesting that shares are trading at their issue price with no immediate expectation of listing gains. This follows a downward trend from a small premium of Rs 5–7 seen earlier in the month. The broader MSME lending environment is undergoing significant regulatory shifts. The Reserve Bank of India recently announced plans to double the collateral-free loan limit for micro and small enterprises from Rs 10 lakh to Rs 20 lakh, effective April 2026. While this supports sector growth, it also places a spotlight on the credit quality of NBFCs. Aye Finance reported a profit of Rs 175.3 crore for the fiscal year ending March 2025, with a 38% rise in net interest income. However, recent data for the first half of fiscal year 2026 indicates rising credit costs, currently at 7%, and a drop in year-on-year profits by roughly 40% due to increased impairment charges. The company's Gross Non-Performing Assets rose to 4.85% as of September 2025, up from 2.49% in 2023. This increase in stress within the unsecured lending book is a key factor contributing to the current hesitancy among institutional buyers. Investors have until February 11 to participate in the offering. The basis of allotment is expected to be finalized by February 12, with the official listing on the BSE and NSE platforms scheduled for February 16, 2026. The capital raised from the fresh issue is intended to augment the company's capital base to meet future requirements arising from business and asset growth. Market participants are closely monitoring whether institutional participation will pick up during the final hours of the subscription window.

Sri Lotus Developers & Realty Q3 Net Profit Increases 37% YoY to Rs 70 Crore
Sri Lotus Developers & Realty Ltd has reported a powerful financial performance for the quarter ending December 2025. The company’s consolidated net profit surged by 37%, reaching 70.22 crore compared to 51.35 crore in the same period last year. This growth is supported by a massive expansion in total income, which climbed to 239.78 crore. This represents a 93% year-on-year revenue jump from the 123.59 crore recorded previously. Operational momentum remains high, with pre-sales for the quarter skyrocketing by 247% to 376 crore. The Mumbai-based developer is currently managing a heavy project pipeline. While the company has completed four projects totaling 4.2 lakh square feet, it is now focused on six ongoing and 14 upcoming developments. These new ventures cover approximately 39.5 lakh square feet of carpet area. A key strategic highlight is the company’s recent entry into the GIFT City area. In January 2026, Sri Lotus signed a development agreement for a large-scale mixed-use project with an estimated gross development value of 2,000 to 2,200 crore. This move aligns with the firm’s shift toward high-value, asset-light redevelopment models. Market sentiment remains generally positive following these results. The stock price currently trades near 149.69, reflecting stability after the earnings release. Investors are monitoring the company's transition to a debt-free status, as it maintains a significant net cash balance of approximately 845 crore. The broader Indian real estate sector is entering a phase of disciplined growth in early 2026. While demand remains resilient, especially in premium segments, developers are navigating rising input costs and a more selective buyer market. Mumbai and Hyderabad continue to lead in sales volumes, while other regions like NCR and Pune undergo consolidation. Management has maintained an optimistic outlook for the remainder of the 2026 fiscal year. The company is targeting annual pre-sales between 1,100 and 1,300 crore. Upcoming launches, including the Lotus Aquaria and Lotus Celestia projects, are expected to further drive revenue growth in the final quarter.

Upstox Targets Rs 500 Crore FY26 Profit Amid Postponed IPO Plans
Upstox is implementing a strategic shift toward sustainable profitability, deprioritizing an immediate initial public offering. The brokerage has set a clear financial target to achieve a **2.3x jump** in profit after tax, aiming for **₹500 crore** by the end of **FY26**. This ambitious growth target follows a solid performance in **FY25**, where the company reported a total income of **₹1,208 crore** and a net profit of **₹215 crore**. Despite a challenging environment for retail trading, the firm has maintained a stable market share of **4.64%** with over **2.08 million** active clients. To mitigate the impact of recent regulatory changes, including the hike in Securities Transaction Tax on derivatives, Upstox is aggressively diversifying its revenue streams. The focus has shifted toward high-growth, non-equity segments to build a more resilient business model. The commodities division has emerged as a primary driver, recording a **400% revenue surge** and doubling its market share in average daily turnover. This expansion is designed to offset potential volatility in the core equity and futures segments. The Margin Trading Facility has also seen significant traction, with the book growing more than **two-fold** year-on-year. Additionally, the company is scaling its mutual fund vertical, where systematic investment plan assets-under-advisory have seen a market share increase of nearly **12%**. By focusing on high-intent traders and deeper customer engagement, the firm has increased its active revenue per user by over **40%**. This shift toward quality over volume is intended to strengthen the balance sheet ahead of any future public listing. The broader market context remains complex as new **SEBI regulations for 2026** introduce stricter governance and higher entry barriers for intermediaries. Upstox is positioning itself within this new framework by prioritizing operating leverage and multi-asset diversification. Management maintains that the long-term opportunity for retail participation in India remains structurally large, despite cyclical slowdowns. The current strategy ensures the company is well-capitalized, with cash and bank balances exceeding **₹2,744 crore**, providing a strong foundation for the next phase of growth.

Happiest Minds Q3: Net Profit Declines 19% as Revenue Grows 10%
Happiest Minds Technologies has demonstrated significant top-line resilience in its latest Q3 FY26 results, navigating a complex macroeconomic landscape with a focused digital strategy. The company reported a 10.7% year-on-year increase in consolidated revenue, reaching 587.56 Crores. This growth was underpinned by a 7.1% rise in constant currency terms, reflecting steady demand for its specialized IT services. Profitability for the quarter faced a temporary impact, with Net Profit (PAT) declining 19.6% year-on-year to 40.30 Crores. This downturn was largely driven by an exceptional one-time charge of 22.03 Crores related to the implementation of new Labour Code costs and non-cash acquisition amortization. When adjusting for these one-off items, the Adjusted PAT showed a healthy growth of 13.0%, totaling 69.92 Crores. Operational efficiency remained a core strength, with EBITDA margins holding steady at 20.4%. The company’s utilization rate improved to 82.0%, up from 78.0% in the previous year, signaling tighter resource management. The active customer base expanded to 297, including 87 billion-dollar corporations, supported by 11 new strategic client wins during the quarter. The "AI First. Agile Always." roadmap is now the central driver of long-term growth. Management has announced plans to scale its AI workforce to over 1,000 professionals by the end of FY27. Current GenAI initiatives are moving rapidly from pilot stages to full-scale production, with 32 active use cases already delivering outcomes in sectors like healthcare and FMCG. Market sentiment reflects the broader pressures within the Indian IT sector. Shares of Happiest Minds recently touched a 52-week low of 381.50 before stabilizing around 396.00. Despite the price volatility, the company maintains a conservative debt-to-equity ratio of 0.08 and a high dividend payout ratio of 48.7%, highlighting its commitment to shareholder value. The broader industry context remains optimistic as India’s IT sector is projected to reach 350 billion USD by the end of 2026. Happiest Minds is positioning itself to capture this momentum by integrating agentic AI and intelligent automation into its core offerings. This strategic pivot aims to offset sectoral headwinds and drive sustainable returns as enterprises transition toward AI-centric architectures.
Alphabet Plans $15 Billion U.S. Bond Offering
Alphabet is executing a massive financial expansion, scaling its latest U.S. dollar bond offering to **$20 billion** to meet the explosive capital demands of the artificial intelligence era. This maneuver follows a landmark fiscal year where the company’s annual revenue surpassed **$400 billion** for the first time, fueled by a **48%** surge in Cloud revenue. The bond sale has seen extraordinary market appetite, drawing over **$100 billion** in orders. This five-fold oversubscription highlights intense investor confidence despite a broader tech sector rotation. Alphabet is leveraging this liquidity to fund a record-breaking capital expenditure budget projected between **$175 billion and $185 billion** for 2026. This spending is primarily dedicated to specialized AI chips, high-density data centers, and the scaling of the Gemini 3 ecosystem. In a rare move for the technology sector, the offering includes a potential **100-year "century bond"** alongside seven tranches of varying maturities. Pricing for the long-dated 2066 notes has tightened significantly, now sitting at approximately **0.95 percentage points** over U.S. Treasuries, down from earlier discussions of **1.2 points**. This aggressive financing reflects a strategic shift to lock in long-term capital as the cost of AI infrastructure continues to scale. Alphabet is not alone in this debt-fueled arms race. Industry peers including Amazon, Meta, and Microsoft are projected to contribute to a combined **$650 billion** in AI infrastructure outlays this year. While these "hyperscalers" face scrutiny over the pace of returns on these massive investments, Alphabet has reported a **78%** reduction in Gemini serving costs over the past year, signaling improved operational efficiency. The current bond market is absorbing this record issuance with ease, supported by **$6.44 billion** in weekly inflows to high-grade funds. However, the sheer volume of tech debt is beginning to pressure valuations, with high-grade spreads edging wider. Alphabet’s move to secure **$20 billion** now—up from the initial **$15 billion** target—ensures the company maintains its lead in computing power while the credit window remains wide open.
Crompton Greaves Q3 Results: Net Profit Declines 10% YoY as Margins Contract
**Crompton Greaves Consumer Market Brief** Crompton Greaves Consumer Electricals (Crompton) reported its Q3 FY26 results on February 10, 2026, revealing a complex landscape of steady revenue growth paired with bottom-line pressures. The company’s consolidated revenue for the quarter rose **7.3%** year-on-year to reach **Rs 1,898 crore**. Despite the healthy top-line expansion, net profit saw a **10%** decline, settling at **Rs 101 crore**. This dip was largely attributed to a one-time exceptional charge of **Rs 20.04 crore** related to the reassessment of employee obligations under new labor codes. Adjusted for this item, profitability remained relatively stable, though margins were impacted by persistent commodity inflation. **Strategic Pivot into Residential Wires** In a significant move to expand its Total Addressable Market (TAM), Crompton officially announced its entry into the residential wires category. This transition aims to position the brand as a comprehensive home solutions provider. A full range of wire products is expected to hit select markets within the next six weeks, leveraging the company’s massive pan-India distribution network. **Segment Performance and Operational Gains** The Electric Consumer Durables (ECD) segment grew by **7.6%** to **Rs 1,385 crore**. Performance was bolstered by the successful transition to BEE 2.0 norms for ceiling fans and a surge in agricultural and solar pump demand—the solar business alone booked **Rs 19 crore** in revenue this quarter with a robust **Rs 500 crore** order book. In the lighting division, revenue climbed **6.7%** to **Rs 275 crore**. The segment maintained industry-leading margins, driven by strong double-digit volume growth in both B2B and B2C channels, particularly for ceiling lights and new accessories. **Butterfly Gandhimathi and Appliances** The subsidiary Butterfly Gandhimathi Appliances recorded revenue of **Rs 245 crore**, a **3%** year-on-year increase. While sales growth was moderate following the festive season, the business saw a significant **17%** rise in EBITDA. Profitability was supported by a focus on premium products, such as the Idea First series in cookers and gas stoves, which led to a **100-basis-point** expansion in EBITDA margins. **Stock Market Reaction** On the day of the announcement, Crompton’s stock showed high volatility, closing at **Rs 262.90**, up **7.37%** in intraday trading. This rally occurred despite a broader one-year decline of approximately **25%** in share value. Technical indicators are shifting from bearish to mildly bullish as investors react to the company’s debt reduction efforts—highlighted by the full redemption of **Rs 300 crore** in Non-Convertible Debentures (NCDs). Management has indicated that further calibrated price hikes of **1% to 1.5%** are planned for early 2026 to offset ongoing input cost pressures. The market remains focused on how the new wire and solar rooftop ventures will contribute to top-line visibility over the next **9 to 12 months**.