Bullish News
Collection
Top Cement Stock Picks: Axis Direct Forecasts Potential Returns for UltraTech, Dalmia Bharat, and JK Cement
The Indian cement sector is showing strong signs of recovery as of February 2026, supported by double-digit volume growth and a significant push in national infrastructure. Major industry players have reported robust performance in the latest quarter, driven by aggressive capacity expansions and a revival in rural housing demand. UltraTech Cement continues to dominate as the market leader with a current share price of approximately 13,048. The company reported a 23% increase in net sales for the December quarter, reaching 21,506 crore. With a massive domestic capacity of 188.66 MTPA, UltraTech is moving toward a target of 240.76 MTPA. Its operational efficiency is highlighted by an EBITDA per ton of 1,051 and a 29.4% growth in domestic grey cement volumes. Dalmia Bharat has also posted impressive gains, with its net profit surging by 94% year-on-year to 122 crore. The company's revenue rose by over 10% to 3,506 crore, reflecting its successful expansion in the North-East and Eastern markets. Current market data places its stock price near 2,300, supported by a 203% jump in net profit over the first nine months of the fiscal year. JK Cement remains a top pick with a target price of 6,685 following a 13% growth in EBITDA to 5.60 billion. The company is aggressively expanding its footprint, aiming for a total capacity of 37.3 MTPA by 2028. Its strategic shift toward premium products, which now contribute 17% of trade sales, is expected to drive margins higher. Sector-wide trends indicate a stable pricing environment. Non-trade prices have recently seen hikes of 15–20 per bag in southern markets and 5–10 in the north. This recovery is vital as the industry faces rising input costs from pet coke, coal, and new labor codes. Overall, the industry's outlook for 2026 remains positive. Analysts project a demand growth of 9–10% for the upcoming quarters, fueled by government outlays for roads, metros, and urban development. Consolidation continues to be a key theme as top producers utilize internal accruals to fund their multi-billion dollar capital expenditure plans.

Market Outlook 2026: Investment Preferences and Sector Analysis Regarding IT Management and Monopolies
Market Overview February 2026 The investment landscape for 2026 is defined by a shift toward high-moat businesses and extreme selectivity. While the previous year provided broad momentum, today's market demands a focus on "monopoly" structures as volatility returns to the forefront. Exchange Monopolies Surge Stock exchanges have emerged as the premier winners in the current environment. On February 10, 2026, BSE shares surged over 6%, hitting a record lifetime high of 3,188.40. This rally follows an explosive 174% jump in quarterly net profit to 602 crore. These businesses benefit from a 45% net profit margin and a near-tripling of operating EBITDA, proving that platform-based monopolies remain resilient even when broader sectors falter. IT Sector Under Pressure The Indian IT sector continues to face significant management and structural criticism. Despite claims of an AI-driven recovery, recent performance has been underwhelming. The Nifty IT index recently slid 1.8%, reflecting a global technology sell-off and concerns over slowing export demand. While some firms report that AI-themed deals now make up 74% of new contracts, revenue growth for the sector is projected at a modest 4% to 5% for the upcoming fiscal year. High valuations—currently at 27 times forward earnings—make the sector sensitive to any earnings misses. The US Trade Breakthrough A historic shift in trade dynamics occurred this week. On February 9, 2026, the US and India announced an Interim Trade Agreement. Key highlights include: - The US has reduced reciprocal tariffs on Indian goods from 25% to 18%. - A 25% additional tariff on Indian imports was removed following India's shift away from Russian energy. - India has committed to purchasing 500 billion USD in US energy, agricultural, and technology products. This deal introduces fresh certainty for exporters but requires investors to be highly selective in sectors like textiles and auto parts, which are now tied to new preferential quota systems. US Tech vs. Indian Services The strategy for technology exposure has shifted clearly toward the US markets. While Indian IT manages legacy cycles, the US "AI supercycle" is driving projected earnings growth of 13% to 15%. However, even US "Big Tech" is seeing volatility, with recent 1.8% weekly drops in the Nasdaq due to concerns over massive capital expenditure. This reinforces the need to seek high-quality technology plays directly in the US rather than through domestic service providers. Strategic Outlook The current recommendation is to prioritize cash preservation to capitalize on emerging volatility. With the RBI maintaining the repo rate at 5.25% and signaling a neutral stance, interest-rate-sensitive sectors like private banks remain stable, but growth is no longer guaranteed across the board. Patience is the primary tool for 2026. Investors should look past seasonal trends and focus on the "winner-takes-all" dynamic seen in exchange platforms and specific US tech leaders, while remaining cautious of the cyclical risks in domestic software management.
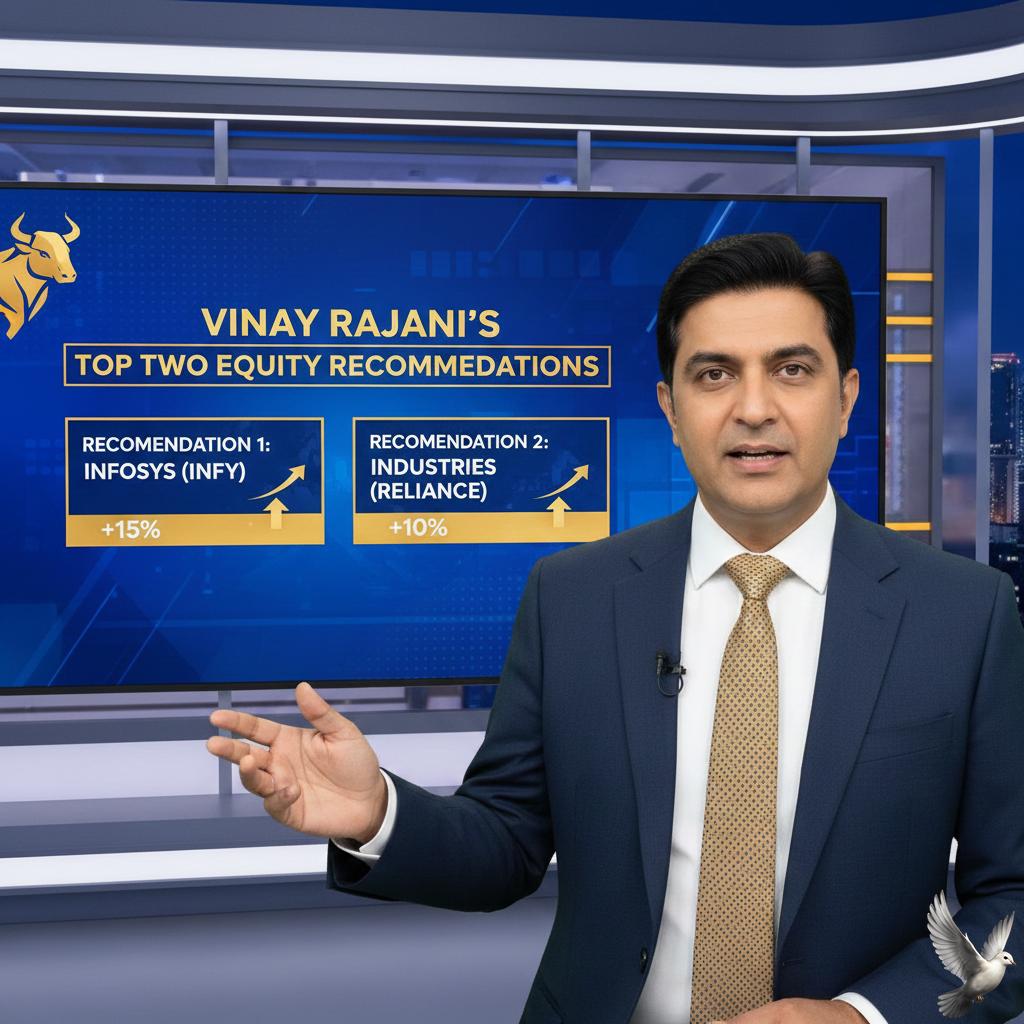
Vinay Rajani's Top Two Equity Recommendations
Market Outlook: Nifty Approaches Psychological Peak The Indian equity market maintains a firm upward trajectory as benchmark indices edge toward historic milestones. Buying interest remains robust, driven by a landmark **India-US trade agreement** and a notable shift in institutional activity. After months of offloading, **Foreign Institutional Investors (FIIs)** have turned net buyers, injecting **₹4,900 crore** into the cash segment in early February. Benchmarks and Technical Levels The **Nifty 50** is currently hovering near the **26,000** mark, closing recently at **25,867**. Technical analysts identify a "iron ceiling" at the **26,000** strike price due to heavy call-writing, while immediate support has solidified around the **25,800** and **25,600** levels. The **Sensex** continues its steady climb, holding firm near **84,400**. Both indices remain approximately **2%** below their all-time highs, suggesting a controlled rally backed by broad-based participation rather than speculative volatility. Sectoral Performance and Momentum **Public Sector Undertaking (PSU) Banks** are leading the current market surge. The sector is undergoing a significant valuation re-rating, with major players reporting record-breaking quarterly profits. State Bank of India recently jumped over **7%** following its highest-ever quarterly earnings, providing a strong tailwind for the entire banking pack. The **Metals sector** is also witnessing renewed strength, gaining nearly **6%** in the last month. Optimism surrounding reduced reciprocal tariffs and improved export visibility under the new trade framework continues to benefit industrial commodities. Key Stock Highlights **Steel Authority of India (SAIL)** is trading near **₹158**, reflecting a monthly return of approximately **9.6%**. The stock is benefiting from the broader metal rally and expectations of increased infrastructure demand. **Bank of Maharashtra** has displayed steady momentum, trading around **₹65**. The bank remains a favorite in the mid-cap PSU space due to its attractive price-to-book valuation and robust return on equity, currently positioned near **20.5%**. Market Sentiment and Flows The conclusion of the earnings season has cleared the way for a focus on macroeconomic stability. **Domestic Institutional Investors (DIIs)** continue to anchor the market with sustained inflows, absorbing previous selling pressure. Participation is widening beyond large-cap heavyweights. The **Nifty Midcap 100** and **Smallcap 100** have recently outperformed the frontline indices, rising **1.6%** and **2.6%** respectively, signaling a healthy risk-on environment. Combined with stable global cues and cooling inflation expectations, the structural bias for the Indian market remains constructive for the near term.
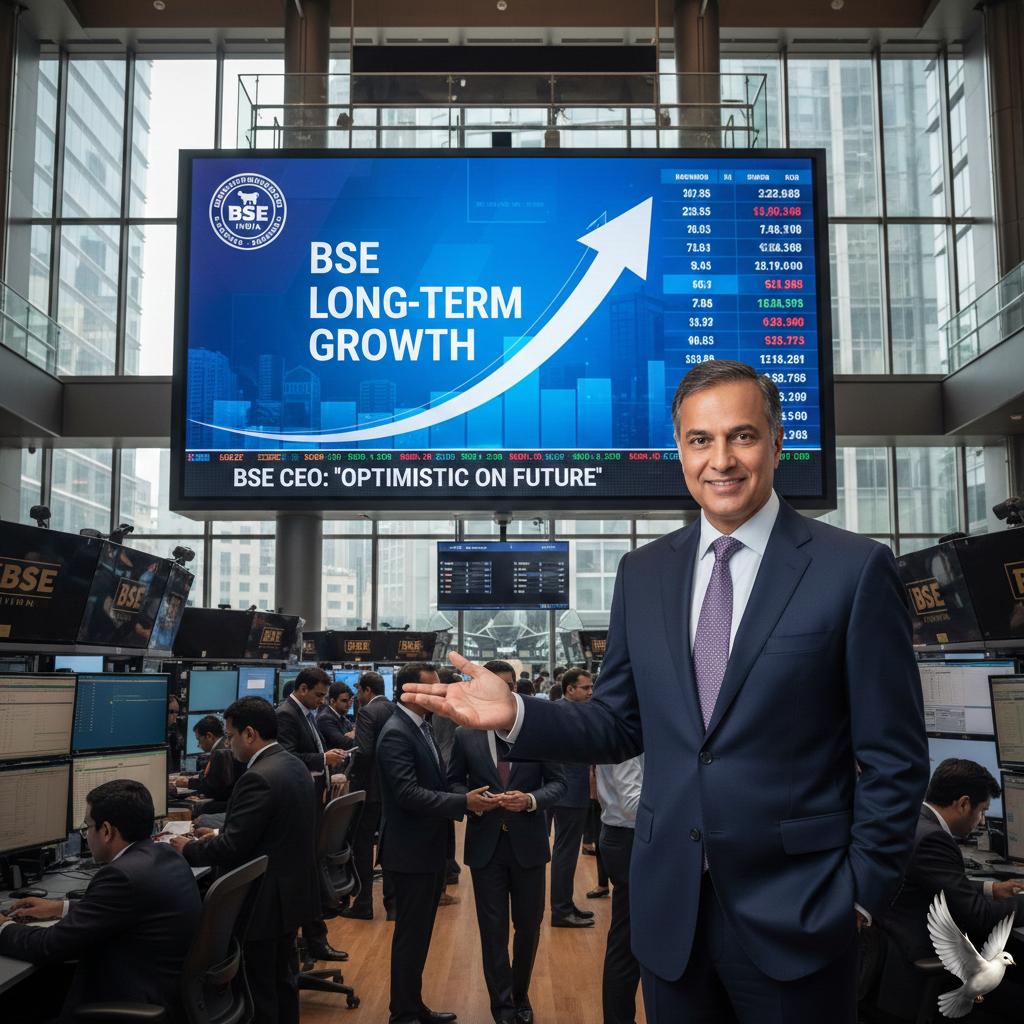
BSE CEO Expresses Confidence in Exchange’s Long-Term Growth Prospects
The BSE (Bombay Stock Exchange) is pivoting its strategic focus toward long-term capital formation, signaling a departure from the intense pursuit of derivatives market share. Managing Director and CEO Sundararaman Ramamurthy emphasizes that the exchange is in an early growth phase, with a roadmap centered on deepening the equity ecosystem rather than chasing short-term trading volumes. The financial performance of the exchange reflects this momentum. For the quarter ending December 2025, BSE reported a consolidated net profit of 602 crore, a massive 174% increase year-on-year. Revenue surged 62% to reach 1,244 crore, driven by a doubling of transaction charges. Operating margins have expanded significantly, climbing to 59% from 31% a year ago, showcasing strong operational leverage as the platform scales. Recent policy shifts from the Union Budget 2026 are actively reshaping the market microstructure. The government has introduced a steep hike in the Securities Transaction Tax (STT) on derivatives. The tax on futures has increased from 0.02% to 0.05%, while the tax on options has jumped to 0.15%. These measures are designed to curb excessive retail speculation and redirect capital toward long-term equity delivery. Further regulatory changes by SEBI, including the removal of calendar spread margin benefits on expiry days, are expected to adjust trading behaviors. These rules, effective from May 2026, aim to reduce systemic risk and operational gaps during volatile sessions. Ramamurthy views these adjustments as necessary steps to align the market with the broader goals of national capital formation. Foreign participation remains a key pillar of future growth. Currently, only about 470 Foreign Portfolio Investors (FPIs) are active on the BSE platform, suggesting vast untapped potential. New budget provisions have simplified access for Persons Resident Outside India (PROIs), doubling individual investment limits from 5% to 10% and raising the aggregate cap for foreign investors to 24%. As of February 2026, the BSE Sensex reflects a resilient market environment, trading near the 84,225 level. The exchange continues to invest in technology, recently upgrading systems to handle a nine-fold increase in trade capacity. With 99 new equity listings raising nearly 98,000 crore in the last quarter alone, the exchange is positioning itself as the primary engine for India's corporate fundraising and investor wealth creation.
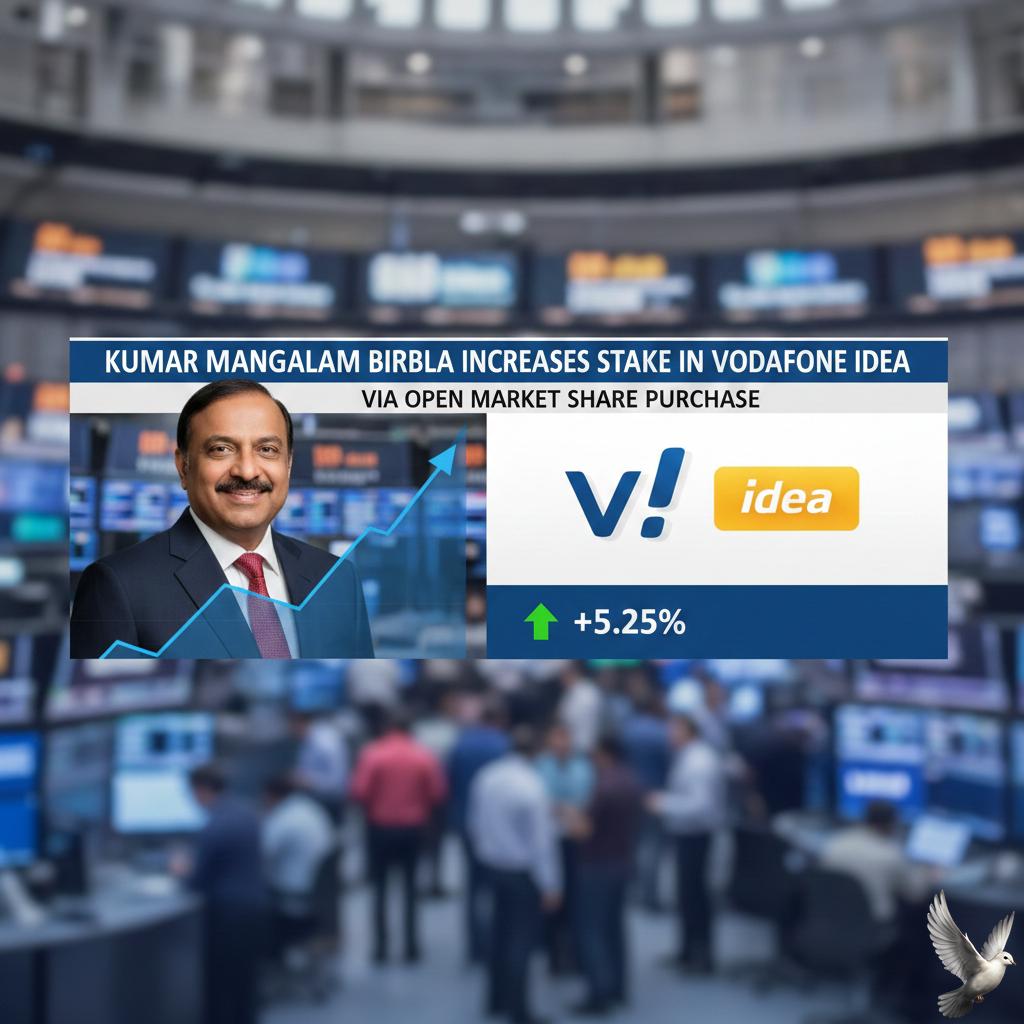
Kumar Mangalam Birla Increases Stake in Vodafone Idea via Open Market Share Purchase
The Indian telecom sector continues its shift toward a higher-revenue landscape, as highlighted by the latest Q3 fiscal performance data. While the industry remains a competitive field, the most recent reports indicate a significant stabilization in financial health for key players, driven by tariff adjustments and a migration toward 4G and 5G services. Vodafone Idea has reached a notable inflection point, reporting a narrowed net loss of 5,286 crore for the quarter ending December 2025. This shows a steady improvement from the 5,524 crore loss recorded in the previous quarter and a sharper reduction from the 6,609 crore loss during the same period last year. A primary driver for this recovery is the consistent rise in Average Revenue Per User (ARPU). The company’s blended ARPU climbed to 186, a 7.3% year-on-year increase. This growth is largely attributed to subscribers upgrading their services and the impact of entry-level tariff hikes. Despite losing approximately 20,000 wireless subscribers in early 2025, the operator is seeing a qualitative shift in its user base. The 4G and 5G subscriber count rose to 128.5 million, up from 126 million a year ago. Additionally, the premium postpaid segment grew by over 14% to reach 2.88 crore users. Capital expenditure for the quarter stood at 2,252 crore, focusing heavily on infrastructure. The company has successfully expanded its 4G population coverage to 84% and launched 5G services across 17 priority circles, spanning 29 cities. To fund this ongoing rollout, the firm recently raised 3,300 crore through debt bonds. The broader market context remains dominated by a dual-leadership structure. Reliance Jio continues to lead with over 467 million wireless subscribers and an ARPU of 213.7. Bharti Airtel maintains the industry’s highest ARPU at 259, driven by a strong focus on high-value smartphone customers and an average data usage of nearly 30GB per user. Financial liabilities remain the most significant hurdle for the sector's third-largest player. Total debt for the company currently stands at 2.09 lakh crore. This includes 1.24 lakh crore in deferred spectrum obligations and 80,502 crore in adjusted gross revenue (AGR) dues. However, recent government relief on the AGR matter and the freezing of specific liabilities have provided much-needed breathing room. As data usage per user continues to grow—now averaging 19.2 GB on the network—the focus for 2025 remains on monetizing 5G investments and stabilizing the subscriber base.
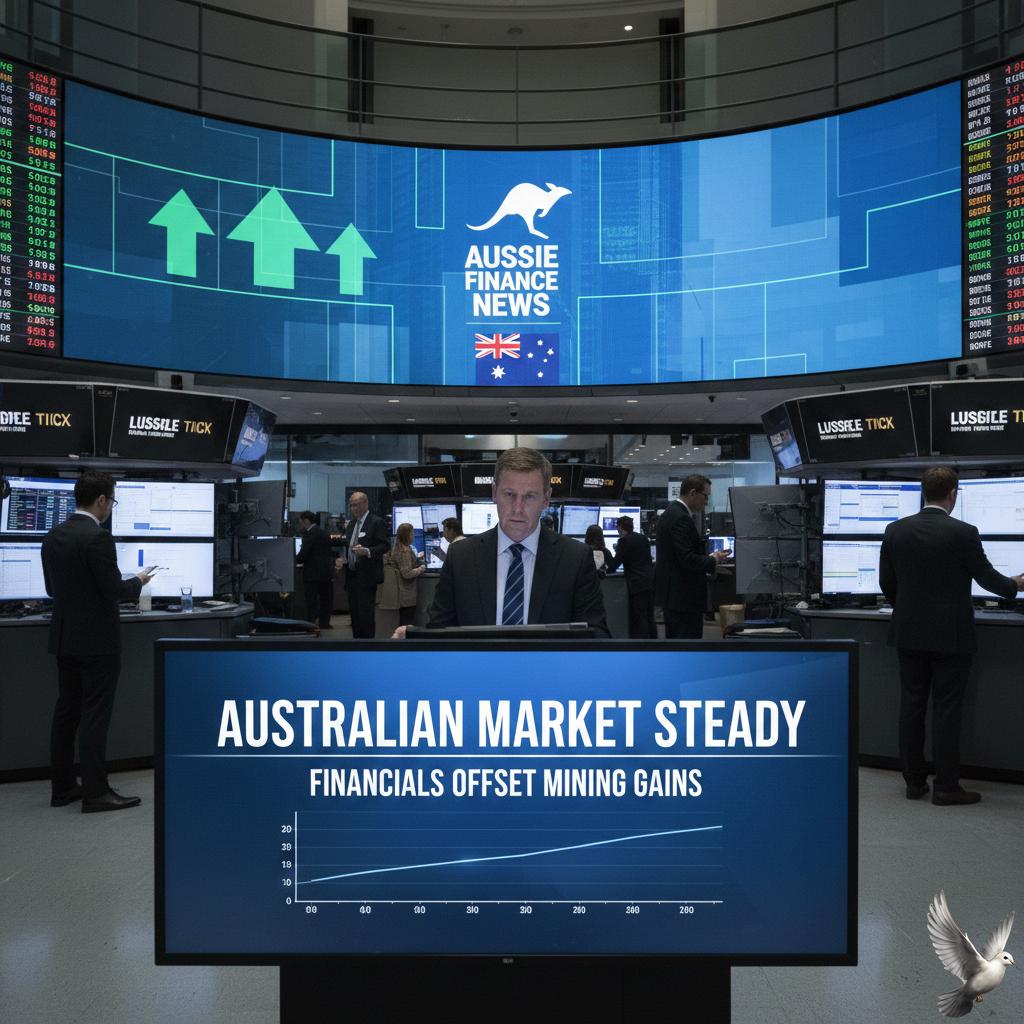
Australian Market Steady as Financials Offset Mining Gains
The Australian sharemarket experienced a flat finish on Tuesday, February 10, 2026, as the S&P/ASX 200 Index edged lower by just 2.7 points to close at 8,867.40. This sideways movement followed a volatile week where the market saw a $65 billion sell-off before staging a recovery. Financial sectors were the primary weight on the index, declining 1.1%. Major banks including CBA, Westpac, and ANZ retreated ahead of key half-year earnings reports. Cautious sentiment prevailed as the market adjusted to the Reserve Bank of Australia’s recent decision to hike the cash rate by 25 basis points to 3.85%, the first increase in two years. Insurance stocks faced significant selling pressure following the launch of a new AI-powered comparison tool by the U.S. firm Insurify. The app, which utilizes ChatGPT to automate rate comparisons, sparked fears of widespread industry disruption for traditional brokers. Steadfast Group plummeted 9.46% to $4.50, while Insurance Australia Group (IAG) and AUB Group fell 6.19% and 6.11% respectively. In contrast, the mining and materials sector provided a necessary buffer. Gold miners surged as the precious metal price extended gains above $5,000 an ounce, with Northern Star and Newmont leading the advance. Uranium producers also saw a sharp rebound; Boss Energy jumped 10.86% and Silex Systems rose 8.38% after brokers upgraded long-term price forecasts to $110/lb. Economic data released today added to the subdued mood, with the Westpac Consumer Confidence Index falling 2.6% to a ten-month low of 90.5. Household spending also dipped 0.4% in December, suggesting that the recent rate hike is beginning to impact discretionary consumption. The technology sector offered a bright spot as dip buyers returned to high-growth names. DroneShield gained 7.30% to $3.38, and Zip Co rose 6.07% to $2.62, tracking a recovery in the Nasdaq. Despite the heavy losses in insurance, ten of the eleven market sectors ended the day in positive territory, helping the broader index maintain its position near three-month highs.
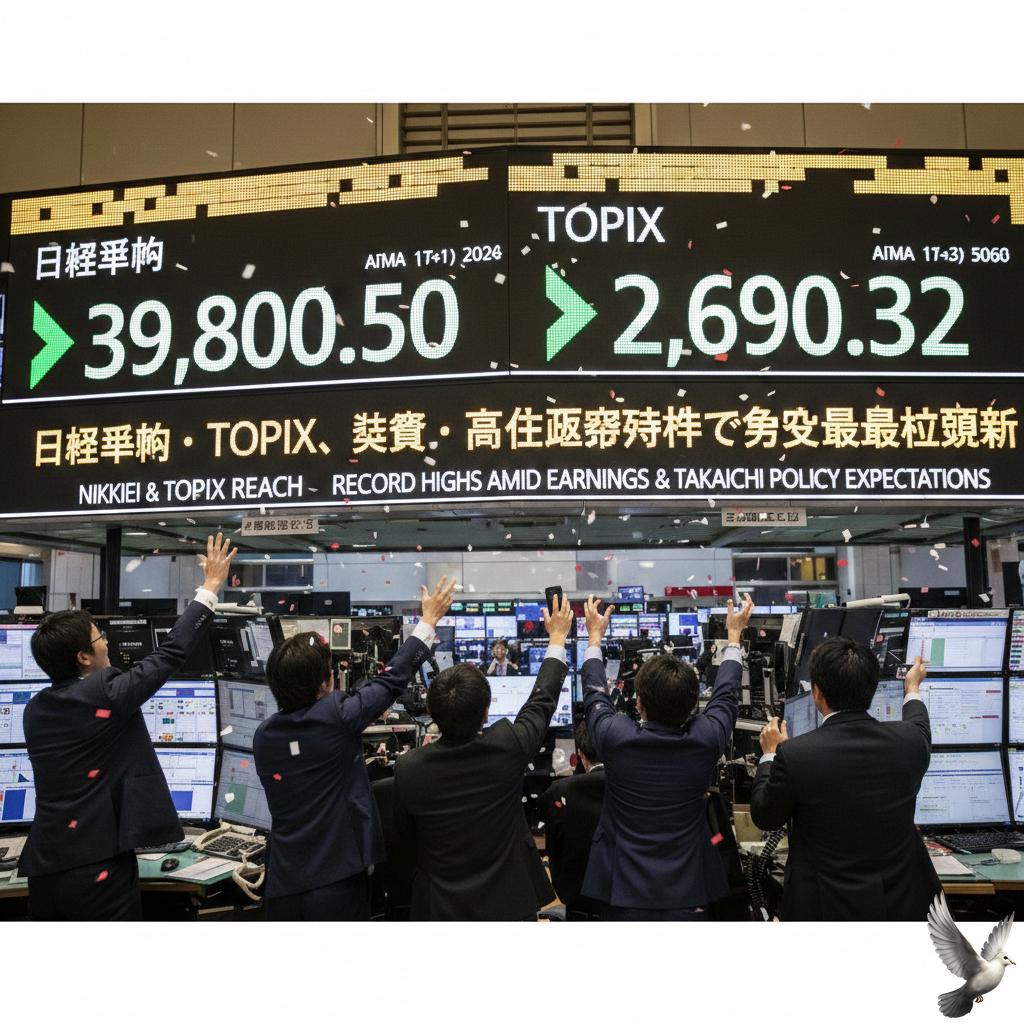
Nikkei and Topix Reach Record Highs Amid Earnings and Takaichi Policy Expectations
Japan's equity markets have surged to historic levels following a decisive political shift. The Nikkei 225 index closed at a new record high of 57,691 on Tuesday, marking a significant rally of 2.35% in a single session. The primary catalyst for this momentum is Prime Minister Sanae Takaichi’s landslide victory in the recent general election. Her Liberal Democratic Party (LDP) secured 316 of 465 seats, granting her a powerful two-thirds majority in the lower house. This "landslide mandate" has cleared the path for her expansionary economic agenda, popularly dubbed "Sanaenomics." Investors are pricing in aggressive fiscal stimulus. Key pledges include a high-profile plan to suspend the 8% consumption tax on food for two years—a move estimated to cost 5 trillion yen annually but designed to jumpstart domestic consumption. Market highlights from the latest session: - The Nikkei 225 hit an intraday peak of 58,030. - The broader Topix index climbed 1.4% to reach 3,836. - Technology and AI-linked stocks led the charge, with Advantest surging 11.5% and SoftBank Group gaining 6.9%. - The defense sector saw sharp gains on expectations of increased government spending. Beyond politics, robust corporate performance is providing a structural floor for the rally. Recent quarterly earnings have confirmed the resilience of Japanese exporters, aided by a yen that remains relatively weak. However, the outlook is not without tension. While stocks celebrate stimulus, the bond market is showing signs of caution. The Bank of Japan (BoJ) is facing pressure to normalize policy as inflation stays consistently above the 2% target. The central bank recently raised its key interest rate to a 30-year high of 0.75%. Markets are now bracing for a potential hawkish shift, with analysts speculating on another rate hike as early as April or June to counter the inflationary pressure of Takaichi’s spending plans. For now, the "Takaichi Boost" remains the dominant theme. The combination of political stability, tax relief promises, and strong tech earnings has repositioned Japan as a preferred destination for global risk assets. Investors are closely watching for the first formal budget of the new administration to see if these ambitious growth targets can be met without overstraining public finances.

SEBI Defers Entry of New Exchanges Into Options Segment: Report
The Securities and Exchange Board of India (SEBI) has maintained a firm stance on the expansion of trading platforms into high-risk segments. National Commodity and Derivatives Exchange (NCDEX) and Metropolitan Stock Exchange (MSE) are currently under regulatory directives to prioritize the development of their cash equity segments before venturing into new equity derivatives. SEBI’s primary concern is the growing disconnect between India’s booming derivatives volume and the underlying cash market liquidity. The regulator insists that a robust share-trading ecosystem must be established first to ensure market stability and prevent speculative bubbles. NCDEX Strategic Shift The National Commodity and Derivatives Exchange, traditionally a leader in agri-commodities, is pivoting toward a broader financial services model. The exchange recently raised **₹770 crore** from a high-profile group of investors, including founders of major retail brokerages and global trading firms. While NCDEX has secured in-principle approval to enter the equity space, SEBI's mandate requires a phased rollout. The exchange plans to launch a mutual fund distribution platform in the first half of **2026**, followed by cash equity trading. Only after demonstrating sufficient liquidity in these areas will it be permitted to introduce equity derivatives. MSE Resumption of Trading The Metropolitan Stock Exchange (MSE) is attempting a significant comeback to challenge the existing duopoly in the Indian market. Following a capital infusion of approximately **₹1,240 crore**, the exchange resumed live trading on **February 1, 2026**. To comply with SEBI’s liquidity requirements, MSE has introduced a Liquidity Enhancement Scheme (LES). This initiative utilizes market makers to provide continuous buy-sell quotes for an initial basket of **130 stocks**. The success of this cash-market depth is the prerequisite for scaling its derivatives offerings. Market Context and Risks SEBI's cautious approach comes as the regulator tightens rules across the board to protect retail investors. Key recent measures include: * **Removal of margin benefits** for single-stock derivatives on expiry days to curb excessive intraday leverage. * **Stricter eligibility criteria** for new index launches, requiring that **80%** of an index's weight come from stocks already active in the derivatives segment. * **Increased minimum contract values** to between **₹15 lakh** and **₹20 lakh** to ensure participants have adequate capital buffers. The regulator is also moving toward a unified trading framework, proposing to consolidate rules for equities, commodities, and derivatives into a single regulatory code by mid-**2026**. Forward Outlook The entry of NCDEX and the revival of MSE represent the most serious attempt in years to diversify India's exchange landscape. However, the path to equity derivatives remains gated by "liquidity milestones." Market participants are watching whether these exchanges can attract enough volume in the cash segment to satisfy SEBI’s "liquidity first" doctrine. For now, the focus remains on building a transparent, liquid base in the spot market before adding the complexity of futures and options.

Gold ETF Inflows Surpass Equity Funds Amid Record Market Rally
In a historic shift for the Indian financial markets, Gold Exchange-Traded Funds (ETFs) recorded massive net inflows of 24,040 crore in January 2026. This performance marks a 106% jump from the 11,647 crore seen in December, signaling a major transition in investor strategy toward safe-haven assets. For the first time, these gold-linked instruments have outpaced the entire equity mutual fund segment. While gold saw record-breaking participation, equity mutual fund inflows cooled by 14%, sliding to 24,029 crore as market volatility dampened risk appetite. The surge in gold and silver ETFs combined reached 33,500 crore for the month. Analysts attribute this momentum to the increasing financialization of precious metals in India, where investors are no longer viewing gold just as a hedge, but as a mainstream portfolio necessity. Domestic gold prices have reflected this heightened interest, characterized by significant volatility. As of February 10, 2026, 24K gold is trading near 157,910 per 10 grams in major hubs like Mumbai and Bangalore, while slightly higher in Chennai at 159,060. Although prices have eased slightly from the all-time peaks of late January, the underlying demand remains robust. Global factors are fueling this domestic trend. Geopolitical tensions, particularly in the Middle East, and concerns over trade policies have bolstered gold’s appeal. Additionally, expectations of further rate cuts by the US Federal Reserve and a weakening US dollar have made the non-yielding asset more attractive. The mutual fund industry as a whole remains resilient, with total Assets Under Management (AUM) expanding to 81.01 lakh crore in January. However, the cooling of equity momentum—specifically in flexicap and smallcap funds—contrasts sharply with the 50% growth in Gold ETF AUM. As the wedding season continues to support physical demand, institutional and retail interest in digital gold continues to climb. Investors are increasingly utilizing the recent price corrections as entry points, treating gold as a critical diversification tool amid global economic uncertainty.
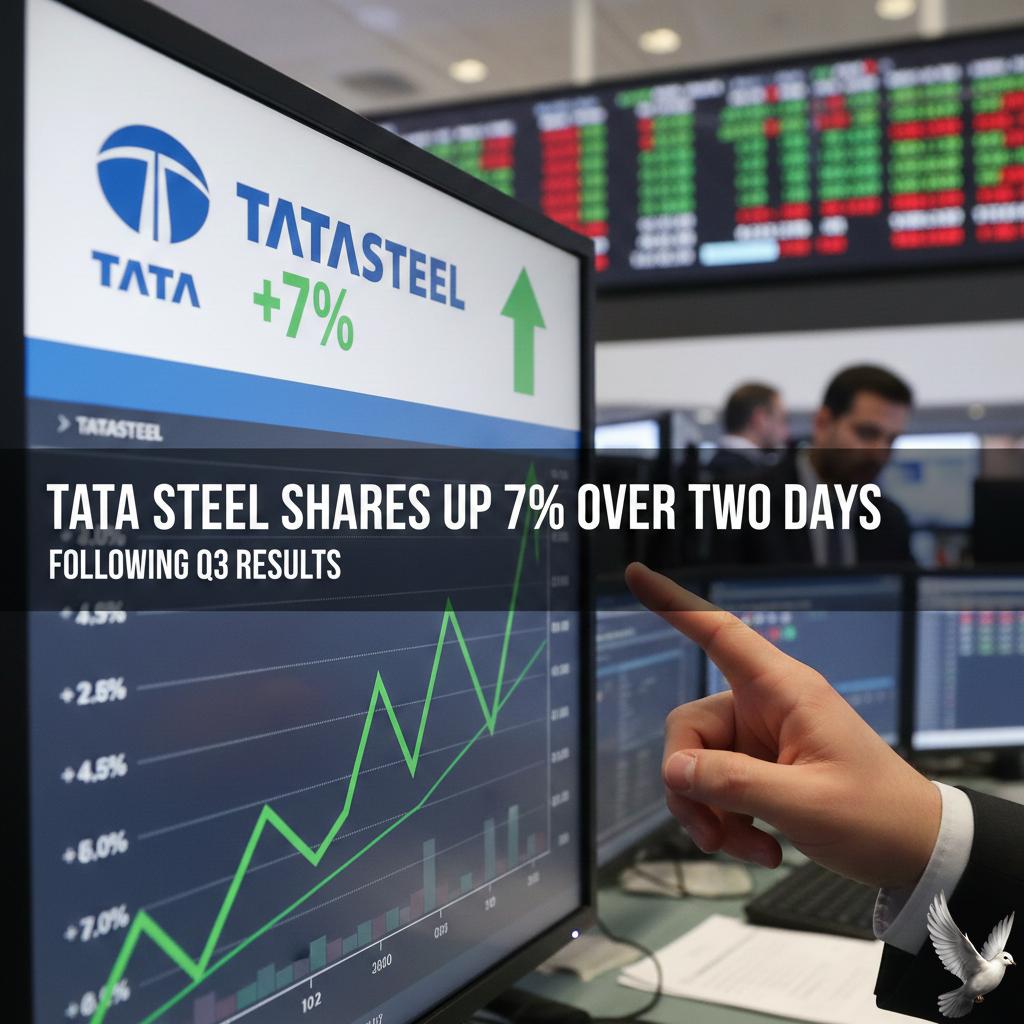
Tata Steel Shares Up 7% Over Two Days Following Q3 Results
Tata Steel shares reached a new 52-week high of 211.15 INR on February 10, 2026, marking a significant rally following the release of strong third-quarter financial results. The stock has gained nearly 6% over the last two trading sessions, consistently outperforming the broader Sensex and the ferrous metals sector. The company reported a massive 723% year-on-year surge in consolidated net profit, reaching 2,689 crore INR for the quarter ending December 2025. Consolidated revenue grew 6% to 57,002 crore INR, driven largely by record-breaking performance in the domestic market. For the first time in the company's history, quarterly deliveries in India surpassed the 6 million tonne milestone, hitting 6.04 million tonnes. While annual growth was explosive, sequential performance showed a slight cooling. Net profit declined 13% compared to the previous quarter, and revenue dipped 3%. This quarter-on-quarter softening is attributed to higher input costs and a 3% drop in the topline from the July-September period. The India business remains the primary engine of growth, maintaining a robust EBITDA margin of 23%. Crude steel production in India rose 12% to 6.34 million tonnes. Specific segments like automotive and special products saw their best-ever quarterly sales, growing 20% year-on-year. In contrast, European operations continue to face structural headwinds. The UK business reported an EBITDA loss of 63 million GBP, impacted by weak demand and high imports. However, Tata Steel is moving forward with its 1.25 billion GBP green steel transition at Port Talbot, with the UK government providing a 500 million GBP grant for a new electric arc furnace. The company has successfully prioritized debt reduction, cutting net debt by 5,206 crore INR during the quarter to bring the total to 81,834 crore INR. Group liquidity remains strong at 44,062 crore INR. Looking ahead, management expects further improvements in sales volumes and margins for the final quarter of the fiscal year. This outlook is supported by a 1.7% rise in the India Steel Composite Index in early February and new government protectionist measures, including a three-year import tariff on select steel products to curb competition from Chinese exports. [Tata Steel surges to record high](https://www.youtube.com/watch?v=dfCJojR-Fjo) This video provides a visual overview of the strategic transition and latest projects at Tata Steel's facilities. http://googleusercontent.com/youtube_content/0
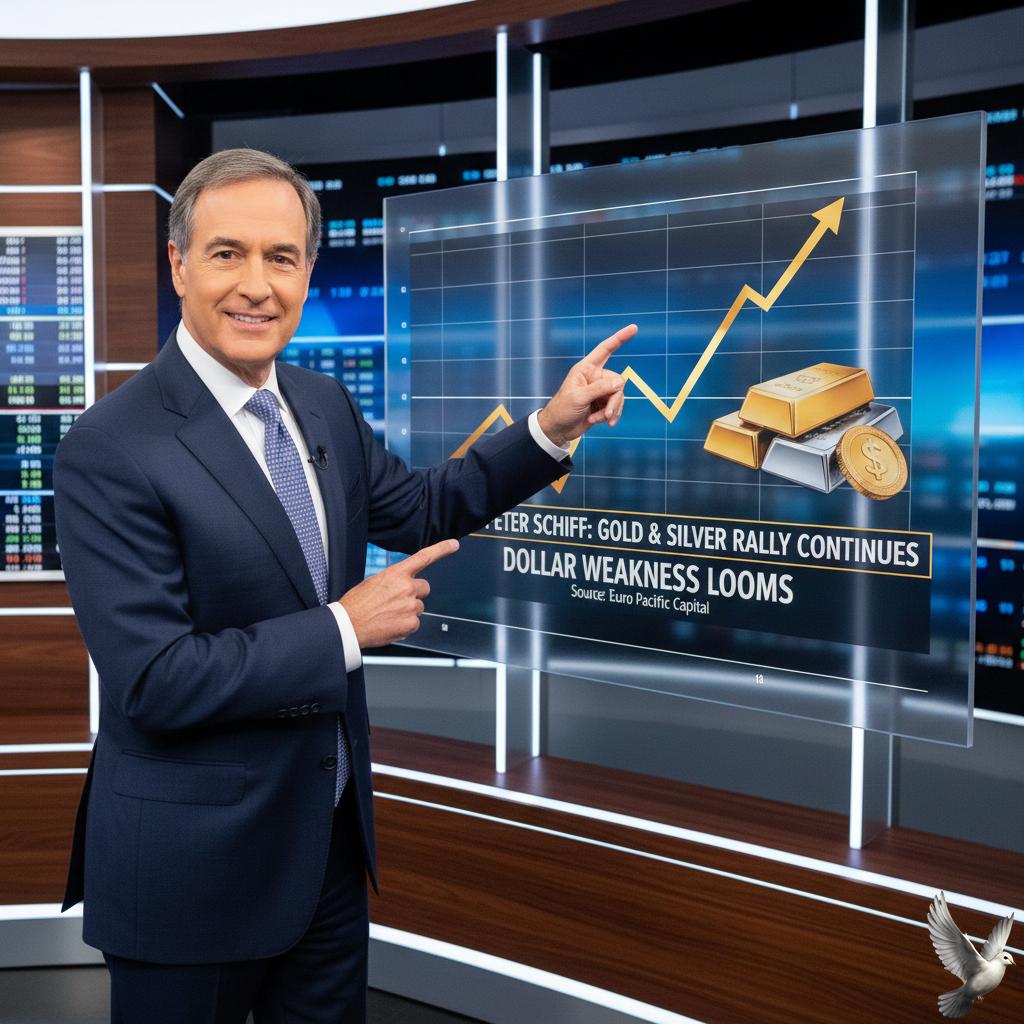
**Peter Schiff Projects Continued Gold and Silver Rally Amid Potential Dollar Weakness**
The precious metals market is currently navigating a period of intense volatility as global monetary trends shift. Gold has recently established a new high-water mark, briefly scaling a record **$5,594** per ounce on January 29, 2026, before entering a corrective phase. As of February 10, 2026, spot gold is trading near **$5,016** per ounce, while silver has seen sharper swings, recently moving back above **$80** per ounce after a significant pullback from its peaks. Investor Peter Schiff maintains a staunchly bullish outlook, suggesting these metals are far from their ultimate ceilings. Schiff argues that gold is not merely a commodity but a direct reflection of a collapsing currency system. He projects that gold could eventually soar toward **$6,000** in the near term and even reach **$100,000** in the event of a full-scale monetary reset. His thesis rests on the erosion of the U.S. dollar's purchasing power, driven by a national debt that has surpassed **$35 trillion**. The U.S. Dollar Index (DXY) has faced recent pressure, losing more than **1%** in early February to hold below the **97** level. This weakness is compounded by rising fiscal concerns and a gradual loss of confidence in central bank independence. Reports indicate that global institutions are actively diversifying away from dollar-denominated assets. For instance, Chinese regulators recently advised financial institutions to limit holdings of U.S. Treasuries to mitigate policy risks. Central banks continue to be a primary pillar of support for the gold market. In February alone, global central bank reserves rose by **24 tonnes**. The National Bank of Poland led this trend, marking its 11th consecutive month of net buying by adding **29 tonnes** to its holdings. Other nations, including China, Turkey, and India, remain consistent accumulators, viewing gold as the essential reserve asset to replace a weakening dollar. Silver remains a more volatile play, influenced heavily by speculative activity and industrial demand. While it remains roughly **60%** cheaper than gold on a relative historical basis, it has faced selling pressure following a surge that many analysts believe moved ahead of its fundamental value. Current market sentiment is also closely tied to the shifting leadership at the Federal Reserve, with the nomination of Kevin Warsh being viewed by some as a potential pivot toward a more hawkish, inflation-focused policy. Despite short-term price corrections, the underlying structural drivers remain intact. Rising interest on national debt, persistent inflation, and the "de-dollarization" of global reserves continue to push investors toward hard assets. While tactical rallies and profit-taking may cause near-term dips, the broader trend signals a strategic shift in global capital allocation toward precious metals as the ultimate hedge against fiscal instability. [Peter Schiff: The Gold and Silver Price Forecast](https://www.youtube.com/watch?v=43aDC6KA_Qs) This video provides an in-depth look at Peter Schiff's specific price targets and his reasoning behind the predicted surge in gold and silver values. http://googleusercontent.com/youtube_content/0

Bitcoin trades around $69,700 as market volume declines to $111 billion.
Market Brief: Digital Asset Volatility **February 10, 2026** The cryptocurrency market is currently navigating a period of heightened sensitivity as major assets struggle to maintain psychological support levels. Following a volatile start to the month, **Bitcoin** has slipped to **$69,334**, marking a **3.07%** decline over the last **24 hours**. This downward movement follows a brief recovery over the weekend where the asset had drifted just above **$71,000**. Trading volumes for Bitcoin have increased by **19%**, reaching approximately **$53.5 billion** as market participants react to the price dip. The current price action represents a consolidation phase after a tumultuous week that saw Bitcoin drop as low as **$60,000**, a level not seen since late **2024**. Sector Performance and Market Caps The broader market is mirroring Bitcoin’s defensive posture. **Ethereum** has underperformed the benchmark, dropping approximately **5%** to hold just above the **$2,000** mark. The **CoinDesk 20 Index**, a measure of the largest digital assets, has declined by **3.7%**. Total market liquidations have reached **$397 million** within a single **24-hour** window. These liquidations were split relatively evenly between long and short positions, indicating a highly leveraged and uncertain environment. Key technical heatmaps now highlight **$68,160** as the critical immediate support level to watch for Bitcoin. Institutional Sentiment and Flows Despite the immediate price pressure, institutional engagement remains a focal point for the recovery narrative. **Bitwise** reported single-day inflows exceeding **$100 million** during recent volatility, suggesting that large-scale buyers are viewing these sub-**$70,000** levels as entry points. However, U.S.-listed spot Bitcoin **ETPs** have faced headwinds, recording net outflows of roughly **$318 million** since the start of February. This divergence highlights a shift in sentiment among traditional finance participants who are increasingly treating digital assets as high-growth tech proxies rather than digital gold. Macroeconomic Drivers External factors are playing a significant role in current valuations. Global risk appetite has been dampened by a correction in major technology stocks and shifts in **U.S. Federal Reserve** expectations. Investors are closely monitoring upcoming **U.S. jobs data** and inflation reports, as these will likely dictate the next move for interest rates. Currently, the **10-year Treasury** yield sits at **4.20%**, and the persistent strength of the **U.S. Dollar** continues to create a challenging environment for non-yielding assets like cryptocurrencies. Derivatives and Positioning The derivatives landscape signals a "risk-off" shift among traders. **Bitcoin futures** open interest has contracted from **$19 billion** to **$16 billion** over the past week. This deleveraging process is reflected in funding rates, which have flipped to neutral-to-negative on major exchanges. Options data confirms this defensive stance, with a significant rise in demand for near-term protection. Implied volatility for front-end contracts has surged to **85.03%**, a sharp contrast to long-term expectations near **50%**. This backwardation suggests that traders are paying a high premium to hedge against further immediate price drops.
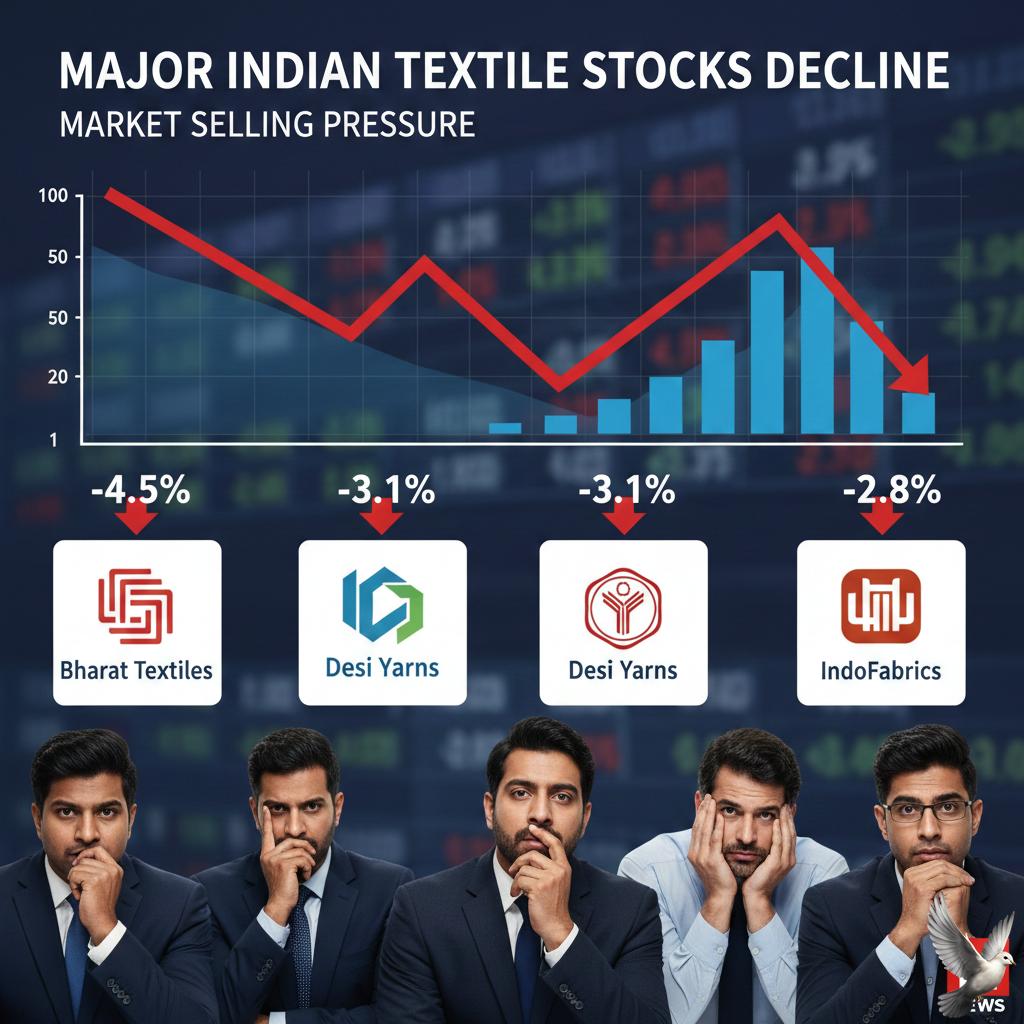
Major Indian Textile Stocks Decline Amid Market Selling Pressure
Indian Textile Market Update: February 10, 2026 Indian textile and apparel stocks experienced a sharp sell-off during Tuesday's trading session. The downturn followed the formalization of a landmark trade agreement between the United States and Bangladesh, which significantly alters the competitive landscape in the North American market. Market Reaction and Stock Performance Selling pressure intensified across the sector, with leading export-oriented companies witnessing declines between **3% and 6%**. * **Gokaldas Exports** led the losses, falling **6%** to hit a day low of **₹792**. * **Pearl Global Industries** dropped **6%** to **₹1,692**. * **Welspun Living** plummeted **5%** to **₹137**. * **KPR Mill** declined **4.5%**, reaching a session low of **₹935**. * **Nitin Spinners** and **Vardhman Textiles** both saw valuations erode by approximately **3%**. This correction follows a period of optimism where several of these stocks had gained up to **19%** over the past week due to India's own interim trade discussions with the U.S. The U.S.-Bangladesh Trade Pact The primary trigger for the sell-off is the "Agreement on Reciprocal Trade" signed between Washington and Dhaka. This deal provides a multi-layered advantage to Bangladeshi exporters that directly challenges Indian market share. Under the new terms, the U.S. has reduced the general reciprocal tariff on Bangladeshi goods to **19%**, down from a previous high of **37%**. More critically, the agreement establishes a mechanism for **0% duty-free access** on specific garments and textiles, provided they are manufactured using U.S.-sourced cotton or man-made fibers. In contrast, Indian textile exports currently face a reciprocal tariff of **18%**. While this is slightly lower than Bangladesh's general rate, the zero-duty exemption for U.S.-input products gives Bangladesh a decisive pricing edge in high-volume categories. Strategic Shifts and Outlook Analysts note that the deal creates a double-edged sword for the Indian industry. Beyond direct apparel competition, the agreement incentivizes Bangladesh to shift its raw material sourcing. By tying duty-free status to U.S. cotton, the pact may reduce Bangladesh's reliance on Indian cotton yarn and fiber. Bangladesh is currently one of the world's largest importers of cotton, and a shift toward U.S. suppliers could impact India's upstream spinning and ginning sectors. Despite the immediate market volatility, the Indian government continues to focus on long-term structural buffers. This includes the finalized Free Trade Agreement with the European Union, which aims to provide zero-duty access to a **$263.5 billion** import market, and the ongoing **₹10,683 crore** PLI scheme intended to boost domestic manufacturing scale. However, for the immediate term, investor sentiment remains cautious as the industry recalibrates for a more aggressive price war in the U.S. apparel segment, which remains India’s largest export destination.

Pfizer Shares Rise 9% on Q3 FY2026 Profit and Revenue Growth
Pfizer India shares witnessed a significant rally today, climbing over 9% to reach 5,209 INR following the announcement of robust financial results for the third quarter of fiscal year 2026. This surge is backed by a 20% year-on-year increase in operational revenue, which reached 645 crore INR, and an 11% rise in net profit to 141.8 crore INR. The company’s profitability was notably influenced by exceptional items totaling 58.20 crore INR. A primary component of these costs involves a strategic shift in the domestic business model. Pfizer has entered into a landmark 5-year exclusive agreement with Cipla for the marketing and distribution of key legacy brands, including Corex, Dolonex, and Neksium. This partnership aims to leverage Cipla’s extensive distribution network while allowing Pfizer to transition toward an asset-light commercial model. As part of this transition, the company recorded a one-time charge of 39.58 crore INR related to personnel separation costs for its field and marketing staff. Further financial impact was noted due to the nationwide implementation of new labor laws. Following the consolidation of regulations into four New Labour Codes, Pfizer revised its employee benefit provisions upward by 18.62 crore INR. This adjustment primarily stems from new wage definitions that affect gratuity and other social security liabilities. From a market perspective, Pfizer's market capitalization now stands at approximately 23,833 crore INR. The stock has delivered a 21% return over the past year, reflecting resilient investor confidence. Technical indicators show a strong bullish momentum, with the stock trading above all major simple moving averages. Institutional activity remains steady, as Foreign Portfolio Investors marginally increased their positions during the December quarter. While domestic mutual funds saw a slight reduction in holdings to 11.71%, analysts maintain a positive outlook on the stock's valuation, which currently trades at a Price-to-Earnings ratio of approximately 25.5. The broader pharmaceutical sector continues to show strength as multinational companies optimize their portfolios. By outsourcing high-cost promotional activities to local partners like Cipla, Pfizer is positioning itself to focus on high-value innovations and vaccines while maintaining the steady revenue streams of its established brands.
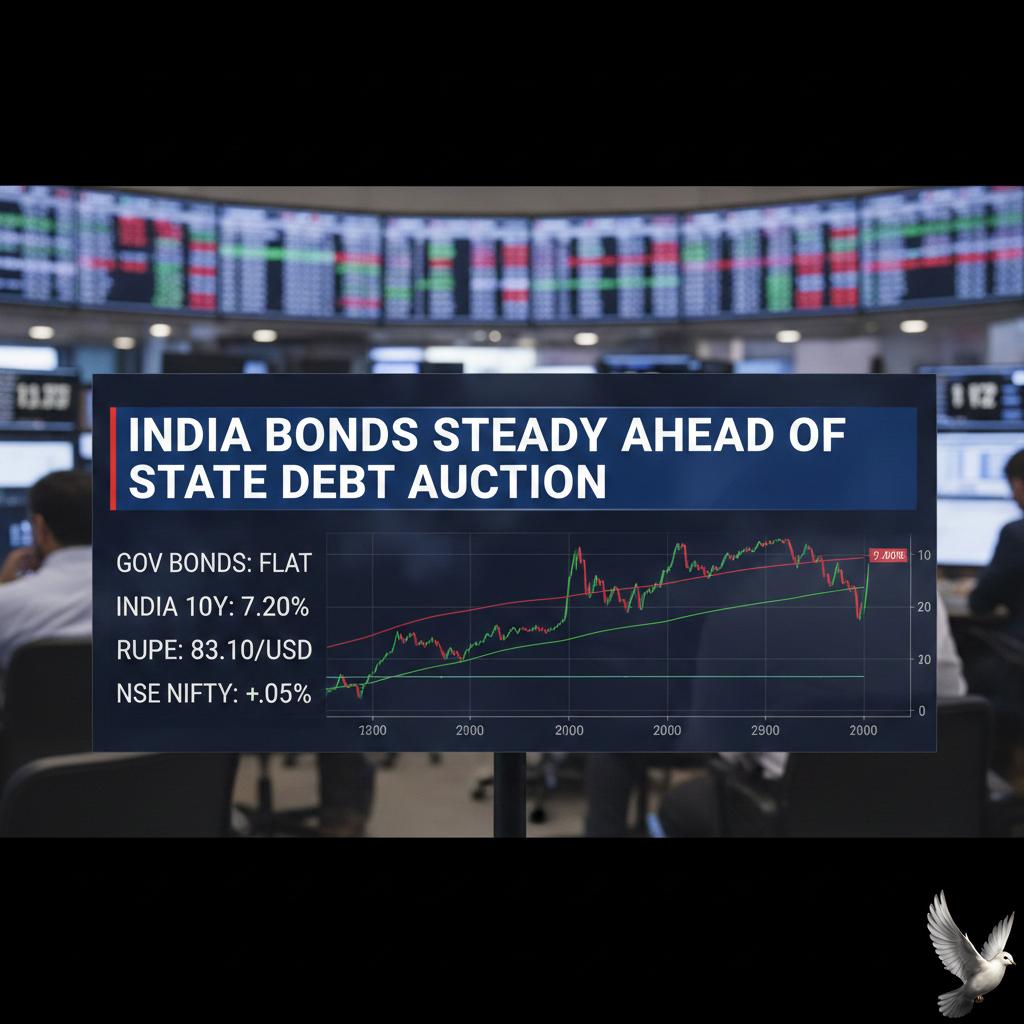
India Bonds Steady Ahead of State Debt Auction
Indian sovereign bonds have maintained a steady footing on Tuesday morning, with the market searching for a floor following a period of persistent selling pressure. Value buying has emerged at lower levels, yet overall sentiment remains fragile as investors balance attractive entry points against a heavy supply of fresh paper. The benchmark 10-year bond yield is currently hovering near **6.75%**, slightly lower than Monday's settle of **6.76%**. Despite this marginal easing, yields remain near one-year highs as the market continues to price in the government's expansive borrowing plans. The primary focus for today is a massive state debt auction. Indian states are scheduled to raise **486.15 billion rupees** through the sale of bonds, marking the largest weekly issuance of the current financial year. This figure is approximately **60 billion rupees** above the original schedule, intensifying fears that a crowded supply pipeline will continue to push borrowing costs upward. Recent policy updates from the Reserve Bank of India (RBI) have added to the cautious atmosphere. The central bank recently held the repo rate steady at **5.25%**, signaling a "neutral" stance that surprised some traders who had hoped for more aggressive liquidity support. While headline inflation for the fiscal year is projected at a benign **2.1%**, the market is wary of a potential uptick to **4.2%** by mid-2026. Liquidity conditions in the banking system remain a critical variable. While the system currently shows a surplus averaging **2.4 trillion rupees** this month, banks have shown reluctance in aggressive bond purchases due to a gap in deposit growth and ongoing interventions to stabilize the currency. The Indian rupee has shown resilience, trading near **90.35** against the US dollar. Support for the currency stems from a softer global dollar index and optimism surrounding a newly finalized India–US trade framework. This stability in the forex market provides some relief to bond investors, though the overarching concern remains the absorption of the **17.2 trillion rupee** gross borrowing target set for the upcoming fiscal year. In the derivatives market, the one-year Overnight Index Swap (OIS) rate has eased to **5.50%**, reflecting the high levels of system liquidity. However, long-duration funds and gilt indices have seen recent declines of over **0.60%** in single sessions, highlighting the volatility faced by investors in the current high-yield environment.

Amnish Aggarwal’s Market Outlook and Stock Recommendations Amid Volatility
Market Outlook: Growth and Value Recovery Indian equity markets are showing significant resilience as of February 2026. The **Nifty 50** recently crossed the **25,800** mark, supported by strong domestic liquidity and a shift in interest toward sectors offering long-term stability. Pharmaceutical Sector: The Value Play The pharmaceutical industry is benefiting from a blend of government support and attractive valuations. The **Union Budget 2026-27** recently introduced the **Biopharma SHAKTI** initiative, aimed at scaling domestic manufacturing. **Sun Pharma** remains a core focus for investors, currently trading at approximately **₹1,704**. With a market capitalization exceeding **₹4 lakh crore**, it continues to dominate the domestic oncology and generic segments. Multinational corporations are also witnessing a revival. **GlaxoSmithKline (GSK) Pharmaceuticals** reported a robust **28.6%** jump in net profit to **₹295.6 crore** for the December quarter. **Pfizer India**, trading near **₹4,590**, maintains a steady outlook as analysts highlight its strong cash reserves and dividend potential. Speciality Chemicals: Patience for the Bottom The speciality chemicals sector is navigating a prolonged global downcycle, with production growth forecasts moderated to **2%** for 2026. However, India is positioned as a bright spot, with domestic chemical production projected to grow by **10.9%** this year. Earnings for the quarter have been mixed. For instance, **DCW Limited** expects a slight revenue increase to **₹474 crore**, though overall margins in the sector remain under pressure due to global overcapacity. Investors are advised to focus on high-margin segments like **fluorochemicals** and **agrochemicals**, which are seeing better demand recovery. Exchange Services: Record-Breaking Performance Exchange-traded services are currently the standout performers in the financial sector. **BSE Limited** shares hit an all-time high of **₹3,188** on February 10, 2026, following an exceptional earnings report. The exchange recorded a **174%** surge in consolidated net profit, reaching **₹602 crore**. This growth is driven by a massive increase in equity derivatives trading and new listings. Market sentiment is also being shaped by the primary market, with high-profile IPOs like **Fractal Analytics** (seeking **₹2,833 crore**) currently open for subscription. Meanwhile, the eventual listing of the **NSE** remains a key thematic trigger for the broader financial services category.

UBS Raises BSE Price Target to Rs 3,650 Following Record 7% Rally
BSE Limited shares reached an unprecedented all-time high on February 10, 2026, surging 6.81% during intraday trading to hit a record level of 3,188.40. This rally follows the release of exceptionally strong financial results for the October-December quarter, which exceeded market expectations across all primary metrics. The exchange reported a massive 174% year-on-year jump in consolidated net profit, reaching 602 crore. Revenue from operations climbed 62% to 1,244.1 crore, marking the company’s 11th consecutive quarter of record growth. This performance was largely propelled by an 86% rise in transaction charges, which contributed 952 crore to the top line. Equity derivatives continue to be the primary engine of growth. The average daily notional turnover in the options segment doubled to 210 lakh crore compared to the previous year. Consequently, options-related revenue surged 122% to 784 crore, demonstrating BSE’s successful expansion in a segment once dominated by its primary competitor. The financial strength of the exchange is further highlighted by its operating EBITDA, which rose to 732 crore. Despite a 40% increase in total expenses—driven largely by a 90% rise in regulatory contributions—operational efficiency remained high. The exchange also saw 99 new equity listings during the quarter, reinforcing its position as a hub for SME and mainboard activity. Analyst sentiment remains divided despite the record numbers. UBS and Nuvama maintain a bullish outlook, citing consistent market share gains and the massive scale of the StAR MF platform. Conversely, Jefferies remains cautious with a 'Hold' rating, pointing to the structural risks associated with a high reliance on weekly options and a heavy regulatory environment. Market participants are also closely monitoring the impact of the Union Budget 2026, which implemented a significant hike in the Securities Transaction Tax. STT on futures was increased to 0.05% from 0.02%, while options tax rose to 0.15% from 0.01%. While this initially triggered a 15% sell-off in early February, the current earnings momentum has largely offset those concerns. Management maintains an optimistic stance, suggesting that the platform's technological depth and product innovation will sustain growth. With a price-to-earnings growth ratio of 0.6, the exchange continues to attract institutional interest as it balances higher transaction costs with record-breaking volume expansion.

Four Sectors Showing Growth Potential Following SBI Rally: Market Outlook and Analysis
State Bank of India (SBI) has solidified its position as a market powerhouse, recently hitting a fresh all-time high of ₹1,154. As of February 2026, the banking giant commands a massive market capitalization exceeding ₹10.4 trillion. This rally is backed by record-breaking financial health, with quarterly profits surging over 24% to hit ₹21,028 crore. The bank has revised its loan growth guidance upward to a range of 13% to 15%. This optimism is fueled by a robust credit environment and a digital transformation led by the Yono platform, which now serves nearly 100 million customers. With a low net non-performing asset (NPA) ratio of 1.57%, the lender’s balance sheet remains one of the cleanest in the industry. Opportunities in the jewellery sector are expanding rapidly, with Kalyan Jewellers leading the charge. The company recently reported a staggering 90% growth in quarterly net profit, reaching ₹416 crore. Revenue jumped 42% to exceed ₹10,343 crore, driven by a hyperlocal strategy where non-south markets now contribute nearly 59% of total Indian revenue. Real estate is entering a more mature and disciplined growth phase. While the post-pandemic frenzy has stabilized, residential demand remains resilient with a shift toward luxury and premium segments. Cities like Mumbai and Hyderabad continue to lead in volume, while premium home prices have seen a 30% to 40% rise over the last three years. The sector is increasingly institutionalized, with commercial leasing expected to grow by 15% to 18% this year. Small finance banks are carving out significant value despite facing margin pressures. Loan growth for the sector is projected at 18% to 20% for 2026. Lenders are strategically shifting toward secured assets to manage risk, even as they navigate higher funding costs. AU Small Finance Bank’s recent move toward becoming a universal bank marks a major milestone for the segment's evolution. Consumption growth is no longer confined to major metros. A "Bharat surge" is underway, with Tier II and Tier III cities now driving 45% of the demand for international brands. High-growth hubs like Jaipur, Lucknow, and Kochi are witnessing a 22% compound annual growth rate in lifestyle segments. This decentralization of wealth is supported by improved infrastructure and a rising middle class that now allocates nearly 29% of family income to fashion and lifestyle products. [SBI Performance Analysis](https://www.google.com/search?q=https://www.youtube.com/watch%3Fv%3DN80-v_QitwI) This video provides a detailed breakdown of the recent surge in SBI shares and the underlying financial metrics driving the banking sector's momentum.
Small-cap Stocks Gain Up to 28% in 2026 Amid Narrow Market Breadth
Smallcap stocks are staging a definitive recovery following a stagnant **2025**, as investors pivot toward attractive valuations and a shifting geopolitical landscape. As of **February 10, 2026**, the broader market shows renewed vigor, with the **NIFTY Smallcap 100** and **S&P BSE Small-Cap** indices leading the charge. The **NIFTY Smallcap 100** has demonstrated significant momentum, outperforming frontline gauges with a **0.55%** rise today, building on a massive **2.65%** surge in the previous session. Market breadth has shifted toward a bullish stance, with over **2,500** shares advancing on the BSE against approximately **1,100** declines. Trade Deal De-escalation A major catalyst for this "risk-on" environment is the **India-US Interim Trade Agreement (ITA)**, effective as of **February 7, 2026**. This deal has drastically reduced trade uncertainty, a primary headwind throughout the prior year. Key highlights of the agreement include: * US tariffs on select Indian goods slashed from **50%** down to **18%**. * Full removal of the **25%** punitive duty previously linked to Russian oil purchases. * Zero-duty access for high-value exports including gems, jewelry, and pharmaceuticals. Sector Performance and Earnings The rollback of tariffs has sparked a relief rally in export-oriented smallcaps. Textile, leather, and specialty chemical stocks have seen sharp gains. Meanwhile, internal corporate health is improving; median valuations for smallcaps have corrected to roughly **20x** trailing earnings, aligning them closer to historical norms after the **2025** compression. Corporate earnings growth for the current cycle is projected in the **12–15%** range. This acceleration is supported by a revival in private capital expenditure, which saw a **13.1%** year-on-year rise in fixed assets during the first half of the fiscal year. Foreign and Domestic Flows Institutional participation is reinforcing the uptrend. Foreign Portfolio Investors (FPIs) turned net buyers, injecting **2,255 crore** into the market in recent sessions. This inflow, coupled with double-digit returns from specific smallcap constituents, suggests that the prolonged bear phase for the segment is concluding. While the "Trump Tariff" threats dominated headlines in late **2025**, the transition to a rules-based framework under the ITA has provided the clarity necessary for steady valuation expansion. Markets are now focusing on bottom-up stock selection as earnings visibility improves across the manufacturing and technology sectors.
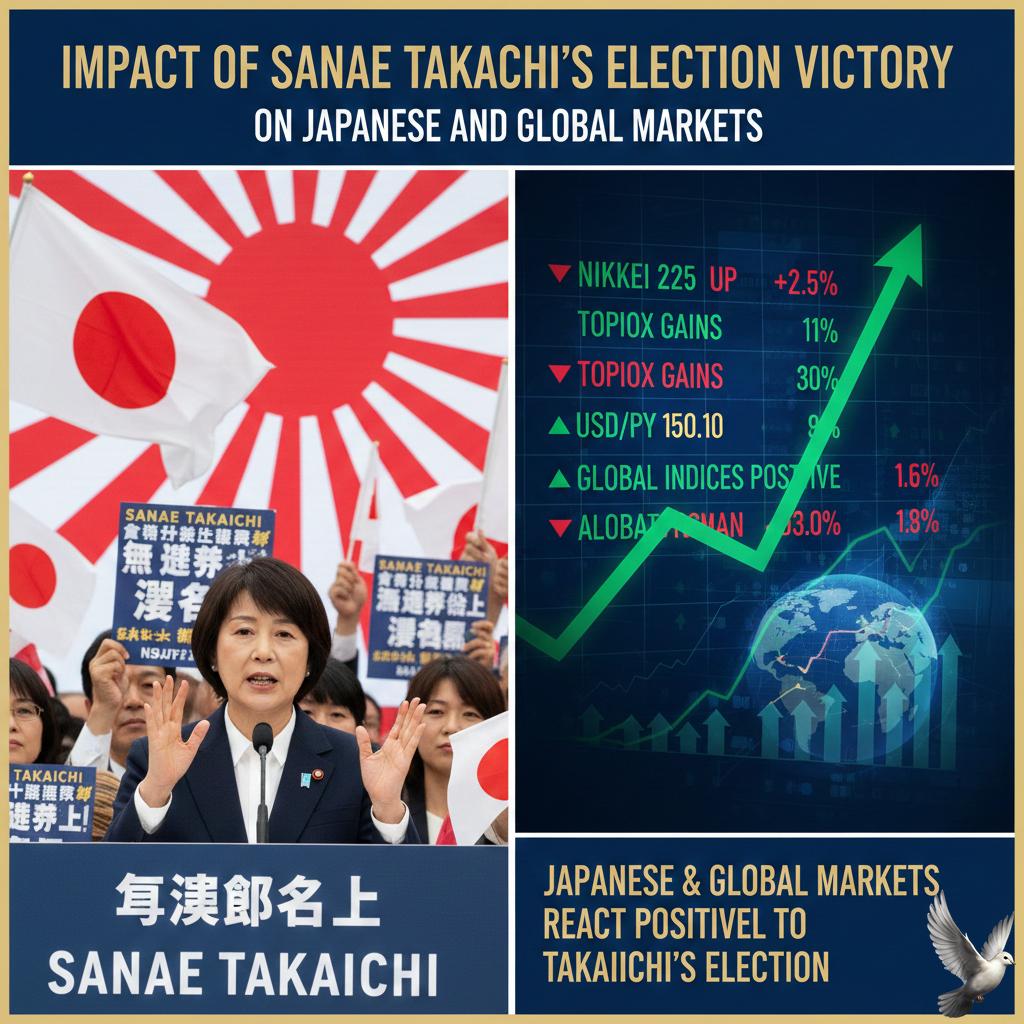
Impact of Sanae Takaichi’s Election Victory on Japanese and Global Markets
Sanae Takaichi’s landslide election victory on February 8, 2026, has triggered a historic rally in Japanese equities, with the Nikkei 225 surging past the 57,000 mark for the first time. The Liberal Democratic Party’s two-thirds majority—securing 316 of 465 seats—has provided a clear mandate for a "pro-growth" agenda, centering on expansionary fiscal spending and strategic investments in semiconductors, defense, and artificial intelligence. On Monday, February 9, the Nikkei 225 closed at a record high of 56,363.94, a one-day gain of 3.9%. This rally reflects investor optimism regarding Takaichi’s proposed ¥21.3 trillion stimulus package and a potential two-year suspension of the 8% consumption tax on food. While these measures aim to boost domestic consumption and combat the rising cost of living, they have introduced significant volatility into the currency and debt markets. The Japanese yen experienced sharp fluctuations following the results, initially weakening to a two-week low before stabilizing near 155.66 against the U.S. dollar. Traders are closely monitoring the "Takaichi trade," weighing the benefits of fiscal stimulus against the risks of a further sell-off in the yen, which continues to drive up import costs. Bond markets remain a primary point of concern. Yields on 10-year Japanese Government Bonds (JGBs) climbed to 2.28% as of February 10, while 30-year yields reached 3.55%. Markets are pricing in the reality of Japan’s debt burden, which currently stands at more than twice its GDP. Analysts warn that if the administration pursues aggressive debt-fueled spending without clear funding sources, the resulting upward pressure on interest rates could threaten fiscal stability. The Bank of Japan is navigating a delicate policy normalization phase. The central bank raised its policy rate to 0.75% in December 2025 and is expected to continue semi-annual hikes, potentially reaching 1.0% by July 2026. This shift toward higher rates is part of a broader move to achieve sustainable 2% inflation, though it complicates the government's ability to service its massive debt. Market sentiment is currently split between the short-term boost to corporate earnings and the long-term sustainability of the nation's finances. While sectors like defense, machinery, and technology are seeing immediate gains, the persistent rise in JGB yields suggests that the market will continue to act as a check on the administration's fiscal ambitions. [Japanese Market Update: Takaichi Victory Impact](https://www.youtube.com/watch?v=S8xWeDpUIjY) This video provides an expert analysis of the recent selloff in the Japanese bond market and the implications of Prime Minister Takaichi's fiscal policies on future yields. http://googleusercontent.com/youtube_content/0