Bullish News
Collection
Sanofi Consumer Healthcare Shares Rise 14% on Q4 Profit Growth and Dividend Declaration
Sanofi Consumer Healthcare India (SCHIL) shares experienced a powerful rally today, surging over 14% to reach an intraday high of ₹4,586 on the BSE. This bullish momentum follows the release of exceptional financial results for the fourth quarter and full year ending December 31, 2025. The company reported a 50% year-on-year increase in net profit for the December quarter, reaching ₹66.5 crore. Revenue for the same period saw a dramatic 47% jump to ₹251 crore. These figures mark a significant turnaround for the entity, which only recently emerged as a standalone listed company following its demerger from Sanofi India. A key driver of this growth was the successful relaunch of products that had previously faced voluntary recalls in the domestic market. Domestic sales grew by a healthy 23% in the final quarter, while export revenue surged more than 9 times over a low base from the previous year. For the full financial year 2025, the company’s performance was equally robust: - Total revenue rose 21% to ₹878.4 crore. - Net profit increased by 33% to ₹240 crore. - Basic Earnings Per Share (EPS) climbed to ₹104.27, up from ₹78.59. In a move to reward shareholders, the board has recommended a final dividend of ₹75 per equity share. When combined with previous interim payouts, the total dividend for the 2025 fiscal year reached ₹123 per share, highlighting the company’s strong cash position and commitment to investor returns. Management attributed the results to disciplined cost management, a better product mix, and sustained investment in core brands like Allegra, Avil, and Combiflam. The company also maintained an almost debt-free balance sheet and improved its operational efficiency, reducing its working capital cycle significantly. While the consumer healthcare arm soared, its former parent entity, Sanofi India, faced a different trajectory, with its share price slipping roughly 4.5% following a 32% decline in its own quarterly net profit. Market observers are now monitoring the impact of new Indian labor codes and changes in the global parent structure. Sanofi recently completed a 50% stake sale of its global consumer health business, Opella, to private equity firm CD&R, a move that may influence the strategic direction of the Indian subsidiary in the coming years.
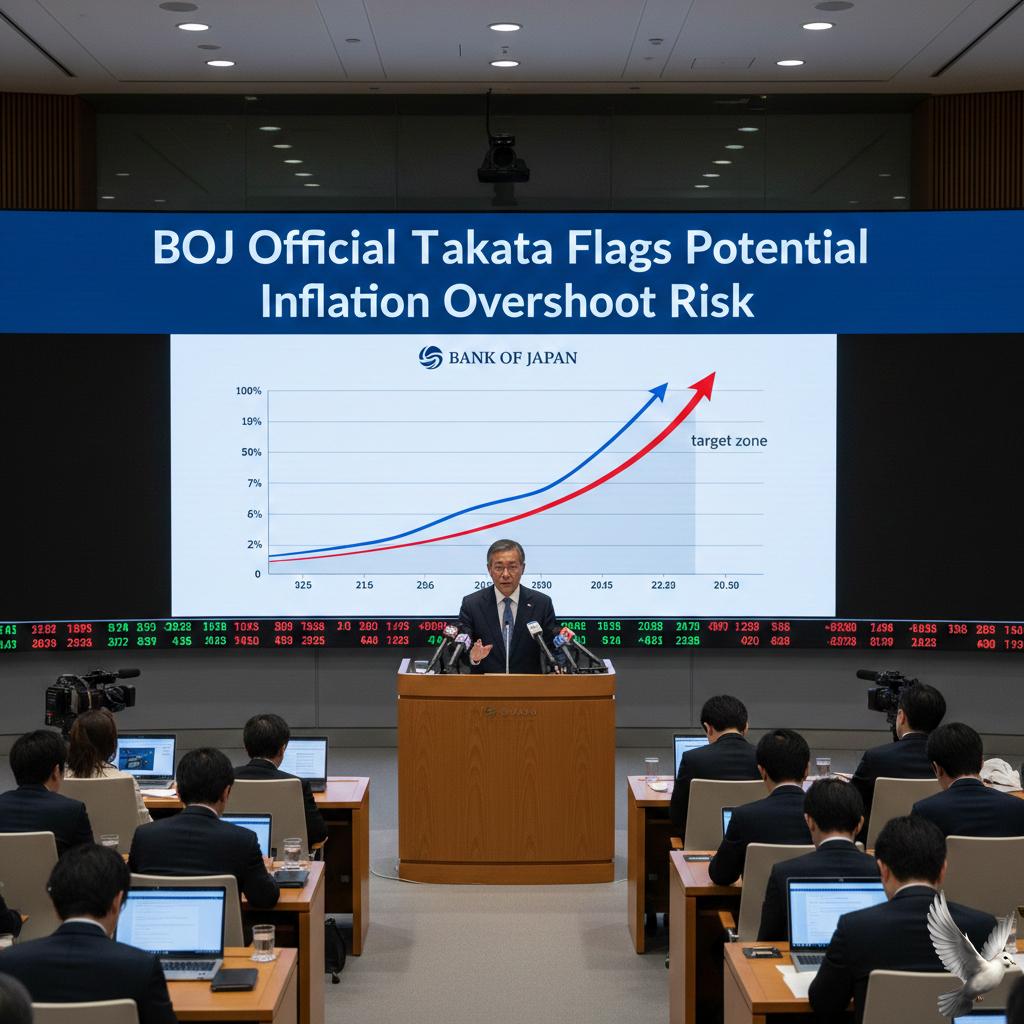
BOJ Official Takata Flags Potential Inflation Overshoot Risk
The Bank of Japan is currently navigating a pivotal transition as board member Hajime Takata intensifies calls for a shift in monetary strategy. Speaking in Kyoto on February 26, 2026, Takata emphasized that the era of fighting deflation has ended. He is now urging the central bank to prioritize preventing an inflation overshoot, advocating for a steady and gradual increase in interest rates. Takata maintains that Japan has successfully met its 2.0% inflation target. He noted that the economy has fully emerged from a decades-long period of stagnation. Despite these hawkish leanings, the broader board remains divided. In January 2026, the BOJ held its short-term policy rate steady at 0.75%, rejecting Takata’s proposal to hike the rate to 1.0%. Current economic data reflects a cooling trend in consumer prices. Japan's annual inflation rate eased to 1.5% in January 2026, down from 2.1% in December. This represents the lowest level since early 2022. Similarly, core inflation—which excludes fresh food—slipped to 2.0%, aligning exactly with the central bank’s long-term target. While inflation is moderating, the "virtuous cycle" of wages and prices is gaining momentum. Major labor unions are pursuing wage increases exceeding 5.0% for the third consecutive year. This persistent upward pressure on personnel expenses is expected to make underlying inflation more "sticky," potentially keeping core CPI near the 2.0% mark throughout 2026. Global factors are also playing a significant role in the BOJ’s internal debate. Takata highlighted that massive global fiscal stimulus and the ongoing boom in artificial intelligence could push up international growth, further pressuring Japanese domestic prices. However, the political landscape introduces new variables. Prime Minister Sanae Takaichi recently nominated two reflation-leaning academics to the BOJ board, signaling a preference for more cautious policy tightening. Financial markets have reacted sharply to these conflicting signals. The Nikkei 225 Index hit a fresh record high, surging above 59,000 on February 26, 2026. This rally was fueled by fading expectations of an immediate rate hike following the government's dovish board nominations. In the currency markets, the Yen has faced renewed downward pressure. The USD/JPY pair recently tested resistance near 156.25 as traders pushed back the timing for the next rate increase. While a hike in March is now seen as unlikely, with probabilities dropping below 10%, many analysts still expect the BOJ to adjust rates toward 1.2% or higher by the end of the year if the wage-price spiral remains intact. The central bank now faces a delicate balancing act. It must weigh the hawkish warnings of an inflation overshoot against a government that favors looser policy to support moderate GDP growth, which is projected at roughly 0.9% for fiscal 2026. This recalibration is expected to have lasting effects on global liquidity and the carry trade as Japan moves toward a more normalized interest rate environment.
Rupee gains 6 paise to 90.85 against US dollar in early trade
Market Brief: Rupee & Equity Update **February 26, 2026** The Indian Rupee showed resilience in Thursday's early session, strengthening by **10 paise** to reach **90.81** against the US Dollar. This movement follows a period of consolidation and reflects a cautious yet positive shift in local currency sentiment. A primary driver for the Rupee's gain is the cooling of the US Dollar index. Recent data, including stronger-than-expected corporate earnings in the US, has buoyed global risk appetite, leading to a marginal softening of the greenback across Asian markets. Capital Flows and Institutional Activity Foreign Institutional Investors (FIIs) have maintained a steady presence, providing essential support to the local unit. On February 25, FIIs were net buyers in the cash segment with an inflow of **₹2,991.64 crore**. Domestic Institutional Investors (DIIs) further bolstered this trend, recording a significant net purchase of **₹5,118.57 crore**. This synchronized buying activity highlights robust internal confidence in the Indian economy's trajectory for the 2026 fiscal year. Domestic Equity Performance The domestic equity markets opened on a firm note, with benchmark indices trading in green. The **NSE Nifty 50** surpassed the **25,500** mark, gaining approximately **0.29%** in early trades. The **BSE Sensex** rose by over **140 points**, trading near the **82,418** level. Market leadership is currently driven by the IT and Banking sectors. Specifically, the Nifty IT index outperformed with a nearly **1%** jump, ending a five-day losing streak. External Pressures and Commodity Trends Despite the local gains, global variables continue to act as a ceiling for the Rupee. Brent crude oil prices have edged up to approximately **$71.04** per barrel. Investors are closely monitoring the upcoming nuclear talks in Geneva. Geopolitical uncertainties and the potential for supply disruptions in the Middle East maintain a "risk premium" on energy prices, which typically puts pressure on the Indian trade deficit. Economic Outlook The broader economic backdrop remains supportive. India's GDP growth for FY26 is projected at **7.4%**, backed by a historic low inflation average of **1.7%** in the previous quarters. With foreign exchange reserves standing robust at over **$701 billion**, the Reserve Bank of India possesses significant buffers to manage currency volatility. While the immediate outlook for the Rupee is positive, it remains sensitive to fluctuations in global energy markets and US interest rate signals.
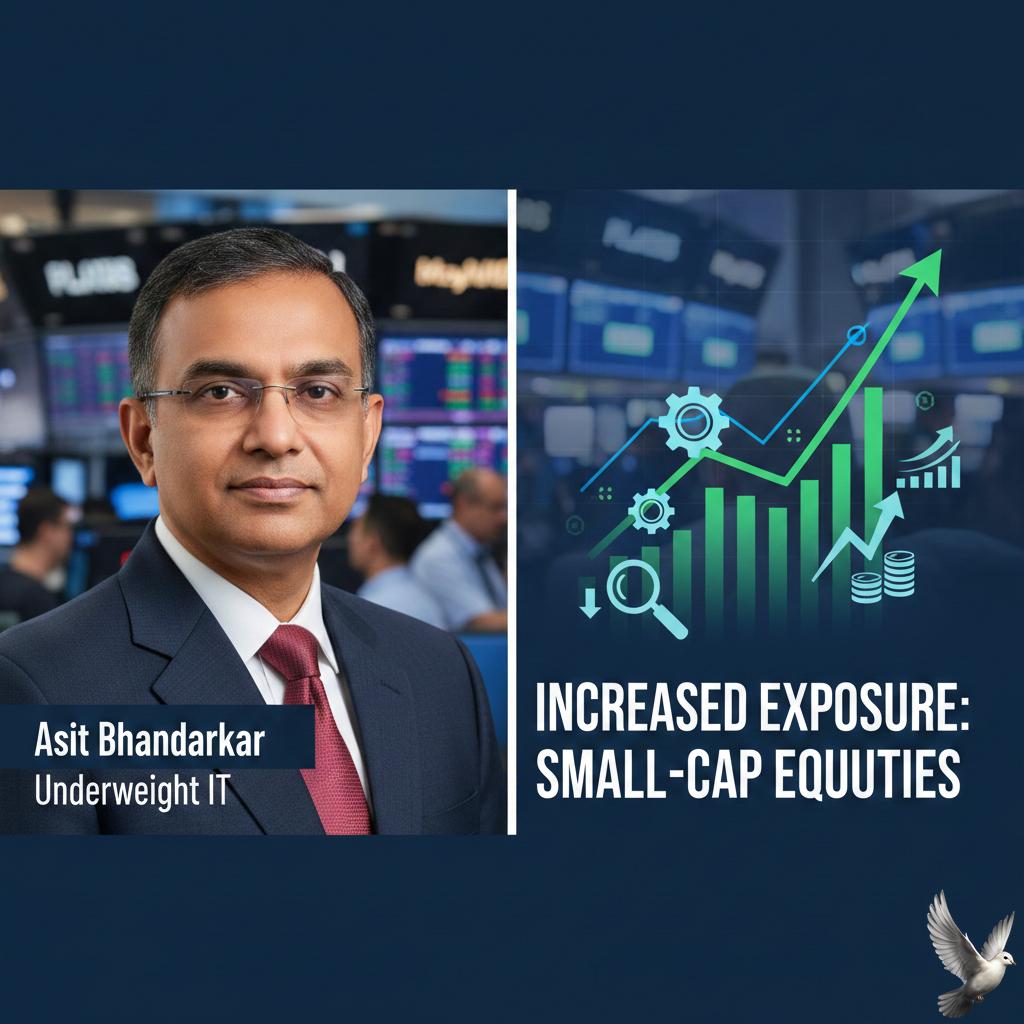
Asit Bhandarkar Maintains Underweight Stance on IT and Increases Exposure to Small-Cap Equities
Market Brief: Strategic Rebalancing in Indian Equities The Indian equity market is currently navigating a period of disciplined recalibration. As of February 2026, the **Nifty 50** is trading near **22.6 times** trailing earnings, while market targets for the index sit at approximately **29,000** for the year-end. This represents a projected upside of roughly **11%**, driven primarily by corporate earnings growth rather than valuation expansion. IT Sector: Disciplined Underweight The Information Technology sector remains under pressure due to global revenue deflation and shifting tech expenditure. Expert sentiment from JM Financial Mutual Fund suggests a **slight underweight** position rather than a complete exit. Many large-cap IT entities are now trading at discounts to their **5-year and 10-year** historical benchmarks. While macro headwinds persist, the sector’s solid cash flows provide a safety net, making current price levels unattractive for selling. The strategy focuses on patience as management teams restructure to adapt to the 2026 economic environment. Smallcap Momentum and Recovery Smallcap stocks have emerged as the primary growth engine for the current fiscal year. Recent data shows the smallcap segment leading the market with **22% year-on-year** earnings growth in the most recent quarter. This significantly outpaces the **14%** growth seen in large-caps and **15%** in mid-caps. Following a period of correction where the smallcap index declined roughly **8-9%** in early 2026, valuations have reset to more sustainable levels. The **Nifty Smallcap 250** price-to-earnings multiple has moderated to **26.5**, down from previous highs exceeding **32**. This reset, combined with strong bottom-up earnings momentum, presents a compelling entry window for disciplined stock selection. Macro Indicators and Liquidity The broader domestic economy remains resilient with a **7.4% GDP growth** forecast for FY2026. Monetary policy has turned supportive, with the RBI maintaining a neutral stance after reducing the repo rate to **5.25%**. While Foreign Institutional Investors (FIIs) recorded net outflows of **₹3.1 trillion** year-to-date, domestic liquidity remains a pillar of strength. Monthly SIP inflows have remained steady at approximately **₹294 billion**, providing a consistent cushion against global volatility. Investors are encouraged to prioritize companies with clear earnings visibility over speculative sector rotation, particularly within the rebounding smallcap space.

Resilient Indian IT Stocks: Emerging Themes Following the AI Sector Correction
Indian IT stocks have entered a period of intense volatility as the sector faces a structural realignment driven by advancements in Artificial Intelligence. The Nifty IT index witnessed a sharp 21% decline in February 2026, marking its most significant monthly retreat since the 2008 global financial crisis. This downturn, often termed an "Anthropic shock," followed the launch of sophisticated automation tools that threaten traditional software outsourcing models. Major industry leaders saw substantial erosion in market value, with Infosys and Wipro recording losses of 20% and 23.5% respectively. Tata Consultancy Services (TCS) also faced pressure, briefly seeing its market capitalization dip below the ₹10 lakh crore milestone. Despite the broader sell-off, a segment of the market is showing notable resilience. Approximately 25 select stocks have defied the downward trend by pivoting toward AI infrastructure, specialized engineering, and deep-tier integration. These companies are shifting from a labor-intensive "headcount" model to "outcome-based" delivery, which investors are rewarding as a more sustainable strategy. Recent data suggests the "AI scare trade" may be reaching exhaustion. On February 25, the Nifty IT index staged a 3% rebound as reports emerged of potential collaborations between AI startups and established Indian firms. Strategic partnerships are replacing fears of total displacement, with firms like Anthropic exploring service alliances that could utilize India's massive talent pool for AI orchestration. Industry projections remain cautiously optimistic. NASSCOM estimates the sector will reach $315 billion in revenue for fiscal year 2026, reflecting a 6.1% annual growth. AI-specific services are expected to contribute between $10 billion and $12 billion of this total, signaling that the industry is expanding into new domains even as traditional coding tasks are automated. Valuations for the sector have reached levels that some analysts now describe as too attractive to ignore. While the Nifty IT index hit a multi-year low of 30,053 this month, the dip has prompted institutional buying. Investors are increasingly focusing on "AI enablers"—companies with strong platforms in cloud computing, cybersecurity, and data governance—as the primary drivers of the next growth cycle. The current landscape represents a pricing reset rather than a terminal decline. The transition to a hybrid delivery model—where human expertise is layered with AI agents—is expected to dominate the short-term outlook. Market participants are now closely monitoring firms that can successfully compress delivery timelines and capture higher margins through automated efficiency.

US Corporate Bond Market Sees Record Inflow and Issuance Activity
The U.S. primary credit market has entered its most competitive phase on record as of February 2026. A massive surge in investor appetite for new corporate bonds is reshaping how debt is allocated and traded. Recent analysis of over one million investor records shows that competition for high-grade and junk bonds has reached all-time highs. This intensity is driven by a larger pool of funds, increased participation from U.S. life insurers, and a 10% year-over-year growth in holdings by foreign investors. Market performance indicators as of late February 2026: U.S. Corporate Bond Spreads are hovering near historical lows at approximately 0.80%. This compression highlights the extreme demand, as investors accept lower risk premiums to secure holdings. Year-to-date issuance for 2026 has already reached $239.4 billion, marking a 2.5% increase over the previous year. High-yield supply is leading the growth, up 28% compared to the same period in 2025. Secondary market activity is rising sharply. Daily trading volume has averaged $70.3 billion so far this year, a 25% increase from early 2025. The surge in competition has fundamentally changed the landscape for individual and institutional buyers. New bond offerings are "selling out" faster and to a more diverse base, leading to significantly tighter allocations. In the high-grade market, competition has intensified by 15% compared to baseline 2017 levels. The high-yield or "junk" segment has seen an even steeper jump of 30%. The most liquid sectors—including technology, banking, and capital goods—are experiencing the highest competitive pressure, with increases of up to 35%. This primary market squeeze is forcing many participants into the secondary market. Investors who miss out on initial allocations are repositioning quickly. Turnover for bond deals exceeding $1 billion has jumped to 26% within the first 10 days of issuance, nearly double the levels seen a few years ago. Speed of execution has also accelerated. The time required for the first secondary market trade after a bond is issued has dropped to just 20 to 30 minutes, compared to an hour in previous cycles. Looking ahead, experts anticipate record-breaking gross supply for the remainder of 2026. Corporate issuance is expected to be fueled by high refinancing needs, a 20% projected growth in M&A activity, and massive capital expenditures related to artificial intelligence and infrastructure. While the primary market shows signs of temporary slowing in late February, with weekly investment-grade supply dipping to $28 billion, the broader trend remains dominated by heavy demand and tightening spreads. Intermediate-duration bonds, particularly those rated BBB and BB, currently offer the most attractive carry for yield-driven investors in this environment.
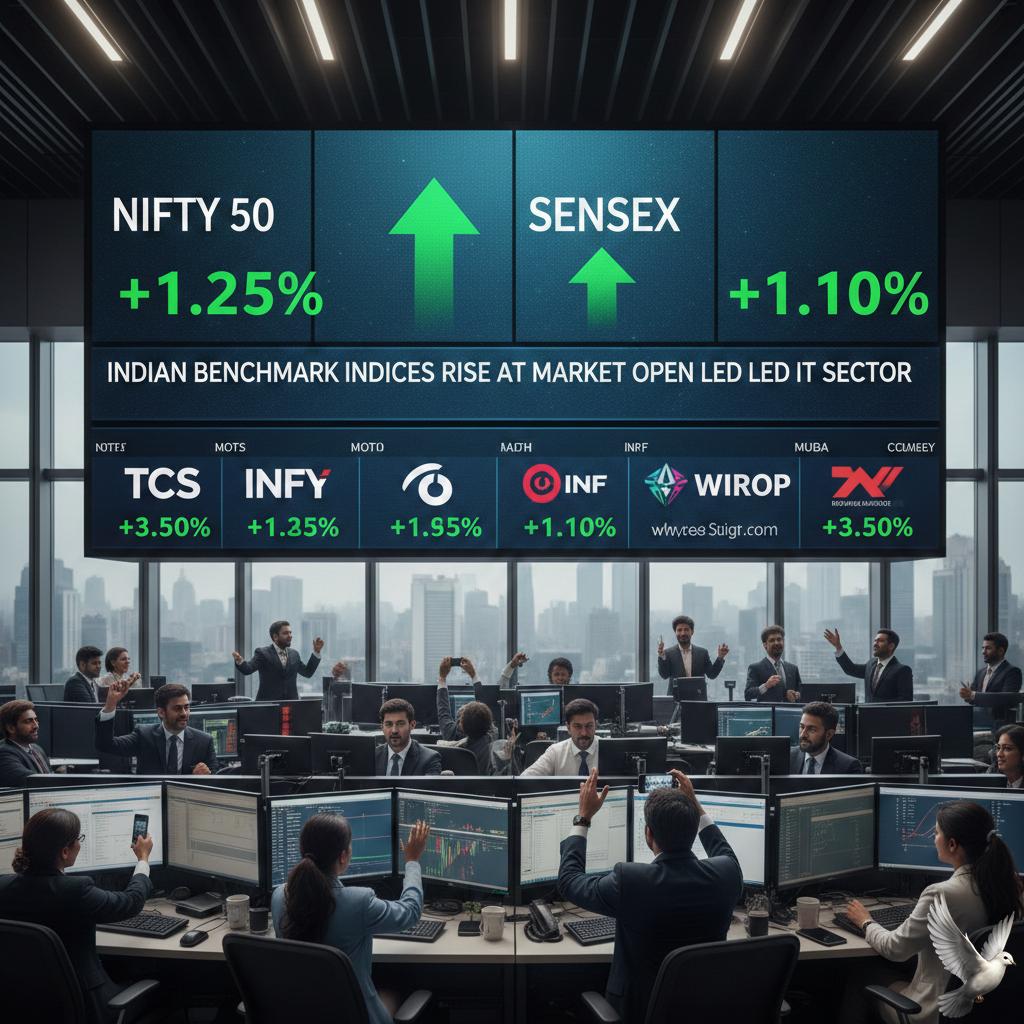
Indian Benchmark Indices Rise at Market Open Led by IT Sector
Indian equity benchmarks are sustaining upward momentum for the second consecutive session, bolstered by a strong recovery in global technology shares. The **Nifty 50** is trading at **25,482.50**, gaining **57.85 points** or **0.23%**, while the **Sensex** remains steady near the **82,276** mark. A significant rally on Wall Street, where the **Nasdaq** jumped **1.26%**, has provided a tailwind for domestic IT heavyweights. **Nvidia** reported record quarterly revenue of **$68.1 billion**, up **73%** year-on-year, which has effectively calmed global fears regarding a slowdown in artificial intelligence spending. In the domestic IT space, **HCL Technologies** led the gains with a **2.74%** rise to **1,375.90**. **Tata Consultancy Services (TCS)** advanced **2.15%** to reach **2,629.00**, and **Infosys** climbed **1.14%** to trade at **1,290.10**. This recovery comes after a period of intense volatility where the IT index had corrected nearly **30%** from its previous peaks. Beyond technology, the **Auto** and **Metal** sectors are showing selective strength. **Bajaj Auto** emerged as a top performer, rising **2.74%** to **10,098.50**, while **Tata Steel** gained **2.43%** to reach **214.22**. Market participants are noting a shift toward value buying in these sectors as geopolitical tensions and trade tariff uncertainties stabilize. Despite the positive index movement, heavyweights in the banking and energy sectors are facing pressure. **State Bank of India (SBI)** slipped **1.96%** to **1,199.30**, and **Reliance Industries** dropped **1.96%** to **1,400.80**, limiting the overall upside for the benchmarks. Broad market sentiment remains cautiously optimistic as investors await key domestic macro data. India's **GDP growth** for the current fiscal year is projected at **7.4%**, with industrial activity and digital services driving the momentum. Foreign Portfolio Investors (FPIs) are closely monitoring these indicators following a period of asset reallocation earlier in the month. The **India VIX**, a measure of market volatility, cooled by nearly **5%**, suggesting a temporary stabilization in investor nerves. While the **Nifty** faces immediate resistance near **25,650**, strong support is established at the **25,325** level.

IRFC OFS Opens for Retail Investors: Subscription Outlook and Market Analysis
The Indian Railway Finance Corporation (IRFC) is currently in the spotlight as the government executes a strategic stake sale through an Offer for Sale (OFS). The floor price for the issue was set at **Rs 104**, a level that has acted as a key technical support during recent market volatility. As of late February 2026, the government holds an **86.36%** stake in the company. The current OFS aims to divest a base stake of **2%**, with an additional **2%** greenshoe option. While the first day saw a subscription of approximately **95%** from non-retail investors, the government has reportedly decided not to exercise the oversubscription option, focusing on the core **2%** dilution to move closer to public shareholding norms. IRFC shares recently touched a 52-week low of **Rs 104.40**, reflecting broader pressure in the railway PSU sector. Despite this price correction, the company’s financial foundation remains robust. In the quarter ending December 2025, IRFC reported its highest-ever quarterly profit after tax of **Rs 1,802 crore**, a **10.5%** increase year-on-year. The company’s Assets Under Management (AUM) reached a milestone of **Rs 4.75 lakh crore** by the end of 2025. It also achieved its full-year sanction target of **Rs 60,000 crore** within just nine months of the fiscal year, highlighting efficient execution and a strong project pipeline. Market sentiment is currently driven by the upcoming Union Budget 2026-27. Analysts anticipate a nearly **10%** increase in railway capital expenditure, potentially raising outlays to **Rs 2.75 trillion** from the previous **Rs 2.52 trillion**. This increased spending is expected to focus on safety systems like Kavach, track doubling, and rolling stock expansion. The stock is trading below its 50-day and 200-day moving averages, which sit near **Rs 118** and **Rs 125** respectively. However, with a Price-to-Earnings (P/E) ratio around **19.5** and a dividend yield of **1.53%**, many experts view the current price levels as a tactical entry point for long-term investors. Operationally, IRFC is evolving under its "IRFC 2.0" strategy. The corporation is diversifying its lending portfolio to include metro rail projects, renewable energy, and dedicated freight corridors. This shift is designed to reduce dependency on traditional railway leasing and improve long-term margins. The OFS presents a transitional phase for the stock, balancing short-term supply pressure with long-term growth prospects linked to India's massive infrastructure modernization. Investors are closely monitoring the **Rs 104** floor price as a critical benchmark for the stock's immediate trajectory.

Silver and Gold Prices Face Volatility Amid Tariff and Geopolitical Uncertainty
Precious metals are navigating a volatile trading landscape today as global geopolitical shifts and trade policy adjustments reshape investor sentiment. Gold and silver prices opened with a cautious tone following a period of intense fluctuations driven by the legal battle over US trade measures. In the domestic market, gold futures on the MCX for April delivery recently traded near **162,000 INR** per 10 grams. This follows a significant recovery from previous lows, as market participants reacted to the US Supreme Court striking down initial "reciprocal" tariffs. However, the immediate implementation of a flat **15%** global import tariff by the US administration has kept trade uncertainty at the forefront. Silver has shown even more dramatic movement, with MCX futures consolidating around the **285,000 INR** to **295,000 INR** per kg range. Despite recent daily softenings, silver remains up approximately **175%** year-on-year, supported by sustained industrial demand in the solar and electric vehicle sectors. On the international stage, spot gold is holding firm near **5,190 USD** per ounce. The yellow metal reached a three-week high earlier this week as the US Dollar Index eased to approximately **97.60**. A weaker dollar historically makes bullion more affordable for international buyers, providing a technical floor for prices. Geopolitical tensions remain a primary catalyst for safe-haven buying. Investors are closely monitoring the third round of nuclear negotiations between Washington and Tehran in Geneva. Any escalation in rhetoric or a breakdown in these talks typically triggers a flight to safety, bolstering gold’s position as a protective asset. Economic indicators are further complicating the outlook. Recent US GDP data showed an annualized growth of **1.4%**, trailing the **2.8%** forecast, while inflation data remains hotter than expected. This environment has led traders to anticipate at least three interest rate reductions of **25 basis points** each from the Federal Reserve throughout the year. Central bank activity continues to underpin the long-term bullish trend. The People’s Bank of China extended its gold-buying streak for a fifteenth consecutive month in January, contributing to a broader structural support for the metal. Current technical levels suggest immediate support for gold at **158,800 INR** on the MCX, with resistance seen at **163,000 INR**. Silver faces resistance near the **278,000 INR** mark, with strong buying interest reported in the lower support zones. Market participants are now pivoting toward upcoming weekly jobless claims and further trade policy clarity to determine if the current consolidation phase will lead to a fresh breakout toward record highs.

Bharti Airtel Explores Entry into NBFC Sector with Proposed Rs 20,000 Crore Investment
Bharti Airtel has officially transitioned from a loan distributor to a direct lender following the approval of its NBFC license by the Reserve Bank of India on February 13, 2026. This move is backed by a massive capital commitment of 20,000 crore INR to be injected into its subsidiary, Airtel Money Limited, over the next few years. The capital structure for this venture is split with Bharti Airtel contributing 70% and the promoter group, Bharti Enterprises, providing the remaining 30%. This investment aims to build a credit book potentially reaching 1 trillion INR by leveraging a 5x capital-to-loan ratio. The company is entering a high-growth market where NBFC assets under management are projected to grow by 15% to 17% in the 2026 fiscal year. While traditional bank credit growth is stabilizing around 12%, the digital lending space continues to expand as India’s formal credit-to-GDP ratio remains at 53%. Airtel is building its direct lending business on a proven foundation. Its existing Lending Service Provider platform has already disbursed over 9,000 crore INR in loans over the past two years. This transition allows the company to retain higher margins and gain full control over product design and risk assessment. The competitive landscape is intensifying with the entry of telecom-backed NBFCs. Airtel now competes directly with Jio Financial Services and established leaders like Bajaj Finance. With 463.4 million mobile customers in India as of late 2025, Airtel holds a massive data advantage for underwriting and customer acquisition. Risk management remains a primary focus for the new entity. The company employs over 500 data scientists to power its underwriting models and real-time risk monitoring. This strategy aims to maintain industry-leading performance metrics as the broader NBFC sector deals with delinquency rates of 6% to 7% in unsecured segments. On the stock market, Bharti Airtel closed at 1,997 INR on February 23, 2026, reflecting a market capitalization of 11.38 trillion INR. While the stock has seen a 5.37% decline year-to-date, its five-year returns exceed 256%, signaling long-term investor confidence in its diversification beyond core telecom. This strategic pivot positions Bharti Airtel to capture the underserved credit market, specifically targeting the 22% to 23% growth seen in the affordable housing and MSME segments. By transforming into a comprehensive digital services platform, the company is securing a recurring, high-margin revenue stream for the next decade.

**Nipun Goel: 2026 IPO Fundraising Projected to Exceed $20 Billion Amid Market Acceleration**
India's primary market has entered a historic expansion phase, with 2025 closing as a record-breaking year for public listings. Total fundraising through mainboard IPOs reached an all-time high of **1.76 lakh crore**, marking a **10% increase** over the previous record set in 2024. The momentum remains exceptionally high as we move into early 2026. Domestic stock exchanges now demonstrate the depth and liquidity required to fund "jumbo" listings that previously sought international markets. This shift is exemplified by landmark issues such as Hyundai Motor India and Swiggy, which paved the way for a massive pipeline of upcoming offerings. Current data shows over **247 companies** have draft documents (DRHPs) filed or awaiting approval with SEBI. In the first half of 2025 alone, **118 new draft papers** were submitted, more than double the volume seen in the same period a year prior. This surge indicates that promoters and private equity funds remain highly bullish on long-term valuation prospects. New-age technology and SaaS companies are spearheading this growth. In 2025, **18 tech startups** successfully listed, raising over **41,283 crore**. This sector is becoming more mature, with a notable shift toward companies showing clear paths to profitability. Fintech and e-commerce continue to dominate, while newer segments like quick commerce and electric vehicles are gaining rapid traction. Valuations have undergone a necessary recalibration. While 2024 saw average listing gains of **30%**, that figure moderated to approximately **10%** in 2025. Investors have become increasingly selective, focusing on business quality and cash flow predictability rather than speculative growth. This "realistic pricing" trend is helping stabilize the market and prevent overheating. Private equity and venture capital exits are a major driver of current activity. Offer for Sale (OFS) components accounted for roughly **45%** of total IPO proceeds last year. Promoters and early-stage backers are utilizing the current market strength to monetize holdings, with nearly **1 lakh crore** in shares sold through these exits. Retail participation remains a cornerstone of the Indian market. While individual application sizes have moderated slightly, the total number of retail investors has surpassed **108 million**. Significant SIP inflows and robust domestic institutional demand provide a strong floor for new issuances, even during periods of global volatility. The outlook for 2026 points toward another blockbuster year. Heavyweights like Reliance Jio, OYO, and PhonePe are among the marquee names expected to hit the floor. With the Indian economy projected to grow above **6%**, the IPO ecosystem is structurally positioned to absorb annual primary issuances of up to **2%** of the total market capitalization. [India's IPO Market Trends](https://www.youtube.com/watch?v=VjrV92p67u0) This video provides a comprehensive breakdown of the record-breaking 2025 IPO season and offers expert projections for the major listings expected throughout 2026. http://googleusercontent.com/youtube_content/0

Nvidia Earnings Boost Tech Sector; IT Stocks Including Infosys and TCS in Focus
Market dynamics for Indian IT stocks are shifting as the sector navigates a high-stakes transition between global AI-led rallies and local volatility. Recent record earnings from Nvidia have provided a critical floor for market sentiment, while breakthrough tools from AI startup Anthropic continue to challenge traditional service models. Nvidia Records and Sector Support Nvidia reported a monumental fourth quarter with revenue hitting $68.1 billion, a 73% increase year-over-year. This surge was primarily fueled by record Data Center revenue of $62.3 billion. For the full fiscal year 2026, the chipmaker's revenue reached $215.9 billion, marking a 65% rise. This performance has reignited confidence in the global AI infrastructure cycle, which serves as a long-term growth driver for Indian firms providing AI implementation and integration services. AI Disruption and Market Correction The Nifty IT index has faced significant pressure, dropping approximately 21% in February 2026. This marks the steepest monthly decline for the sector in over 23 years. The sell-off was triggered by the debut of Anthropic’s "Claude Code" and "Claude Cowork" agentic AI tools. These platforms have demonstrated the ability to automate complex coding tasks and back-office functions, leading to fears that the traditional labor-arbitrage model—worth over $200 billion annually in exports—could be structurally impaired. Performance of Key Players Despite the broader index slump, individual stock performance reflects varying degrees of resilience based on AI integration: - TCS and Infosys have seen declines of roughly 19% to 21% this year as investors weigh their high exposure to application services. - Wipro has faced a steeper correction of 24%, while HCLTech and Tech Mahindra have dropped 18% and 16% respectively. - Mid-tier firms such as Coforge and Persistent Systems are being monitored closely as they attempt to pivot toward higher-margin AI consulting. Strategic Pivot and Monetization The industry is moving from experimental pilots to scaled execution. Nasscom projects Indian tech revenue to reach $315 billion in FY26, with a growth rate of 6.1%. AI-specific revenue is expected to contribute $10–12 billion of this total. Major firms are already reporting measurable AI income: - TCS has established an annualized AI revenue run rate of $1.8 billion. - Infosys reports that AI now accounts for 5.5% of its total revenue, generating $275 million. - HCLTech attributes 4% of its topline to AI-driven earnings, totaling $146 million. The Road Ahead Market analysts suggest the sector is entering a "Human + AI" phase where revenue growth is decoupling from traditional hiring. While headcount grew marginally by 1.35 lakh to a total of 5.9 million in 2026, the focus has shifted to domain-specialized roles. Total IT spending in India is forecasted to hit $176.3 billion by the end of the year, driven by a 20.5% surge in data center investments and a 17.6% rise in software spending. Strategic alliances, such as the recent partnership between Infosys and Anthropic to deploy Claude AI for enterprise clients, indicate that leading firms are choosing to integrate disruptive tools rather than compete against them. This transition is expected to redefine the industry’s profitability through platform subscriptions and outcome-based pricing models.
IRFC Shares Steady as Government Forgoes Greenshoe Option in OFS; Retail Tranche Opens
Indian Railway Finance Corporation (IRFC) remains a central focus in the capital markets as the government proceeds with its stake divestment strategy. In a recent development, the government decided not to exercise the **oversubscription (greenshoe) option** in its Offer for Sale (OFS). This decision followed moderate participation from institutional investors during the initial bidding phase. The OFS was launched with a base offer of **2% equity**, equivalent to approximately **26.14 crore shares**. While an additional **2%** was available via the greenshoe option, the final sale is expected to remain limited to the base portion. The floor price for the transaction was set at **104 per share**, representing a discount to the prevailing market price at the time of the announcement. Market Performance and Valuation Following the OFS news, IRFC shares experienced downward pressure, touching a **52-week low** near the **104.80** mark. This correction reflects the market's absorption of the additional share supply. Despite the short-term price volatility, the company maintains a significant market capitalization of approximately **1,36,600 crore**. The stock currently trades at a Price-to-Earnings (P/E) ratio of approximately **19.50**, with a Price-to-Book (P/B) value of **2.71**. For the trailing twelve months, the Earnings Per Share (EPS) stands at **5.36**, supported by a consistent dividend yield of **1.53%**. Financial Highlights and Growth IRFC continues to report a resilient financial profile, characterized by record-breaking profitability. For the quarter ended December 2025, the company posted its **highest-ever quarterly Profit After Tax (PAT)** of **1,802 crore**, marking a **10.5% increase** year-on-year. * **Assets Under Management (AUM):** Reached an all-time high of **4.75 lakh crore**. * **Net Interest Margins (NIM):** Improved by over **8% YoY**, driven by disciplined liability management. * **Revenue:** Witnessed a marginal dip of **1.5%**, totaling **6,661 crore** for the quarter, primarily due to a moratorium extension on certain lease agreements. * **Sanctions:** The company achieved its full-year sanction guidance of **60,000 crore** within the first nine months of the fiscal year. Strategic Shift: IRFC 2.0 Under its "IRFC 2.0" strategy, the corporation is evolving from a single-client model focused solely on the Ministry of Railways to a broader multi-client ecosystem. This includes financing for allied infrastructure and the **Dedicated Freight Corridor (DFCCIL)**. Recent global engagement remains strong, with IRFC securing a **400 million USD** loan from a consortium of Japanese banks in February 2026. This follows a **300 million USD** facility raised in late 2025, aimed at optimizing borrowing costs and diversifying its capital base. The company maintains a **zero Non-Performing Asset (NPA)** track record, ensuring high asset quality as it expands its footprint across India's transport and infrastructure landscape. While the OFS has introduced near-term supply pressure, the underlying fundamentals remain supported by robust credit growth and a dominant role in national infrastructure financing.

PNGS Reva Diamond Jewellery IPO: Subscription Status, GMP, and Brokerage Reviews
The initial public offering of PNGS Gargi Fashion Jewellery—operating under the brand "Gargi by P.N. Gadgil & Sons"—concluded its subscription phase with a massive surge in investor interest, contrasting sharply with earlier muted expectations. As of late February 2026, the company’s market performance and financial health have taken center stage. The stock has demonstrated significant volatility, recently trading near **842.20**, well above its original issue price of **30**. This represents a staggering long-term gain for early investors, despite the broader market's current consolidation phase. **Market Context and Sector Trends** The jewellery sector is navigating a high-cost environment. Domestic gold prices have hit record highs this month, with 24K gold reaching approximately **16,205 per gram** and 22K gold at **14,856 per gram** as of February 26, 2026. While high prices have led to a **20%** drop in purchase volumes year-on-year, the value of sales across the industry has grown by **25% to 30%**. This trend favors established brands with strong margins, though it places pressure on working capital requirements for smaller players. **Financial Performance Highlights** PNGS Gargi Fashion Jewellery reported robust growth in its most recent fiscal disclosures. For the year ending March 2025: - Operating income surged **150.1%** year-on-year to **1,263 million** - Net profit grew by **240.5%**, reaching a margin of **22.8%** - The company maintains a healthy current ratio of **6.0x**, indicating strong liquidity In the latest quarter ending December 2025, the company maintained steady momentum with a net profit of **10.60 crore**, a **15.85%** increase compared to the same period in the previous year. Revenue for the quarter stood at **46.06 crore**. **Subscription and Investor Sentiment** The IPO was eventually subscribed **230.94 times**, driven by an overwhelming response from retail investors (**248.68 times**) and non-institutional buyers (**213.21 times**). This level of interest suggests that the market has looked past initial concerns regarding regional concentration and valuation. The company is actively expanding its footprint, recently opening a new exclusive brand store in Uttar Pradesh in February 2026. This move aims to address geographic concentration risks by moving beyond its traditional strongholds. **Market Outlook** The broader Indian indices, with the Nifty 50 hovering around **25,482** and the Sensex at **82,276**, show a trend of range-bound consolidation. While the jewellery sector remains sensitive to gold price fluctuations and global trade policies, PNGS Gargi's zero-debt status and high Return on Equity (**28.9%**) position it as a resilient player in the fashion jewellery segment. Investors continue to monitor the impact of rising raw material costs on consumer demand, though the shift toward branded, certified silver and fashion jewellery provides a competitive cushion against traditional bullion volatility.

ITC Outlines ₹20,000 Crore Capex Strategy Targeting FMCG, Technology, and Hotel Sector Expansion
ITC Limited is undergoing a deep structural transformation, pivoting toward a technology-first model while committing to a massive ₹20,000 crore capital expenditure plan. This strategic outlay is designed to scale its manufacturing footprint and accelerate emerging growth vectors over the medium term. The conglomerate recently concluded a landmark corporate restructuring with the demerger of its hotel business. Effective January 6, 2025, the hospitality arm transitioned into a standalone entity, ITC Hotels Limited. Under this arrangement, shareholders received one share of the new hotel entity for every 10 shares held in ITC Ltd, while the parent company retains a 40% stake to maintain strategic synergy. Market performance in early 2026 has been defined by regulatory shifts and sector-specific volatility. As of late February 2026, ITC’s stock has shown signs of recovery, trading around the ₹320 to ₹330 range after hitting a 52-week low of ₹302 on February 2. This pressure followed a significant hike in cigarette taxes—effective February 1, 2026—which saw excise duties rise by 20% to 55% depending on product size. To protect margins against these tax headwinds, the company implemented strategic price hikes across its cigarette portfolio ranging from 20% to 40%. Despite the immediate impact on stock pricing, ITC maintains a robust dividend yield of approximately 4.4%, continuing to attract institutional interest. The non-cigarette FMCG segment remains a primary growth engine, with a long-term revenue target of ₹1 lakh crore by 2030. Currently, non-cigarette businesses contribute 65% of the group’s total revenue. High-performing categories like staples, dairy, and biscuits, along with digital-first brands such as Yoga Bar and Mother Sparsh, are driving this momentum. Innovation is being spearheaded through the ITCMAARS digital platform. This "phygital" ecosystem now supports over 2.2 million farmers across 11 states. By integrating advanced tools like the Krishi Mitra AI assistant and image-based disease diagnostics, the platform has reportedly boosted farm incomes by 25% while reducing fertilizer use by up to 15%. Operational efficiency remains a core focus as the company evaluates its broader corporate structure. With a debt-free balance sheet and a focus on "Bharat First," ITC is positioning itself to capture rising domestic consumption, projecting that India’s per capita income will exceed $4,000 by 2030.
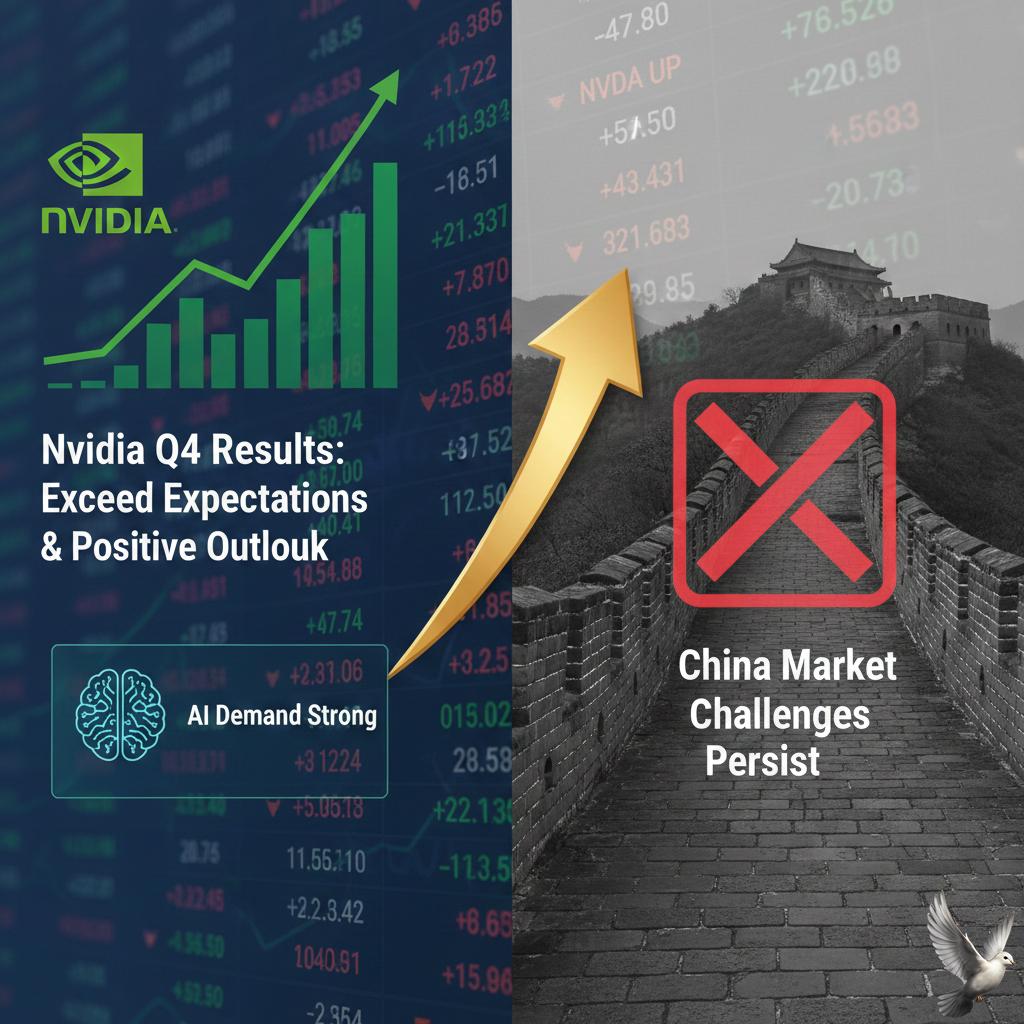
Nvidia Q4 Results and Positive Outlook Offset AI Demand Concerns Amid Continued China Market Challenges
Nvidia has solidified its position as the primary engine of the global artificial intelligence boom, reporting record-breaking financial results for the fourth quarter of fiscal 2026. The company reached a quarterly revenue peak of $68.1 billion, representing a 73% increase from the previous year. This performance was largely propelled by the Data Center division, which saw revenue surge 75% to $62.3 billion, effectively quieting concerns regarding a potential slowdown in infrastructure spending. The chipmaker’s profitability remains exceptional, with gross margins holding steady at 75.2%. For the full fiscal year 2026, Nvidia generated $215.9 billion in total revenue, a 65% jump from 2025. Following these results, the stock price rose approximately 2% in extended trading, bringing the company’s market capitalization to a staggering $4.66 trillion. Investor focus has shifted toward the upcoming first quarter of fiscal 2027, where Nvidia has issued bullish guidance. The company expects revenue to reach $78.0 billion, significantly exceeding market expectations of $72.8 billion. This optimistic outlook is supported by a massive $700 billion projected capital expenditure from major hyperscalers—including Google, Amazon, and Meta—who continue to prioritize AI infrastructure. Product cycles are a major catalyst for 2026. Demand for the current Blackwell architecture remains "exceptional," while the newly announced Vera Rubin platform is expected to enter production in the second half of the year. This next-generation series is designed for "AI factories" and agentic workflows, promising a fivefold increase in inference performance. Despite the financial triumphs, the regulatory landscape in China remains a significant headwind. While a recent agreement eased some export restrictions, U.S. officials confirmed this week that zero H200 chips have been sold to Chinese end-users thus far as licensing details are finalized. Nvidia has prudently excluded all China-related Data Center revenue from its next-quarter guidance. Competition is also intensifying as the market enters the "Inference Era." While Nvidia maintains an estimated 80% to 90% share of the accelerator market, AMD has secured high-profile deals with OpenAI for its MI-series chips. Simultaneously, hyperscalers like Google are increasingly deploying internal Tensor Processing Units (TPUs) to optimize costs, challenging Nvidia’s dominance in specific AI workloads. Nvidia’s current market position reflects a transition from providing standalone chips to delivering full-stack AI supercomputing ecosystems. With a remaining share repurchase authorization of $58.5 billion, the company is signaling confidence in its ability to navigate geopolitical friction and rising competition while maintaining its lead in the global AI race.

LT Foods shares in focus as US reduces soybean duty and Rs 163 crore liability
LT Foods: Market Brief **February 26, 2026** Shares of **LT Foods Ltd** are witnessing significant market attention following a major regulatory breakthrough in the United States. The U.S. Department of Commerce issued a final order on February 23, 2026, drastically reducing the countervailing duty (CVD) on organic soybean meal exports for its subsidiary, Ecopure Specialities Limited. The duty rate has been slashed from a provisional **340.27%** down to **75.48%**. This revision follows an administrative review of exports conducted during the 2023 calendar year. Financial Relief and Liability The sharp reduction in the CVD rate is a pivotal development for the company’s balance sheet. LT Foods has confirmed that this adjustment lowers its potential financial liability by approximately **Rs 163 crore**. Previously, the high provisional rate was based on "adverse facts available" (AFA) methodology, which applied to sales worth **Rs 50 crore** during the review period. The new, lower rate significantly improves the export competitiveness of the company’s organic segment in the North American market. Quarterly Performance Highlights The regulatory relief coincides with a period of robust operational growth. For the third quarter of FY2026 (ending December 2025), LT Foods reported: * **Revenue:** A **23.5%** year-on-year increase to **Rs 2,809.2 crore**. * **Net Profit:** Growth of **9.8%**, reaching **Rs 157.35 crore** compared to Rs 143.25 crore in the previous year. * **EBITDA:** Rose by **25.8%** to **Rs 314.32 crore**. * **Margins:** Operating margins expanded slightly to **11.19%**, up from 10.98%. The company, known for its flagship brands **Daawat** and **Royal**, continues to see strong demand in its core basmati rice segment, which has cushioned the impact of fluctuating commodity costs. Stock Market Momentum The equity markets have responded positively to these updates. In recent trading sessions leading into late February 2026, the stock has shown high volatility and upward momentum. As of February 25, 2026, the share price settled around **Rs 408.50**. Earlier in the month, the stock hit intraday highs near **Rs 420**, outperforming the broader agricultural products sector. Technical indicators show the stock trading above its 50-day and 100-day moving averages, reflecting a strengthening short-to-medium-term trend. Broader Export Context While the duty cut provides immediate relief, the **75.48%** rate remains a significant factor for export margins. This development comes at a time when Indian oilmeal exports have faced general pressure, with total soybean meal shipments experiencing volume declines due to competitive pricing from the U.S. and Brazil. However, the specific relief for LT Foods' organic subsidiary is expected to stabilize its niche export volumes to the U.S., where demand for organic feed continues to grow at an estimated **7%** annually. Investors are now monitoring how this reduced liability will reflect in the upcoming year-end audited financial statements.

Sedemac Mechatronics Sets IPO Price Band at ₹1,287–1,352 for ₹1,087 Crore Public Issue
Sedemac Mechatronics has confirmed the price band for its upcoming initial public offering (IPO) at Rs 1,287 to Rs 1,352 per share. The Pune-based technology firm aims to raise approximately Rs 1,087.45 crore through this issue. The bidding process is scheduled to open for public subscription on March 4, 2026, and will conclude on March 6, 2026. Prior to this, the anchor book for institutional investors will be active for one day on March 2. The entire issue is structured as an Offer for Sale (OFS) of 80.43 lakh equity shares. This means the company will not receive any proceeds from the sale; instead, the funds will go to the selling shareholders, including promoters Manish Sharma and Ashwini Amit Dixit, alongside major backers like A91 Partners and Catamaran Ventures. Sedemac is entering the public market at a valuation of approximately Rs 5,970 crore at the upper end of the price band. The company is a prominent manufacturer of powertrain controllers and electronic control units (ECUs), holding a market share of over 75 percent in India’s genset controller segment. Financial performance has shown a significant upward trajectory leading into the IPO. Revenue from operations climbed from Rs 423.03 crore in FY23 to Rs 658.36 crore in FY25. Even more notable is the profit growth, which surged nearly eightfold from Rs 5.88 crore in FY24 to Rs 47.05 crore in FY25. Current market conditions present a mixed backdrop for the debut. As of February 26, 2026, Indian benchmark indices have shown signs of consolidation. The Nifty 50 is hovering around the 25,450 level, while the BSE Sensex remains near 82,500. While the primary market has seen lower listing gains in 2026 compared to last year, the industrial electronics sector remains a point of interest for institutional buyers. The share allotment is expected to be finalized by March 9, with the tentative listing date on the BSE and NSE set for March 11, 2026. Retail investors can participate with a minimum application size of 11 shares, requiring an investment of Rs 14,872 at the cap price.

Omnitech Engineering IPO: Day 2 Subscription Status, GMP, and Broker Analysis
Omnitech Engineering is currently navigating the second day of its **Rs 583 crore** initial public offering, which remains open for subscription until February 27, 2026. The issue is a combination of a fresh equity sale worth **Rs 418 crore** and an offer for sale totaling **Rs 165 crore**. As of the conclusion of the first day, the IPO saw a muted overall subscription rate of **0.09 times**. While retail and non-institutional categories showed initial caution with **0.06 times** coverage each, the employee portion emerged as a major highlight, achieving an oversubscription of **2.15 times**. Market sentiment in the unofficial grey market suggests a conservative debut. The current Grey Market Premium (GMP) is approximately **Rs 8**, implying a modest listing gain of roughly **3.5%** over the upper price band of **Rs 227**. Financially, the company has demonstrated significant growth. Revenue for fiscal 2025 surged by **92%** to **Rs 349.71 crore**, while profit after tax jumped **132%** to reach **Rs 43.87 crore**. This growth is supported by a robust order book which stood at **Rs 1,764.7 crore** as of late 2025. The company plans to utilize **Rs 233.55 crore** of the fresh proceeds to establish two new manufacturing facilities in Rajkot, Gujarat. Additionally, **Rs 50 crore** is earmarked for the repayment of existing borrowings to strengthen the balance sheet. Despite the strong growth trajectory, analysts have flagged risks regarding customer concentration and working capital cycles. The top ten customers account for nearly **48%** of the revenue, and the working capital cycle has stretched to **283 days** in the most recent fiscal year. At the upper price band, the stock is valued at a price-to-earnings (P/E) multiple of approximately **50.5x**. While this represents a premium, it remains competitive compared to certain industry peers, some of which trade at significantly higher multiples due to the niche nature of precision engineering. Final allotment of shares is expected on March 2, 2026, with the official listing on the BSE and NSE scheduled for March 5, 2026.
Mankind Pharma and Three Others Show Bullish RSI Upswing
Nifty 200 Momentum Brief: February 25, 2026 The Indian equity market demonstrated selective strength during the mid-week session. While broad benchmarks like the **Nifty 50** managed a modest gain of **0.23%** to close at **25,482.50**, specific momentum in the **Nifty 200** universe caught the attention of technical traders. A key development surfaced as four notable stocks signaled a shift in price strength by crossing above the **50 mark** on the **Relative Strength Index (RSI)**. This crossover is traditionally viewed as a transition from a neutral or bearish phase into bullish territory. Healthcare Leads the Charge The pharmaceutical sector emerged as a primary driver of this momentum shift. **Mankind Pharma** saw its share price surge by **4.92%**, ending the session at **2,155.70**. This movement was backed by a 50-day moving average crossover, a technical signal that has historically preceded price gains in this specific counter. **Aurobindo Pharma** mirrored this bullish sentiment, recording a **4.05%** jump to close at **1,211.50**. The stock’s RSI moved firmly above **50**, supported by healthy trading volumes exceeding **30 lakh shares**. Analysts have noted that the company’s expanding production capacities and steady quarterly growth are aligning with these improving technical indicators. Market Context and Volatility Despite these individual success stories, the broader market remains in a consolidation phase. The **Nifty 200** index has faced recent pressure, particularly from a sharp correction in the IT sector which saw a nearly **21%** decline throughout February. Institutional activity remains polarized. Foreign Institutional Investors (FIIs) were net sellers with outflows near **638 crore**, while Domestic Institutional Investors (DIIs) provided a significant cushion with net purchases exceeding **3,161 crore**. Key Technical Levels Traders are monitoring the **25,500** level for the **Nifty 50** as a crucial resistance zone. A sustained move above this threshold is expected to confirm the bullish momentum signaled by the RSI Trending Up scan. Conversely, the **25,000** psychological mark serves as the primary support base. With the **India VIX** hovering around **14.36**, volatility remains a factor, making these RSI-based momentum signals critical for identifying short-term entry points in an otherwise sideways market.