Bullish News
Collection
Indian Households Shift Financial Savings Away From Fixed Deposits
**Market Brief: The Structural Shift in Indian Household Savings** **Equity Culture Takes Root** Indian households are decisively pivoting from traditional safety nets to riskier market-linked assets. As of FY25, the share of equities and mutual funds in annual household financial savings surged to **15.2%**, a stark rise from just **2%** in FY12. This transition is fueled by disciplined retail participation. Monthly Systematic Investment Plan (SIP) inflows reached a record **₹28,000 crore** in the first half of FY26, marking a **7x increase** since FY17. The unique equity investor base has crossed **12 crore**, signaling deep structural adoption of equities for wealth creation. **Pressure on Traditional Banking** The aggressive move toward capital markets has created funding challenges for banks. The share of bank deposits in household savings dropped to roughly **35%** in FY25, down from **58%** a decade ago. Consequently, credit growth is outpacing deposit mobilization. The credit-deposit ratio climbed to **82%** in January 2026, forcing lenders to compete aggressively for funds. This imbalance highlights a growing liquidity strain as savers chase higher inflation-adjusted returns in the stock market. **The Debt Market Void** While equity participation is robust, the debt market remains a missing link in the financial ecosystem. India's corporate bond market accounts for only **16-17%** of GDP, significantly lagging behind the equity market capitalization, which exceeds **130%** of GDP. Retail engagement with debt securities is minimal. For a balanced financial system, policy focus must now shift toward deepening the bond market to offer households a viable middle ground between volatile equities and low-yield bank deposits. [CNBC TV18 Banks Review](https://www.youtube.com/watch?v=kNhcj71hT1E) This video discusses the recent performance of large private banks, highlighting the critical lag in deposit growth compared to loans which directly relates to the liquidity pressures mentioned in the brief. http://googleusercontent.com/youtube_content/0
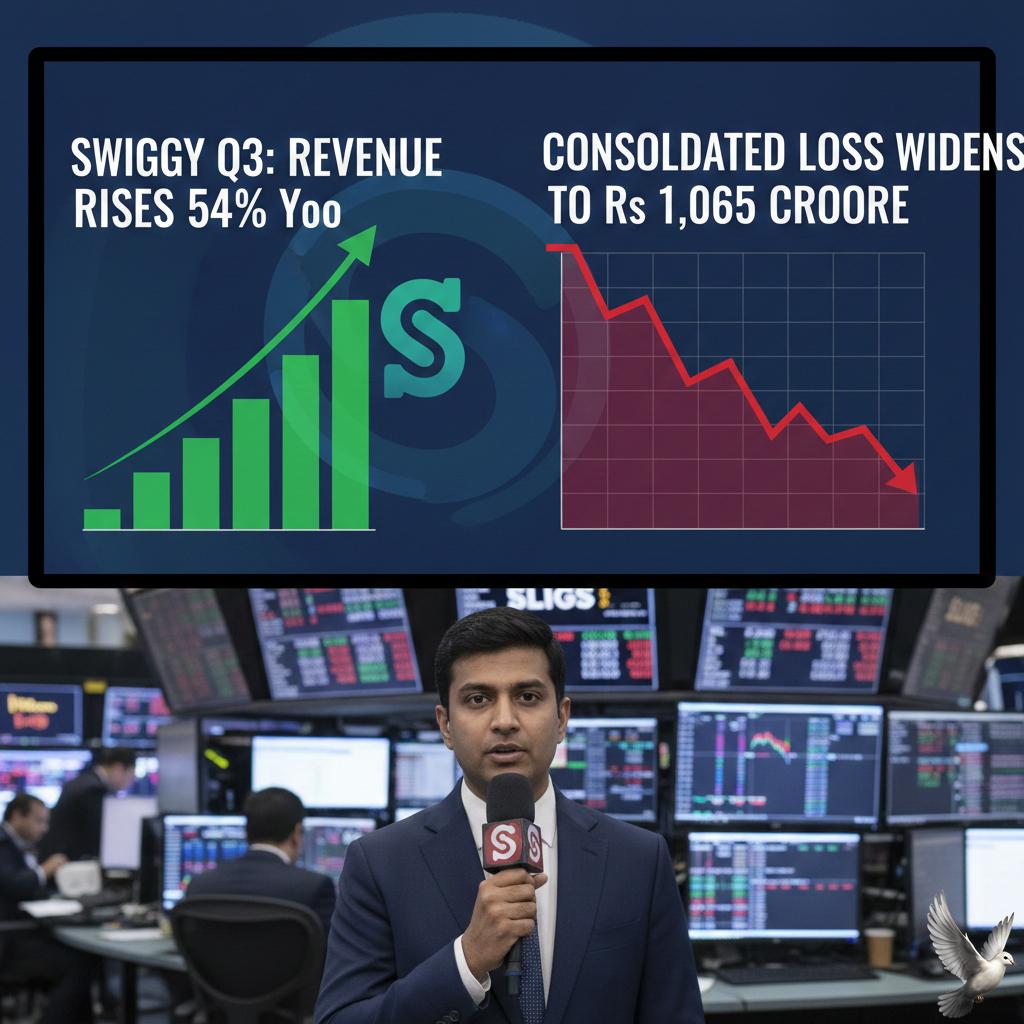
Swiggy Q3: Revenue Rises 54% YoY, Consolidated Loss Widens to Rs 1,065 Crore
**Swiggy Q3 FY26 Market Brief** **Financial Snapshot** Swiggy has released its financial results for the third quarter of FY26 (ended December 31, 2025), reporting a consolidated net loss of **₹1,065 crore**, a widening from ₹799 crore in the same period last year. Despite the bottom-line pressure, top-line growth remained robust. Revenue from operations surged **54% year-on-year** to **₹6,148 crore**, driven by aggressive expansion in quick commerce and steady gains in its core food delivery business. **Segment Performance** The Quick Commerce arm, Instamart, continues to be the primary growth engine, recording a Gross Order Value (GOV) of **₹7,938 crore**, a massive **103% increase** year-on-year. However, this segment remains a drag on profitability due to high cash burn from dark store expansion and fierce competition. The core Food Delivery business showed resilience with a **20.5% growth** in GOV, reaching **₹8,959 crore**. This marks the segment's fastest growth rate in three years, aided by a 22% increase in monthly transacting users (18.1 million). **Market Context & Stock Reaction** Following the earnings announcement on January 29, 2026, Swiggy’s stock traded in the range of **₹324–₹327**, reflecting a cautious market sentiment. While investors cheered the revenue momentum, the widening loss due to operational expenses—specifically a **47.5% jump in advertising spend**—remains a key concern. **Competitive Landscape** Management attributed the profitability headwinds to "irrational competitive intensity" in the quick commerce sector, where rivals like Zomato’s Blinkit and Zepto are locked in a price war. Swiggy has opted not to chase low-value orders aggressively, focusing instead on infrastructure scale-up; the company added **34 new dark stores** this quarter, bringing its total network to 1,136. **Outlook** The widened loss is largely strategic, reflecting Swiggy's choice to prioritize market share in the booming quick commerce sector over immediate profitability. With cash reserves bolstered by its recent public listing and QIP, the company signals it is well-capitalized to sustain this high-growth, high-burn phase.

Sensex Gains 222 Points, Nifty Ends Above 25,400 as Market Recovers From Early Dip
**Market Brief: Thursday Closing Update** **Indices Snap Volatility, End in Green** Indian equities staged a smart recovery on Thursday, January 29, reversing early losses to close higher for the third straight session. The turnaround was fueled by optimism surrounding the **Economic Survey 2025-26** and supportive global cues, despite lingering geopolitical headwinds. **Closing Figures** * **Sensex:** Ended at **82,566.37**, up **222 points** (+0.27%). * **Nifty 50:** Closed at **25,418.90**, gaining **76 points** (+0.30%). * **Bank Nifty:** Rose **0.60%** to settle at **59,958**. **Key Drivers** The **Economic Survey** lifted sentiment by projecting a robust GDP growth of **6.8%–7.2%** for FY27, reinforcing confidence in the domestic economy ahead of the Union Budget. A late surge in buying helped benchmarks recover from the morning selloff, with **Metal stocks** leading the charge (up **3%**) on firming commodity prices. **Geopolitical & Global Cues** Investors remained cautious amid escalating **U.S.–Iran tensions**, following warnings from Washington that pushed crude oil prices higher. **Brent Crude** broke past the **$70 per barrel** mark, while the **US Federal Reserve** held interest rates steady, as widely expected. **Commodities Watch** * **Gold:** Hit a fresh record high of **₹17,900** per 10 grams (approx. **$5,600** globally), acting as a safe haven against geopolitical risks. * **Currency:** The Rupee remained under pressure, slipping to record lows against the dollar amid foreign fund outflows. **Sectoral Performance** While **Metals** and **Financials** supported the index, defensive sectors like **IT, FMCG, and Pharma** witnessed profit-booking, capping broader gains. Market breadth was mixed, with volatility expected to persist as the street awaits the **Union Budget** presentation on February 1.

India Jewellery Demand Declines 24% in 2025 Amid Rising Gold Prices: WGC
The Indian gold market is experiencing a profound structural shift, characterized by a sharp decline in consumption volume coupled with a record high in value, a direct consequence of the relentless surge in bullion prices. The calendar year **2025** saw India's total gold demand fall by **11%** in volume to **710.9 tonnes**. This marks the lowest level of annual consumption in five years. However, the skyrocketing price environment boosted the overall value of demand by a significant **30%** year-on-year, reaching an unprecedented **₹7,51,490 crore**. *** Jewellery Demand and Price Impact Jewellery, the traditional pillar of Indian gold consumption, absorbed the main impact of the price rally. Demand for gold jewellery by volume plummeted **24%** in 2025 to **430.5 tonnes**, the weakest showing since the COVID-impacted year of 2020. Despite this massive volume decline, the value spent on jewellery climbed **12%** to reach a new record high of **$49 billion**. Domestic gold prices soared an exceptional **76.5%** over the course of the year. The average gold price climbed to over **₹1,01,572 per 10 grams** in 2025, up sharply from the previous year. This rapid appreciation created intense affordability pressure, forcing consumers to adjust buying patterns. Even during the critical wedding season in the final quarter, jewellery volumes dropped **23%**, illustrating that budgets simply could not keep pace with the price movement. The market trend has extended into early **2026**. Spot rates for 24-karat gold have continued to hit lifetime highs, reaching peaks near **₹1,80,000 per 10 grams** in major city retail markets in January, driven by sustained global risk aversion. *** The Investment Pivot High and volatile prices have cemented gold’s status as a pure investment vehicle over adornment. Investment demand—covering bars and coins—emerged as the market's clear bright spot. Investment consumption surged **17%** by volume in 2025, totaling **280.4 tonnes**, its highest level since 2013. The value of this segment saw an even sharper increase, jumping **73%** year-on-year to a massive **₹2,97,100 crore**. This reflects a growing strategic commitment among Indian households to treat gold as a long-term portfolio hedge against global financial uncertainty and domestic inflation. Investment now accounts for roughly **40%** of total consumption, significantly higher than its historical average. This pivot is further evidenced by the dramatic rise in inflows into gold Exchange Traded Funds (ETFs), which increased by **283%** in 2025. *** Consumer Behavior and Supply Dynamics To manage affordability, consumers have shifted purchasing behavior. There is a noticeable trend toward **lower-weight** and simpler jewellery designs. Many consumers are using **trade-ins**, exchanging old gold to fund new, smaller purchases, thereby maintaining a fixed spending budget. In an unusual trend for a period of record-high prices, gold recycling, or scrap supply, fell by **19%**. This indicates that consumers are choosing to retain their gold holdings, betting on further price gains rather than liquidating their reserves for immediate profit. Looking ahead, the World Gold Council forecasts overall demand for India in **2026** to remain subdued, expected to range between **600 and 700 tonnes**. Jewellery demand volumes are likely to face continued weakness if prices stay elevated, while investment demand is predicted to remain robust, buoyed by ongoing global geopolitical tensions and expectations of a potentially easier global monetary policy. The gold market remains firmly driven by its role as a safe-haven asset.

Economic Survey: FPI Flows Volatile in FY26 Amid Global Uncertainty and AI Capital Shift
**MARKET BRIEF: FPI Flows & The AI Pivot** **Date:** January 30, 2026 **Subject:** Foreign Portfolio Investment (FPI) Trends FY26 **Executive Summary** The Economic Survey 2025-26, tabled yesterday, confirms a structural shift in global capital allocation. Foreign Portfolio Investors (FPIs) have turned net sellers of Indian equities, redirecting liquidity toward AI-centric markets. While volatility remains elevated, domestic institutional flows and debt market resilience offer a crucial buffer. **The "AI Trade" Capital Shift** Foreign investors pulled a net **USD 3.9 billion** from Indian equities between April and December 2025. This outflow is not driven by domestic weakness, but by a massive global rotation into "AI Hubs"—specifically the **US, Taiwan, and Korea**. As global risk appetite narrows to the Artificial Intelligence theme, India’s broad-market valuation premium has prompted a tactical exit. The "AI-centric" allocation has left emerging markets like India temporarily underweighted in global portfolios. **Divergence: Equity Out, Debt In** A clear split has emerged in asset class performance: * **Equities:** FPIs offloaded shares, particularly in export-oriented sectors like **IT and Healthcare**. * **Debt:** Conversely, Indian debt markets saw net buying. The yield spread between Indian and US government bonds widened to nearly **250 basis points** by late 2025, making Indian fixed-income assets highly attractive to global investors. **The Domestic Shield (DIIs vs FPIs)** For the first time in over a decade, domestic money has decisively outmuscled foreign flows. * **FPI Ownership:** Dropped to a 15-year low of **16.9%** (NSE-listed equities). * **DII Ownership:** Rose to **18.7%**, driven by sustained SIP inflows and insurance corp buying. This structural shift indicates that India’s market stability is now increasingly "internalized," with domestic institutions (Mutual Funds & Insurers) effectively absorbing the **USD 3.9 billion** foreign sell-off. **Currency & Macro Impact** The capital flight weighed heavily on the currency, with the Indian Rupee touching record lows near **92.00 against the USD** in recent trading sessions. The Balance of Payments (BoP) slipped into a deficit of **USD 6.4 billion** in H1 FY26, necessitating a drawdown of forex reserves to manage volatility. **Key Takeaway** While the "AI trade" dominates short-term global flows, India's **USD 81.4 lakh crore** FPI asset base remains substantial. The outlook for debt inflows remains positive due to widening yield differentials, though equity flows are expected to remain volatile until the global AI-frenzy broadens into a wider Emerging Market recovery.
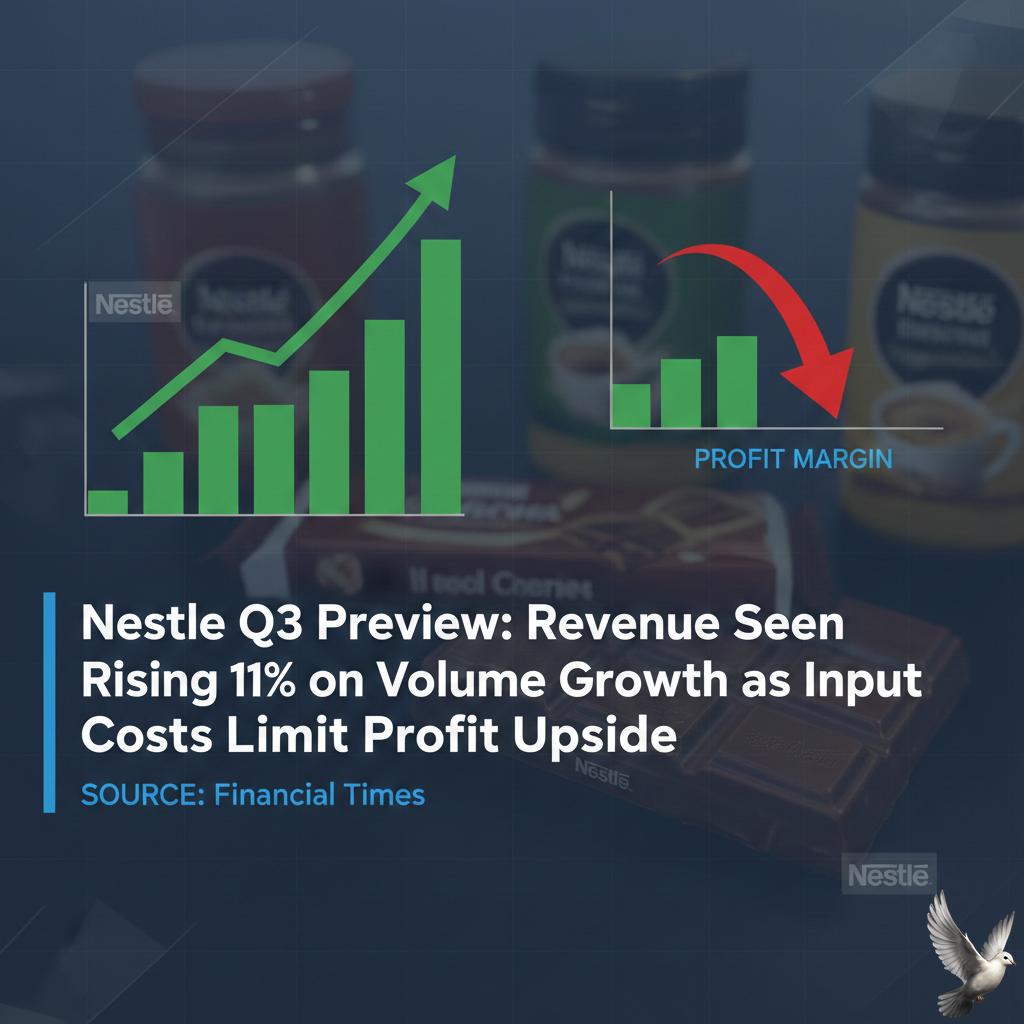
Nestle Q3 Preview: Revenue Seen Rising 11% on Volume Growth as Input Costs Limit Profit Upside
Nestlé India Market Brief: Q3 FY25 Update **Financial Performance Overview** Nestlé India reported modest growth for the quarter ending December 31, 2024 (Q3 FY25), falling short of double-digit revenue expectations. The company posted revenue from operations of **₹4,780 crore**, a **3.9%** increase year-on-year, compared to earlier projections of 10–11%. **Profitability & Margins** Net profit rose by approximately **6%** to **₹696 crore**, aligning with market estimates of steady but slow earnings expansion. Margins remain under pressure due to elevated prices for key raw materials, specifically **coffee** and **cocoa**, which reached historic highs. **Segment Drivers** * **Domestic Sales:** Grew by **3.3%**, driven largely by volume-led distribution rather than aggressive price hikes. * **Exports:** Outperformed domestic figures with a robust **21%** surge. * **Key Products:** *Nescafé*, *KitKat*, and *Maggi* led category growth, while the *Milk Products and Nutrition* segment faced softer demand. * **Channels:** E-commerce continued its strong trajectory, delivering high double-digit growth. **Stock & Corporate Action** As of late January 2026, Nestlé India stock is trading in the **₹1,288 – ₹1,300** range. The board declared a second interim dividend of **₹14.25** per share, bringing the total interim dividend for the fiscal year to **₹17** per share. **Strategic Outlook** Management maintains a cautious stance on pricing to protect volume growth amid urban consumption slowdowns. The focus remains on penetration-led expansion in Tier-2 and Tier-3 markets, with rural demand showing early signs of gradual recovery.

UK 10-Year Gilt Yields Reach Two-Month High Following Fed Rate Hold
**Global Bond Market Brief: January 30, 2026** **Yields Edge Higher Following Fed Hold** British government bond yields climbed on Thursday, with the benchmark **10-year Gilt** yield touching **4.52%**. This marks a fresh multi-month high, tracking upward momentum in U.S. markets after the Federal Reserve opted to maintain its current policy stance. **Key Market Drivers** * **Federal Reserve Decision:** On Wednesday, the U.S. central bank kept the target range for the federal funds rate unchanged at **3.50%–3.75%**. * **Powell's Stance:** Chair Jerome Powell cited "somewhat elevated" inflation as a reason for caution, dampening immediate hopes for aggressive rate cuts. * **US Treasury Reaction:** The **10-year U.S. Treasury** yield rose to **4.25%**, its highest level in over a week, influencing global fixed-income sentiment. **UK Outlook** The Bank of England, currently holding its base rate at **3.75%**, faces similar pressures. Investors are now looking toward the BoE's upcoming February meeting for cues on whether domestic inflation data will allow for further easing or if rates will remain restrictive alongside the U.S. **Market Snapshot** * **UK 10-Year Gilt:** ~4.52% * **US 10-Year Treasury:** ~4.25% * **Fed Funds Rate:** 3.50%–3.75% * **BoE Base Rate:** 3.75%

Eurozone Bond Yields Steady Amid ECB Euro Strength Concerns
The divergence between trans-Atlantic central banks continues to define global fixed-income markets. Euro zone bond yields remained largely anchored this week, mirroring the persisting uncertainty surrounding the economic trajectory of the bloc and the potential for preemptive monetary action from Frankfurt. The benchmark **10-year German Bund** yield settled near **2.84%**, showing slight downside pressure but maintaining a tight range near recent highs. This cautious bond behavior reflects the dual pressures facing the European Central Bank (ECB): sluggish growth data countered by stubborn services inflation. The core challenge for the Eurozone economy remains the uneven and anemic growth picture. Recent sentiment indicators suggest a slow-motion recovery, yet manufacturing output across the bloc continues to struggle for momentum. Despite this fragility, labor markets remain surprisingly resilient, preventing a severe downturn in consumption. This resilience in employment is crucial because it helps keep wage growth elevated. Coupled with stabilizing energy prices, this wage pressure feeds directly into the services sector, where inflation has proven stickier than initially forecast. Current projections suggest Eurozone inflation, though moderating, is still hovering near the **2.1%** mark for the coming year. A core concern for European policymakers is the appreciation of the common currency. The euro is trading robustly against the dollar, hovering near **1.1968**. This notable strength acts as a significant drag on imported inflation, intensifying internal debate over whether the ECB can afford to maintain its current interest rate stance. The **Deposit Facility Rate sits at 2.00%**, with the **Main Refinancing Rate at 2.15%**. While a stronger euro traditionally helps curb inflation, market analysts suggest the appreciation is currently driven more by external factors, particularly shifts in U.S. dollar positioning, rather than fundamental Eurozone economic outperformance. This "external driver" narrative slightly mitigates the currency's power to force the ECB into an imminent rate cut decision. Nonetheless, officials are reportedly alert to the risk that sustained euro strength, particularly if the currency tests the **1.21** level, could push internal inflation forecasts meaningfully below the **2%** target. Across the Atlantic, the U.S. Federal Reserve has kept its policy rates unchanged, maintaining the target range for the Federal Funds Rate at **3.5% to 3.75%**. This decision followed recent statements from Chair Powell indicating that rate cuts are currently off the table as the U.S. economy demonstrates robust resilience. The Fed is prioritizing patience. The firm stance from the Fed caused a modest uptick in long-term U.S. rates. The **10-year Treasury yield** edged higher to stand around **4.27%**, widening the spread against German debt. This yield divergence reinforces the structural bias toward dollar strength. The better-than-expected U.S. economic outlook continues to limit the Federal Reserve’s urgency to ease policy. In the sovereign debt arena, the risk premium demanded for holding non-core Eurozone debt remains relatively contained. The spread between the German Bund and the **10-year Italian BTP** is holding steady, reflecting investor confidence in the ECB's mechanisms to prevent fragmentation, even as rate cuts remain distant. Market focus has now shifted entirely to the timing of the first rate move, with the next ECB decision set for early February. The prevailing market view is that any ECB cut will likely be modest and data-dependent, moving away from the aggressive easing priced in late last year. The Fed, having confirmed a hold, is expected to remain patient through the first half of the year. This policy divergence ensures that Eurozone bond yields remain hypersensitive to every major economic data release from both sides of the ocean.

Gillette India Profit Rises on Demand for Grooming Products
**Market Brief: Gillette India Q3 Earnings & Strategic Update** **Date:** January 30, 2026 **Subject:** Quarterly Performance (Period Ended December 31, 2025) **Executive Summary** Gillette India delivered a strong financial performance for the third quarter of FY26 (ended December 31, 2025), characterized by significant double-digit growth in both top and bottom lines. The company announced a substantial interim dividend, reflecting robust cash flows and confidence in its grooming portfolio. **Key Financial Highlights** * **Net Profit Surge:** Profit After Tax (PAT) climbed to **₹172.4 crore**, marking a sharp **37% increase** year-on-year (YoY). * **Revenue Growth:** Revenue from operations grew **15.2%** YoY to **₹790 crore**, driven by strong demand in the core grooming business. * **Operational Efficiency:** EBITDA margins expanded significantly to **31.4%** (up from 26.6% in the prior year), supported by a favorable product price-mix and cost productivity. * **Dividend Payout:** The Board declared a total interim dividend of **₹180 per equity share**. This includes a one-time special dividend of **₹60**, with the record date set for **February 4, 2026**. **Segment Performance** * **Grooming:** The core business remains the primary growth engine, contributing the bulk of revenue (approx. **₹647 crore**). Growth was fueled by a mix of volume uptake and premiumization in the razors and blades category. * **Oral Care:** The segment recorded steady revenue of **₹143 crore**, maintaining its market position despite a competitive landscape. **Market Context & Stock Action** * **Stock Trend:** Following the announcement, Gillette India shares saw positive traction, trading in the **₹8,160 – ₹8,300** range. * **Valuation:** The stock currently trades at a Price-to-Earnings (P/E) ratio of approximately **44x–48x**, aligning with premium FMCG sector valuations. * **Investor Sentiment:** Despite the strong quarterly results and high dividend yield, the stock has seen a consolidation phase over the last 12 months (down approx. **6%**), suggesting that the market had already priced in moderate growth expectations prior to this breakout quarter. **Operational Outlook** Management attributes the strong quarter to its "integrated growth strategy," focusing on: 1. **Product Superiority:** Continuous innovation in the Mach3 and Fusion franchises. 2. **Constructive Disruption:** Improving retail execution and supply chain agility. 3. **Cost Discipline:** Productivity interventions that have successfully offset inflationary pressures. The declared dividend payout (to be distributed by **February 26, 2026**) signals a strong commitment to returning excess cash to shareholders while maintaining sufficient liquidity for future capex.

Madhusudan Kela on Indian Market Valuations and Budget Fiscal Outlook
**Market Brief: India Outlook** **Headline: Consolidation, Fiscal Prudence & The Stock Picker's Edge** **Market Pulse** The Indian equity markets are navigating a phase of healthy consolidation. As of late January 2026, the benchmark **Nifty 50** is hovering around the **25,400** level, while the **Sensex** holds steady near **82,500**. The broader market has witnessed a sharp correction, with Small-cap indices correcting approximately **7-8%** and Mid-caps down **4-6%** in January alone. This volatility, driven by global cues and valuation readjustments, is creating distinct entry points for disciplined investors. **Strategic Outlook** Market veteran Madhusudan Kela maintains a constructive stance, emphasizing that the structural "India Story" remains intact. He anticipates continued **fiscal discipline** from the government in the upcoming Union Budget, balancing growth objectives with deficit targets. The focus is shifting from broad-based rallies to a "stock picker's market," where differentiation based on earnings quality and management pedigree is critical. **Key Opportunities** * **Valuation Reset:** The recent correction in broader markets has cooled overheating valuations. Individual stocks in the Small and Mid-cap space are now emerging as attractive value propositions after a period of consolidation. * **Sector Focus:** Confidence remains high in **Corporate India**, particularly in sectors aligned with government capex and domestic consumption. Public Sector Undertakings (PSUs), Banking, and Infrastructure are highlighted as areas offering long-term resilience. * **Investment Approach:** Investors are advised to utilize this volatility as an ally. The recommendation is to pivot towards selective, high-conviction bets rather than chasing momentum, aiming for a **14-15%** compounding return over the long cycle. **Macro Backdrop** The Economic Survey projects a robust GDP growth of **6.8% to 7.2%** for the next fiscal year, reinforcing steady domestic fundamentals despite global headwinds. While FII flows have been volatile, domestic liquidity remains a strong pillar of support. [Madhusudan Kela Market Outlook](https://www.youtube.com/watch?v=PJzkv80XSs4) This video features Madhusudan Kela sharing his detailed outlook for the Indian markets at a recent summit, explaining why he remains convinced about the long-term equity story despite short-term volatility. http://googleusercontent.com/youtube_content/0

Adani Power Q3 Consolidated Profit Falls 19% to Rs 2,480 Crore; Revenue Down 9%
**Adani Power Q3 FY26 Market Brief** **Financial Performance** Adani Power Limited has released its consolidated results for the quarter ending December 31, 2025. Contrary to previous growth trends, the energy major reported a **15.4% year-on-year decline** in consolidated net profit to **₹2,488 crore**, down from ₹2,940 crore in the same period last year. This dip is primarily attributed to lower one-time prior period income. **Revenue & Margins** Total continuing revenue witnessed a **5.3% decrease**, standing at **₹12,717 crore** compared to ₹13,434 crore in Q3 FY25. The company cited reduced merchant power rates and lower realization from long-term Power Purchase Agreements (PPAs) as key factors. Despite the top-line contraction, EBITDA remained resilient at **₹4,636 crore**, showcasing effective cost management. **Operational Highlights** * **Capacity Expansion:** Secured a major **3,200 MW** long-term PPA with Assam Power Distribution Company (APDCL), boosting tied-up capacity to nearly **11.7 GW**. * **Fundraising:** Successfully raised **₹7,500 crore** via AA-rated Non-Convertible Debentures (NCDs) to fuel future capacity growth and working capital needs. * **Volume Growth:** Power sale volume rose marginally to **23.6 Billion Units (BU)**, overcoming soft demand caused by an extended monsoon. **Market Reaction** Following the announcement on January 29, 2026, Adani Power shares have faced downward pressure, trading in the **₹133 – ₹135** range. The stock has seen a correction of approximately **10%** over the last few trading sessions, reflecting investor caution amidst the dampened quarterly earnings. **Outlook** Management remains optimistic, highlighting that **90%** of operational capacity is now secured under long-term contracts. The focus remains on aggressive capacity expansion, with ongoing projects in Mahan, Raipur, and Raigarh progressing on schedule.
12 Top FY25 Performers Decline Up to 55% in FY26
**Market Brief: The Great Reversal of FY26** **Date:** January 30, 2026 **Topic:** FY25 Multibaggers Turned FY26 Laggards A distinct shift in market sentiment has defined the transition from FY25 to FY26. While the previous fiscal year was characterized by a broad-based rally where small-cap stocks comfortably outperformed benchmarks, FY26 has introduced a sharp reality check. As of January 2026, the broader market has stagnated. Benchmark indices like the Sensex have managed a modest **6%** gain this fiscal year, but the small-cap segment has largely stalled. Beneath this calm surface lies significant churn: stocks that delivered triple-digit returns in FY25 are now among the year's worst performers, shedding **30% to 55%** of their value. **The Reversal List: From Boom to Bust** Data confirms that at least 12 prominent stocks have flipped from "multibagger" status in FY25 to deep red in FY26. These companies, primarily in the manufacturing, energy, and industrial sectors, have seen substantial wealth erosion despite their previous momentum. **Transformers & Rectifiers (India)** Once a darling of the power sector, this stock has been the hardest hit. After a massive surge of **171%** in FY25, it has corrected by **55%** in FY26, sliding from highs near **₹536** to current levels around **₹242**. **The Anup Engineering** Following a stellar FY25 where it rallied **120%**, the stock has faced intense selling pressure. It is down **49%** year-to-date, trading near **₹1,775**, a steep drop from its peak of **₹3,477**. **Balu Forge Industries** This industrial forging company saw its stock skyrocket **212%** last fiscal year. However, valuations have normalized aggressively, with the stock correcting **44%** in FY26 to trade at **₹356**. **PG Electroplast** One of the biggest gainers of the previous cycle, PG Electroplast delivered an eye-watering **453%** return in FY25. The reversal has been equally sharp, with the stock down **41%** this fiscal year, eroding a significant portion of those gains. **Shakti Pumps (India)** Another major beneficiary of the FY25 theme, Shakti Pumps rallied **340%** last year. In FY26, the trend reversed, dragging the stock down by **35%**. **TCPL Packaging** After doubling investor wealth with a **104%** gain in FY25, the stock has slipped **43%** in the current fiscal year. **Pokarna** Known for its engineered stone surfaces, Pokarna surged **200%** in FY25. It has since given up significant ground, falling **42%** in FY26. **Sector Impact and Other Laggards** The correction has not been limited to a single niche. It spans renewable energy, consumer durables, and industrial machinery. **Refex Industries** and **EPACK Durable** have both corrected by approximately **39%** this year after delivering triple-digit growth in FY25. Similarly, **Websol Energy System**, which rode the renewable energy wave to a **145%** gain last year, is down **31%** in FY26. Even the agricultural sector has felt the heat, with **Kaveri Seed Company** slipping **32%** after a strong 100%+ rally in the previous fiscal. **Key Takeaway** The divergence between FY25 and FY26 highlights a classic market rotation. Capital has moved away from high-beta, high-valuation small-caps toward the relative safety of large-cap peers. The aggressive corrections in these former winners serve as a reminder of the volatility inherent in momentum investing—where rapid expansion in multiples can be followed by equally rapid mean reversion when earnings growth fails to keep pace with heightened expectations.

Q4 Earnings, Budget, and Trade Deals Identified as Key Market Triggers
**Market Brief: Pre-Budget Rally & Economic Optimism** **Current Snapshot** Indian equity benchmarks staged a smart recovery today, buoyed by a robust Economic Survey and positive global cues. The **Nifty 50** reclaimed the **25,400** mark, closing at **25,419** (+76 points), while the **Sensex** settled at **82,566** (+222 points). Broader markets participated in the move, with the Nifty Midcap index rising **0.32%**, signaling improved risk appetite ahead of the Union Budget. **Key Drivers & Trends** * **Economic Survey Boost:** The Economic Survey 2025-26, tabled today, projects a solid **7%** GDP growth for the coming fiscal year. It highlights India as an "oasis of stability" amid global uncertainties, reinforcing investor confidence. * **EU Trade Deal:** Sentiment remains supported by the landmark India-EU trade agreement signed earlier this week, which is expected to unlock significant export opportunities for textiles, chemicals, and machinery. * **Fed Pause:** Global risk sentiment stabilized after the US Federal Reserve maintained status quo on interest rates, aligning with market expectations. **Institutional Activity** Foreign Institutional Investors (FIIs) remain cautious, registering a net outflow of over **₹3,000 crore** in recent sessions, continuing their "sell on rise" strategy. However, Domestic Institutional Investors (DIIs) continue to anchor the market with consistent buying, absorbing the foreign supply and stabilizing liquidity. **Sectoral Performance** * **Leaders:** **Metals**, **Banking**, and **Realty** stocks led the rally today. Companies like **Tata Steel** (+4.3%) and **Vedanta** (+3.9%) saw strong buying interest. * **Pharma & Exports:** The pharma sector remains a long-term structural play, with exports hitting a record **$30.5 billion** in FY25. However, stock-specific action was mixed today, with names like **Cipla** seeing minor profit booking. * **Auto:** **Tata Motors** faced pressure, dropping **3.3%** after reporting a **48%** decline in Q3 net profit, highlighting the varied earnings performance this season. **Outlook** The market focus now shifts entirely to Sunday, **February 1**, for the Union Budget 2026 announcements. Traders are eyeing fiscal consolidation targets and capex allocations. With volatility (India VIX) cooling to **13.37**, the near-term texture is "buy on dips," provided **25,300** holds as a key support level for the Nifty.

Canara Bank Q3 Net Profit Rises 26% to Rs 5,155 Crore; NII Up 1%
**Canara Bank Q3 FY26: Robust Profit Growth & Asset Quality Boost** **Overview** Canara Bank has delivered a strong operational performance for the quarter ended December 31, 2025. The public sector lender reported a significant **25.6%** year-on-year surge in standalone net profit, reaching **₹5,155 crore**, surpassing market expectations. This growth was fueled by higher operating income and a sharp reduction in provisions. **Operational Performance** * **Operating Profit:** Rose **16%** year-on-year to **₹9,119 crore**, aligning with the bank's consistent focus on core efficiency. * **Net Interest Income (NII):** Saw a marginal increase of **1%** to **₹9,252 crore**, reflecting a challenging interest rate environment and tighter margins. * **Non-Interest Income:** A key driver this quarter, supporting the bottom line significantly. **Business Growth & Credit Expansion** * **Global Business:** Maintained a healthy trajectory with **13%** year-on-year growth. * **Deposits & Advances:** Both segments witnessed parallel growth of approximately **13%**, indicating a balanced sheet expansion. * **Sector Leaders:** Credit offtake was primarily driven by the Retail, Agriculture, and MSME (RAM) segments. Retail loans notably outperformed, surging **31%**, underscoring strong consumer demand. **Asset Quality Improvement** The bank demonstrated remarkable improvement in its asset quality metrics: * **Gross NPA:** Declined sharply to **2.08%** (from 3.34% a year ago). * **Net NPA:** Improved to **0.45%**, reflecting cleaner books and effective recovery mechanisms. * **Provision Coverage Ratio (PCR):** Stood robust at **94.19%**, providing a strong buffer against potential stress. **Market Reaction** Despite the stellar profit numbers, the stock faced selling pressure, trading down **3-4%** following the announcement. Investors reacted to the muted NII growth and broader market nervousness ahead of the upcoming Union Budget. The "sell on news" sentiment prevailed despite the beat on profitability. **Next Step:** I can analyze the Q3 performance of peer PSU banks like Bank of Baroda or PNB to provide a comparative sector outlook for you.

Neeraj Dewan Shares Pre-Budget Outlook for PSU Banks and Power Stocks
**Market Brief: Pre-Budget Sentiment & Sector Strategy** **Date:** January 29, 2026 **Executive Summary** Investor sentiment remains guarded as markets approach the Union Budget on February 1, 2026. Volatility has increased, driven by sustained Foreign Institutional Investor (FII) outflows. Data up to January 22, 2026, indicates FIIs have offloaded approximately **₹36,591 crore** in Indian equities this month alone, contributing to a cautious trading environment. Despite this liquidity pressure, expert Neeraj Dewan advises a strategy of selective accumulation in key growth sectors. **Sectoral Outlook & Strategy** **Infrastructure & Capital Goods** * **Strategy:** Selective Buying * **Market Context:** The capital goods sector continues to show resilience, supported by a **14.1%** surge in production figures reported recently. While broader markets have corrected, the underlying fundamentals in infrastructure remain robust due to government spending anticipation. Investors are advised to focus on companies with strong order books rather than chasing momentum. **PSU Banks** * **Strategy:** Buy on Dips * **Market Context:** Public Sector Banks (PSUs) are currently outperforming the broader market. The Nifty PSU Bank index has gained approximately **11%** in January 2026, contrasting sharply with other sectors. Improved asset quality and a reduction in Non-Performing Assets (NPAs) to multi-year lows have strengthened the case for this sector, validating the expert view on attractive valuations. **Power (Generation & T&D)** * **Strategy:** Constructive / Overweight * **Market Context:** The outlook for Power Transmission & Distribution (T&D) and generation remains positive. Analysts project a strong recovery in power demand for 2026, driven by data center expansion and EV adoption. Major players like **NTPC** and **JSW Energy** have seen renewed interest, aligning with the advice to seek opportunities in this space. **NBFCs** * **Strategy:** Caution / Avoid * **Market Context:** The Non-Banking Financial Company (NBFC) sector faces headwinds from regulatory scrutiny and rising cost of funds. While some players like IIFL Finance are signaling confidence through dividends, the broader sector outlook remains mixed. Caution is advised as growth may be range-bound compared to the banking peers. **Real Estate** * **Strategy:** Long-term Accumulation * **Market Context:** The real estate sector has witnessed a sharp correction, with the Nifty Realty index down over **12%** in January 2026—one of its worst starts in a decade. Stocks like Signature Global have seen declines of up to **28%**. This steep correction offers a strategic entry point for long-term accumulation, as the fundamental demand for housing remains intact despite near-term volatility. **Key Takeaway** Volatility is expected to persist through the Budget session. The recommended approach is **defensive yet opportunistic**: protect capital by avoiding high-valuation NBFCs, while using dips to enter infrastructure, PSU banks, and beaten-down real estate stocks for the long haul.
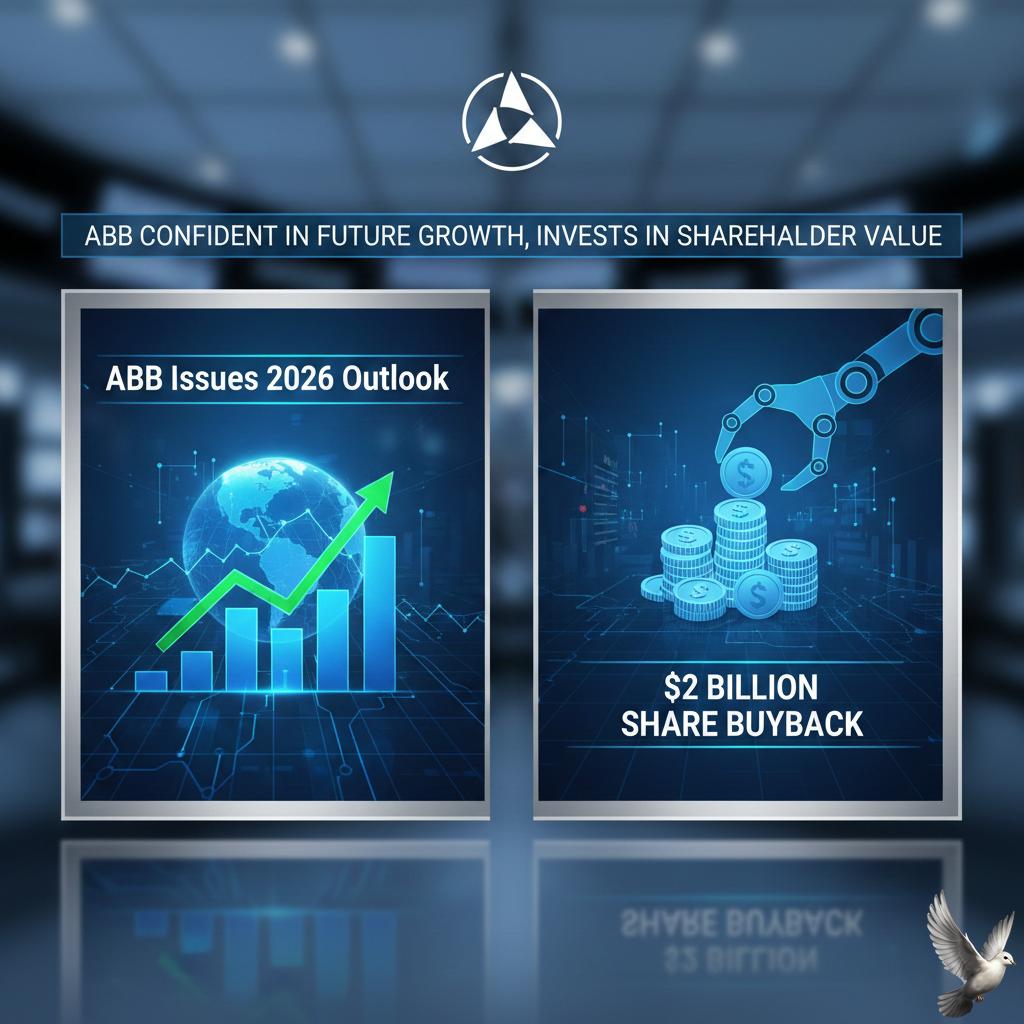
ABB Issues 2026 Outlook and Announces $2 Billion Share Buyback
**ABB CRUSHES Q4 FORECASTS, EYES RECORD 2026 AMID AI & INFRASTRUCTURE BOOM** Swiss engineering giant ABB has delivered a standout financial performance to close 2025, shattering earnings expectations and signaling strong momentum for the year ahead. Driven by surging demand in artificial intelligence, rail, and marine sectors, the company achieved record-breaking figures and announced a significant return of capital to shareholders. **Record-Breaking Q4 Performance** ABB’s fourth-quarter results highlight exceptional operational execution. The company reported a **36% surge in orders** to **$10.3 billion**, marking the first time quarterly bookings have exceeded the $10 billion threshold. Revenue for the period climbed **13%** to **$9.1 billion**, while basic earnings per share jumped **30%** to **$0.70**. For the full year, ABB posted record revenues of **$33.2 billion** and total orders of **$36.8 billion**. Profitability also improved, with the Q4 operational EBITA margin widening to **17.6%**. **Strategic Capital Allocation** Reflecting its robust balance sheet and cash flow generation, ABB announced a new **$2 billion share buyback program**, set to run until January 2027. Additionally, the Board proposed an increased dividend of **CHF 0.94** per share, up from CHF 0.90 the previous year. **AI and Sector-Specific Catalysts** The company’s growth is being supercharged by the global AI infrastructure build-out. ABB is capitalizing on the high power requirements of data centers, with partnerships—including collaborations with Nvidia—positioning it as a key supplier for next-generation power systems. Beyond tech, traditional infrastructure remains a powerhouse. High demand continues across **rail transport, ports, and marine electrification**, contributing to a broad-based book-to-bill ratio of **1.14**, indicating a healthy pipeline of future work. **Bullish 2026 Outlook** Looking ahead, ABB projects continued expansion. For the first quarter of 2026, the company anticipates comparable revenue growth in the **7–10%** range. For the full year, guidance targets revenue growth between **6–9%** with further margin improvements. CEO Morten Wierod emphasized that the company is "positioned in markets with powerful long-term trends," expressing confidence that 2026 will deliver another series of all-time high results. Following the release, ABB shares rallied sharply, reflecting investor optimism in the industrial giant’s trajectory.
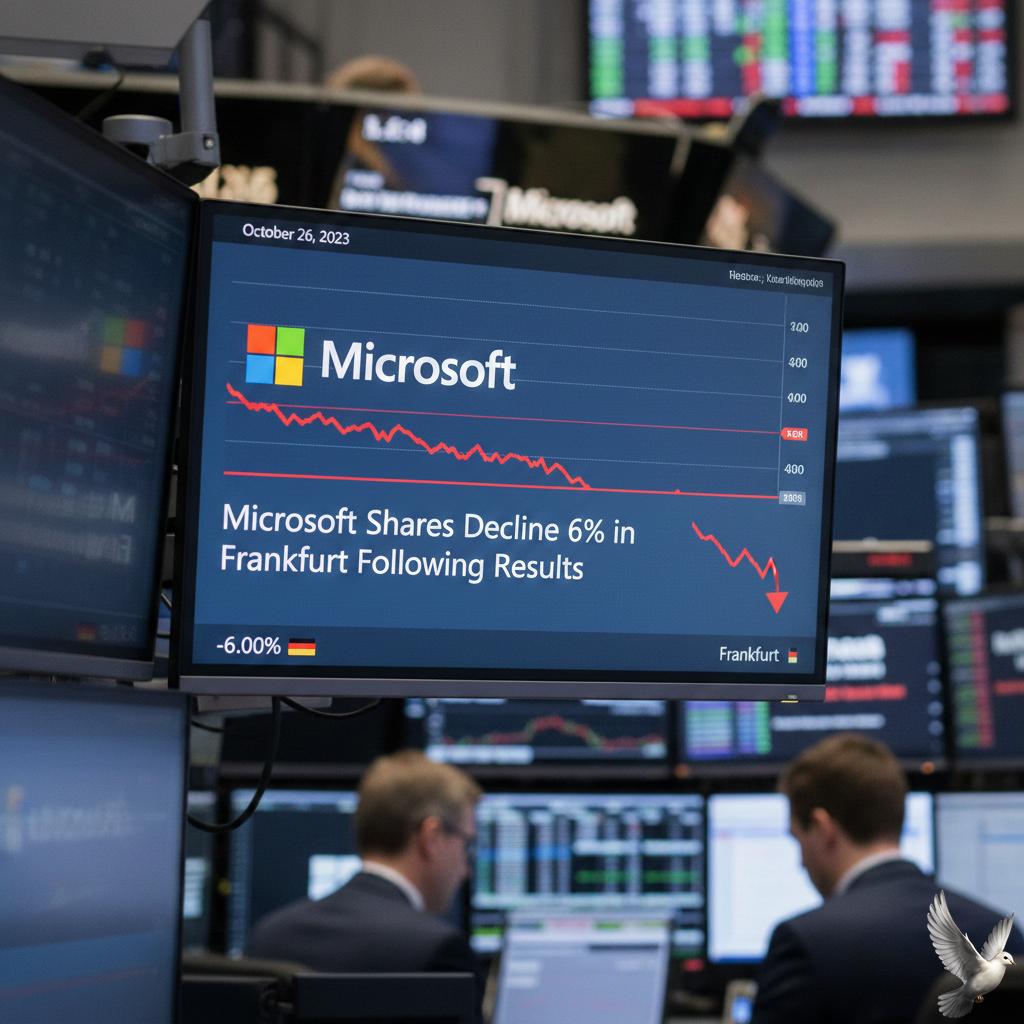
Microsoft Shares Decline 6% in Frankfurt Following Results
**Market Brief: Microsoft Slides on AI Spend Jitters** **Frankfurt / New York** — Microsoft (MSFT) shares have come under significant pressure, dropping over **6%** in Frankfurt trading and US pre-market action today, January 29, 2026. Despite beating top-line estimates in its Fiscal Q2 2026 report, investor sentiment soured over an unprecedented surge in capital expenditures and concerns regarding the pace of cloud acceleration. **Key Financial Highlights** * **Revenue:** **$81.3 billion** (up **17%** YoY), surpassing expectations of ~$80.3 billion. * **EPS (Non-GAAP):** **$4.14**, comfortably beating analyst forecasts of ~$3.93. * **Net Income:** **$38.5 billion** (GAAP), boosted significantly by gains from the OpenAI investment. **The Sticking Point: Massive AI CapEx** The sell-off is primarily driven by "sticker shock" regarding the cost of the AI arms race: * **Capital Expenditures:** Skyrocketed to **$37.5 billion** for the quarter. * **Growth:** A staggering **66%** increase year-over-year. * **Focus:** The vast majority of this spend is allocated to AI infrastructure and cloud data centers to meet demand constraints. **Cloud Performance** While growth remains robust, it failed to ignite the "beat-and-raise" momentum investors hoped for: * **Azure Growth:** Reported at **39%** (constant currency). * **Market Reaction:** While meeting consensus, the lack of a sharper acceleration—combined with the massive spending bill—has fueled worries about the timeline for Artificial Intelligence returns (ROI). **Investor Sentiment** The narrative has shifted from "growth at all costs" to "show me the returns." With total AI-related spending crossing the **$200 billion** mark since FY2024, Wall Street is increasingly scrutinizing the profit margins of these massive infrastructure bets. **Current Trading** * **Frankfurt (MSF):** Down **~6.2%** * **US Pre-market:** Indicated lower, testing support levels near **$450**.
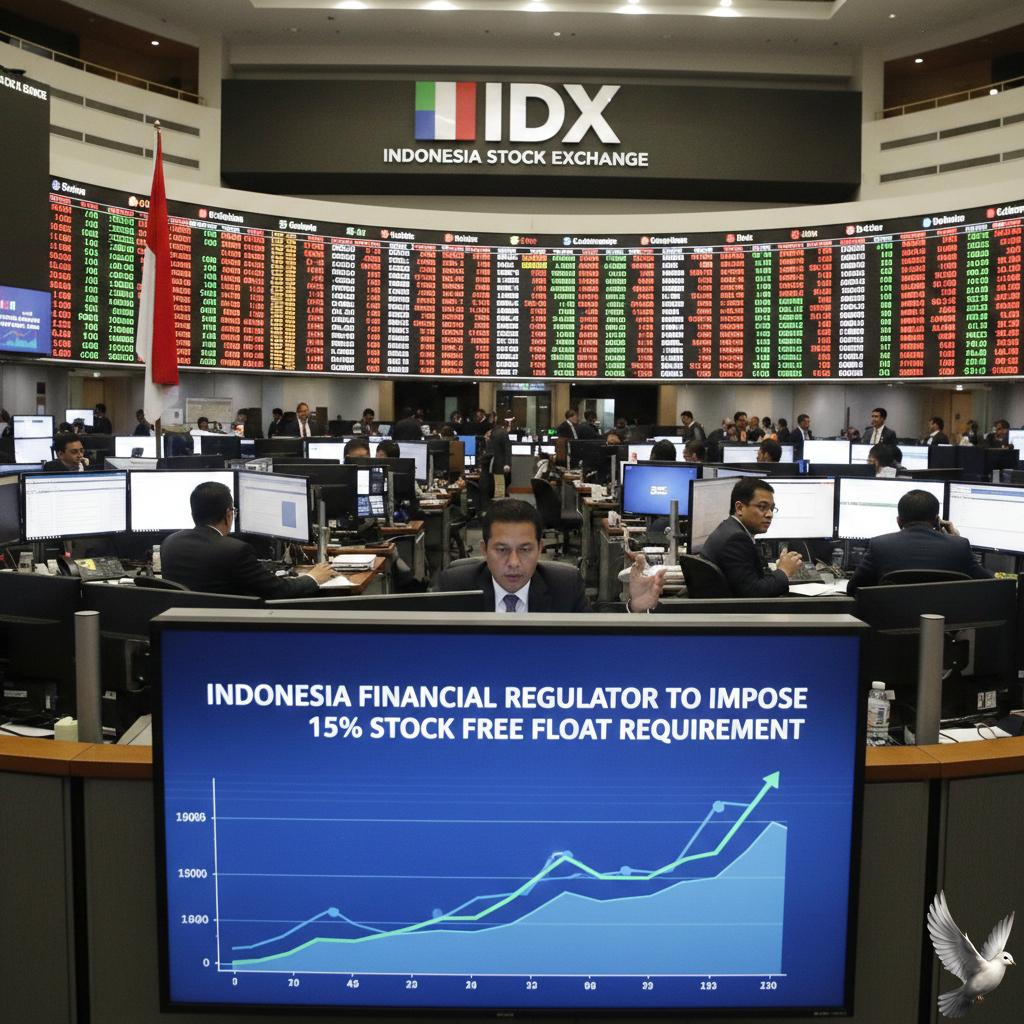
Indonesia Financial Regulator to Impose 15% Stock Free Float Requirement
**Indonesia Market Brief: Regulatory Overhaul Amid MSCI Pressure** **Context & Recent Developments** Indonesia’s financial landscape is undergoing a critical regulatory shift following a severe market correction in late **January 2026**. The **Financial Services Authority (OJK)** and the **Indonesia Stock Exchange (IDX)** are fast-tracking reforms to address transparency concerns raised by index provider **MSCI**, which recently froze its rebalancing for Indonesian securities. **Market Impact** * **Sharp Decline:** The **Jakarta Composite Index (JCI)** experienced extreme volatility, plunging approximately **7–8%** in late January, triggering multiple trading halts. * **Current Levels:** As of **January 29, 2026**, the JCI hovered near **8,167 points**, erasing previous gains as foreign capital outflows accelerated. * **Sector Hit:** Heavyweight stocks anticipated for MSCI inclusion, such as **Bumi Resources** and **Petrosea**, saw double-digit declines, reflecting acute investor anxiety over potential investability downgrades. **Regulatory Response** * **New Float Requirement:** To align with international standards, the IDX is raising the minimum free float requirement for listed companies from **7.5%** to **15%**. This measure aims to increase liquidity and reduce stock manipulation risks. * **Transparency Measures:** The **OJK** and **KSEI** (Central Securities Depository) have begun publishing granular share ownership data, specifically distinguishing between strategic and public holdings to satisfy MSCI’s visibility demands. * **Oversight:** OJK Chairman **Mahendra Siregar** has taken a direct role in overseeing these reforms, emphasizing a "quick and effective" resolution to restore confidence. **Outlook & Deadlines** The stakes remain high. **MSCI** has set a review deadline for **May 2026**. Failure to demonstrate significant improvement in market accessibility could result in Indonesia being downgraded from **Emerging Market** to **Frontier Market** status. Such a reclassification would likely trigger substantial passive fund outflows, estimated by analysts to be in the range of **$2–$5 billion**. Authorities remain optimistic that the expedited reforms will satisfy global stakeholders before the next index review cycle. *** **Next Step**

Balu Forge Industries Shares Hit 10% Upper Circuit
**Market Brief: Balu Forge Industries Enters NATO Supply Chain** **Strategic Milestone Drives Stock Surge** Balu Forge Industries has secured a pivotal position in the global defence sector following its formal induction into the North Atlantic Treaty Organization (NATO) supply chain. This development, announced on **January 29, 2026**, triggered an immediate and sharp market reaction, with shares locking into a **10% upper circuit** at **₹391.90** on the NSE. **Deal Specifics & Technical Capabilities** The induction mandates Balu Forge to manufacture and supply high-precision, mission-critical defence components to NATO member states. The primary focus of this mandate includes: * **Artillery Shell Bodies:** Production of high-specification shells essential for modern artillery systems. * **Complex Forged Components:** Delivery of precision-engineered parts requiring advanced metallurgical standards. This selection validates the company’s specialized manufacturing capabilities, specifically its use of closed-die forging and advanced **7-axis and 11-axis CNC machining**. These processes ensure the extreme precision and durability required for defence-grade applications, particularly in withstanding high-impact stress and thermal fluctuations common in battlefield environments. **Market Reaction & Price Action** The market responded aggressively to the news, reversing a recent bearish trend. Prior to this announcement, the stock had been under pressure, recently testing a **52-week low** near **₹348**. The confirmation of the NATO partnership sparked a **V-shaped recovery**, driven by heavy buying interest that left no sellers on the counter by mid-day. Investors have repriced the stock to reflect the long-term revenue visibility offered by this partnership. Unlike typical cyclical orders, NATO supply contracts often carry higher margins and stickier client relationships due to the rigorous qualification barriers. **Financial Backdrop & Fundamental Strength** The bullish sentiment is further supported by the company’s recent financial performance. In the quarter ending September 2025, Balu Forge reported a **35.50%** rise in consolidated net profit to **₹65.04 crore**, alongside a **34.38%** increase in net sales to **₹299.51 crore**. This financial stability provides the necessary capital base to execute large-scale defence orders without immediate dilution risks. The company’s integrated business model—encompassing forging, heat treatment, and machining under one roof—allows it to control costs while meeting the stringent quality audits required by Western defence alliances. **Strategic Implications** This development marks a significant shift in India’s role within the global defence industrial base. By successfully penetrating the NATO supply network, Balu Forge effectively moves up the value chain from a component manufacturer to a strategic partner in global security infrastructure. The deal opens doors to ancillary opportunities across the aerospace and industrial defence sectors in Europe and North America. It aligns directly with the "Make in India for the World" initiative, showcasing that Indian precision engineering can meet the highest global standards. **Forward Outlook** With the induction complete, the focus now shifts to the execution phase. The ability to scale production of artillery shells and complex forgings will be the key driver for sustained earnings growth in upcoming quarters. Market participants will likely monitor the order book inflow closely to gauge the quantitative impact of this alliance on FY27 revenue projections.

Defence Sector in Focus Amid Budget Expectations
**Market Brief: Indian Defence Sector Outlook (January 2026)** **Budget Expectations & Fiscal Outlook** As the Union Budget announcement approaches in February 2026, market sentiment is heavily influenced by proposals indicating a **20–25%** increase in defence allocations for the upcoming fiscal year (FY27). This potential surge builds upon the **₹6.81 lakh crore** baseline established in FY26, which itself marked a **9.5%** year-on-year rise. Analysts project capital outlay could climb from the current **₹1.8 trillion** to between **₹2.1 trillion and ₹2.3 trillion**. This expansion is aimed at accelerating modernization programs, specifically for fighter aircraft, submarines, and advanced missile systems. **Market Performance & Investor Sentiment** The Nifty India Defence index remains a focal point for investors, recording a **1.3%** gain in late January trading sessions. Volatility persists as traders balance long-term optimism with tactical profit-booking. * **Top Movers:** Stocks like **Data Patterns (India)** recently surged over **8%** intraday, signaling strong appetite for defense electronics and radar segments. * **Key Players:** Public sector units (PSUs) such as **HAL** and **BEL** continue to command robust valuations, supported by order books that provide revenue visibility for the next **3–5 years**. * **Private Sector:** Private participation has expanded significantly, now accounting for approximately **23%** of total defence production, up from under 10% a decade ago. **Strategic Drivers: Exports & Indigenization** The "Make in India" initiative has yielded tangible results, with defence exports hitting a record high of **₹23,622 crore** in FY25. The government is aggressively targeting a turnover of **₹1.75 lakh crore** in defence manufacturing by FY26 end. The focus has shifted beyond assembly to deep-tech indigenization. Policy reforms now prioritize the development of intellectual property (IP) within India, particularly in: * **AI-enabled warfare systems** * **Supersonic technologies** * **Unmanned Aerial Vehicles (UAVs)** **Critical Challenges** Despite the bullish outlook, structural hurdles remain. Industry experts warn that **working capital** cycles are stretched, particularly for private SMEs integrating into the PSU supply chain. Furthermore, while order inflows are strong, execution capability is the primary risk factor. Analysts emphasize that the upcoming budget must address **R&D efficiency**, as current spending is often viewed as insufficient to support next-generation technology development without deeper government funding. **Summary** The sector is poised for a structural expansionary phase. While near-term valuations appear stretched, the anticipated **double-digit budget hike** and sustained export momentum provide a strong floor for growth through FY27.