Bullish News
Collection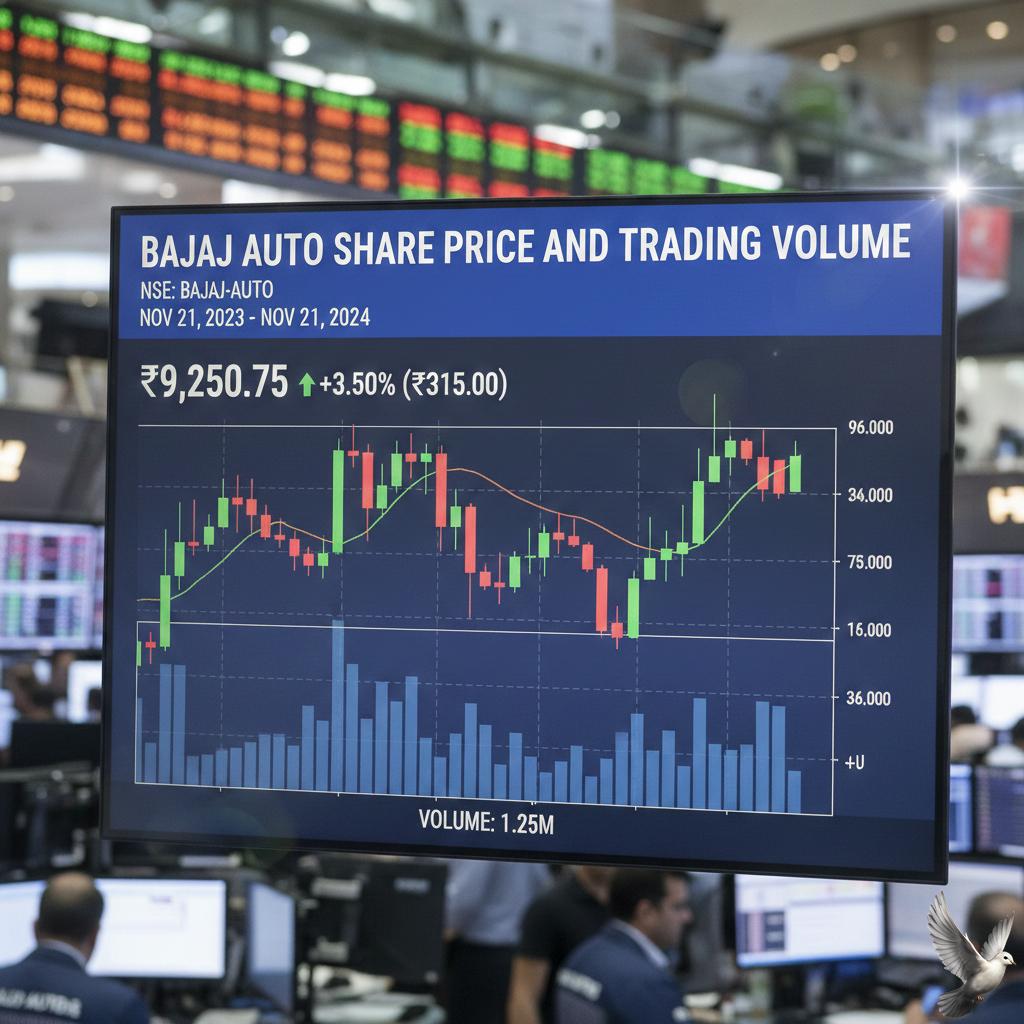
Bajaj Auto Share Price and Trading Volume
⚡ **Global Renewable Energy Market Brief: January 2026** 📈 The global clean energy transition is accelerating, despite notable headwinds in certain sectors and regions. **Total global investment in the energy transition reached a record $2.3 trillion in 2025**, an **8% rise** from the previous year. The **S&P Global Clean Energy Transition Index** (SPGTCLEN) closed on January 26, 2026, at **1164.17**, reflecting a positive trend at the start of the year. The broader renewable energy sector, as tracked by indices like the **Morningstar Global Renewable Energy Index**, staged a **sharp comeback in 2025**, posting an annual gain of **10.0%**. --- **Solar and Wind: Capacity & Costs** **Solar PV** remains the dominant force. Global capacity is expected to **more than double by 2030**, with utility-scale and distributed solar representing nearly **80%** of worldwide renewable electricity capacity expansion. India reported a significant surge in 2025, adding a record **44.5 GW** of renewable capacity. India's installed solar capacity reached **132.85 GW** by November 2025, an increase of over **41%** year-over-year. **Onshore wind** capacity additions are projected to increase **45%** over the **2025-2030** period globally. The **Nordex Group** secured a record **10.2 GW** in order intake in 2025, highlighting strong demand in this segment. Despite this strong trajectory, **global solar additions are expected to slow down temporarily in 2026** for the first time, largely due to a significant policy shift in China, the world's largest market. This shift moves from guaranteed pricing to competitive bidding. --- **The Storage and Grid Imperative** **Energy storage** is emerging as critical infrastructure. In the US, operating storage capacity reached **37.4 GW** by October 2025, marking a **32% year-to-date increase**. Another **19 GW** is currently under construction through 2026. Over half of all new US utility-scale storage capacity coming online by 2026 is **paired with solar**, creating more reliable, dispatchable power. Innovations include the displacement of older chemistries by **Lithium Iron Phosphate (LFP)** batteries and the piloting of **long-duration storage** technologies. Grid modernization is now a major constraint. The **European Commission** estimates that **€584 billion** in grid capital expenditure is needed by 2030 to support decarbonization efforts. Without substantial investment in transmission and distribution infrastructure, the deployment of renewables will be severely bottlenecked. --- **Key Market Drivers and Policy Shifts** The most significant new driver is the surge in **electricity demand from AI data centers**. Global data center power demand is expected to increase by **17% in 2026**, potentially reaching over **2,200 TWh** by 2030—roughly equivalent to India's current total electricity consumption. This creates immense demand for clean, firm power. In the US, the **Foreign Entity of Concern (FEOC) sourcing rules** take effect in 2026, posing new challenges and risks for battery and component supply chains heavily reliant on covered nations. Developers are **accelerating construction** to secure eligibility before these restrictions impact the market. **Green Hydrogen** is gaining traction, especially in China, which is becoming a global manufacturing leader. Chinese projects are projected to install **4.5 GW** of electrolyzers in 2026, with stack prices dropping significantly—to **under $100 per kilowatt**—due to fierce competition and oversupply.
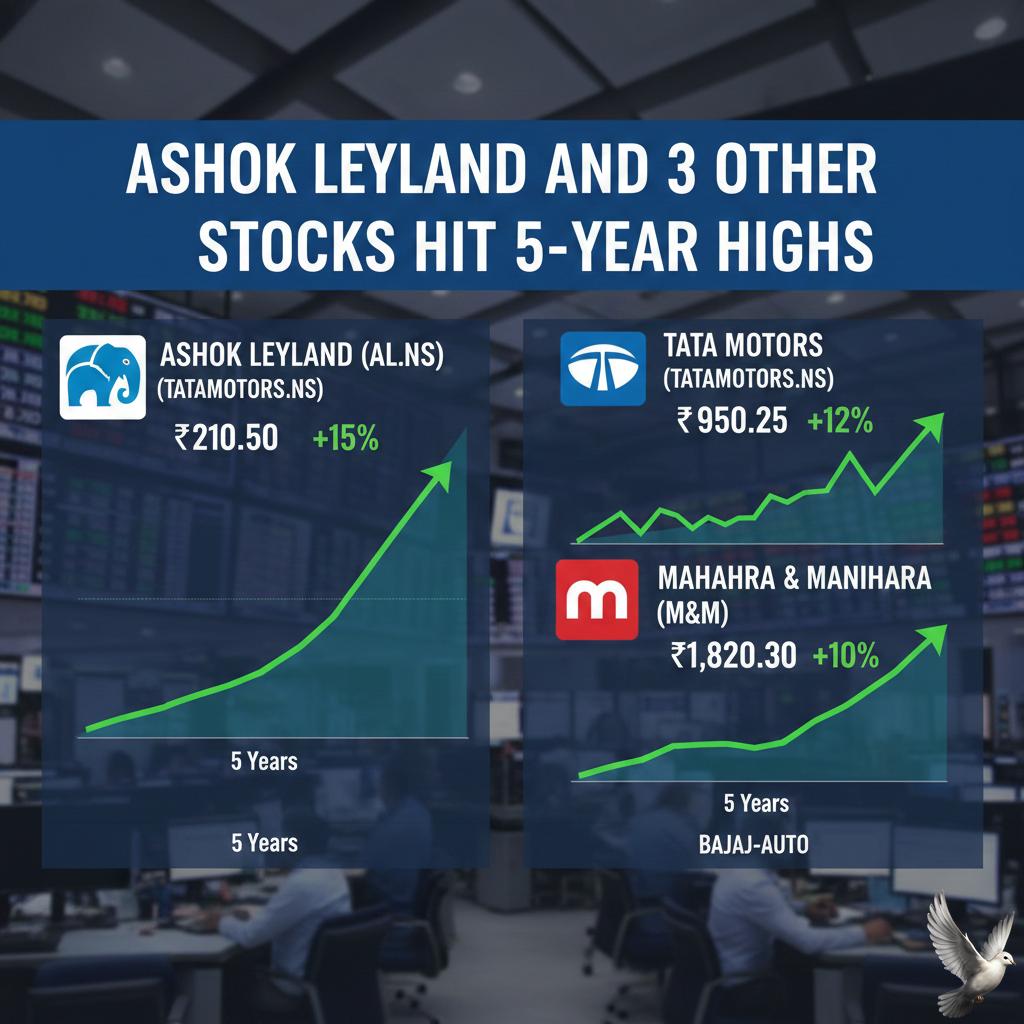
Ashok Leyland and 3 Other Stocks Hit 5-Year Highs
**Market Brief: Bearish Close masked by Select Multi-Year Highs** **Market Overview** Indian equity benchmarks ended sharply lower on **January 23, 2026**, weighed down by profit-booking and caution ahead of the Union Budget. The **Nifty 50** corrected by **0.95%** (241 points) to close at **25,048**, while the **Sensex** dropped **0.94%** (770 points) to settle at **81,537**. **Sectoral Divergence** Broader market sentiment remained weak, with volatility (India VIX) jumping over **6%** to **14.19**. Most sectors faced selling pressure, particularly Realty and Consumer Durables. However, the **Metals** sector defied the trend, emerging as the sole outlier with gains of nearly **1%**. **Bullish Momentum in Select Stocks** Despite the overarching bearish trend, specific pockets of strength emerged. Four NSE stocks with a market capitalisation exceeding **Rs 1,000 crore** recorded a **5-year swing high** at the close. Notable names displaying this resilience included **Ashok Leyland**, **APL Apollo Tubes**, and **RM Drip and Sprinklers System**. **Technical Significance** Touching a 5-year swing high signals sustained buying interest and improving trend strength, often acting as a precursor to potential longer-term performance. However, traders distinguish this from a confirmed multi-year breakout; while the former indicates testing a significant resistance level where prices historically struggle, it does not yet confirm a successful breach. **Key Data Points** * **Nifty Close:** 25,048 (-0.95%) * **Sensex Close:** 81,537 (-0.94%) * **FII Activity:** Heavy selling recorded in January, with month-to-date outflows near **Rs 26,500 crore**. * **Market Breath:** Weak, with significant cuts in Midcap (-1.5%) and Smallcap (-2%) indices. Investors remain watchful of the **25,000** psychological support level on the Nifty as geopolitical cues and budget expectations continue to drive volatility. [Stock Market LIVE Updates: Nifty & Sensex Live](https://www.youtube.com/watch?v=8jckXBDYMPA) This video provides a real-time breakdown of the January 23rd market session, offering visual context to the Nifty and Sensex movements discussed in the brief. http://googleusercontent.com/youtube_content/0

Nestle India Share Price and Trading Overview
It appears that the **Content** section at the end of your prompt is empty. To proceed with the market brief, please provide the specific text, topic, or asset class (e.g., "Gold," "Bitcoin," "Nvidia Stock," "US Housing Market") you would like me to research and rewrite. Once you provide the topic, I will gather the latest data and generate the brief following your formatting constraints.
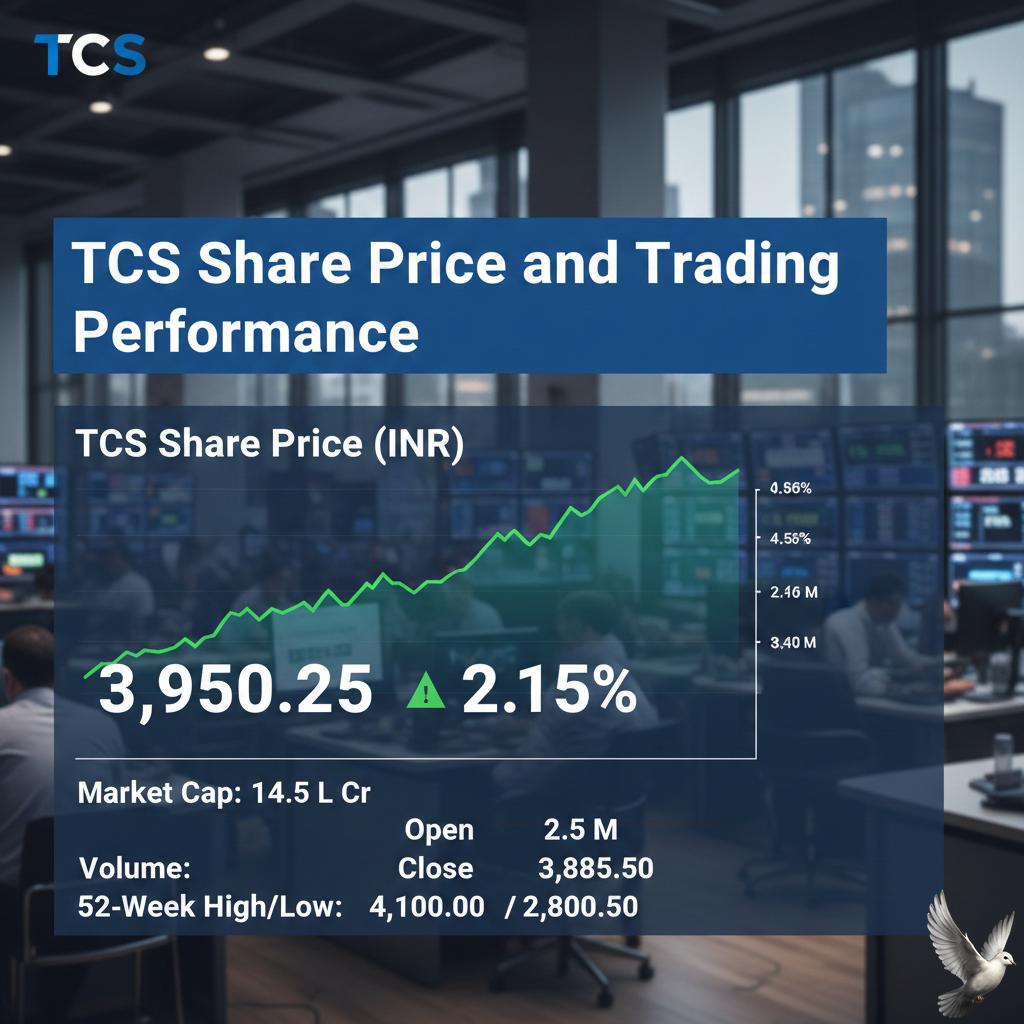
TCS Share Price and Trading Performance
🚀 **Global Market Briefing: January 27, 2026** --- **Equity Markets Ride on AI and Tech Earnings** Major **US stock indexes** closed higher on Monday, January 26, to kick off a busy week of tech earnings and the Federal Reserve meeting. The market remains buoyed by optimism surrounding the **Artificial Intelligence (AI) capital expenditure boom**. The S&P 500 and Dow Jones Industrial Average are both less than **0.4%** away from setting new record closing highs. The tech-heavy **Nasdaq** finished up **0.4%** on Monday, with the **S&P 500** gaining **0.5%** and the **Dow** adding over **300 points** for a **0.6%** increase. Sentiment is strong, with many strategists projecting the bull market will extend into a fourth year. For the **S&P 500**, forecasts are calling for near double-digit returns, with a high-end target around **7,500**. This outlook is heavily reliant on sustained robust earnings growth, particularly from mega-cap tech stocks. Tech sector focus intensifies with earnings reports due this week from giants like **Tesla** and **Apple**. Tesla shares fell **3%** on Monday ahead of its results, while Apple shares rose **3%**. The AI theme remains powerful, exemplified by **Nvidia's** expanded partnership with CoreWeave, leading to a **6.3%** surge in the latter's stock. --- **Federal Reserve and Rate Expectations** The Federal Reserve's policy-setting committee is meeting this week, with analysts widely expecting the central bank to **hold interest rates steady**. This pause follows three consecutive **25 basis point** cuts at the end of 2025, which brought the federal funds rate to a range of **3.50%–3.75%**. The Fed's latest projections, or "dot plot," indicate a lack of consensus but signal only **one additional 25 basis point cut** in 2026. This is a more hawkish stance compared to market pricing, which suggests slightly more easing. The Fed's upgraded economic outlook for 2026 now projects GDP growth at **2.3%** and year-end core inflation (PCE) easing to **2.4%**. --- **Precious Metals Soar on Geopolitical Tension** Safe-haven assets have seen extraordinary recent performance, driven by geopolitical tensions and a weaker US Dollar. **Gold** prices breached the key psychological level of **$5,000 per ounce** for the first time on Monday, hitting an intraday high of over **$5,100**. This represents an increase of nearly **18%** year-to-date in 2026, building on a massive **64%** rally throughout 2025. **Silver** prices experienced an even sharper rally, surging past the **$100 per ounce** mark and hitting a record high of over **$117 per ounce** earlier on Monday. Silver's year-to-date gain is currently around **51%**. The gold-to-silver ratio is at a multi-year low, reflecting silver's outperformance. --- **Commodities and Currency Moves** In energy markets, **West Texas Intermediate (WTI) crude futures** experienced a slight dip, closing **0.4%** lower at **$60.80 a barrel** on Monday. Oil prices are consolidating following recent gains as investors weigh potential oversupply against elevated geopolitical risks. The **US Dollar Index** dropped **0.6%** to **97.03**. The greenback weakened notably against the **Japanese Yen**, which firmed after officials from both the US and Japan signaled a readiness to intervene to stop the yen's slide. This currency volatility has compounded the safe-haven demand for precious metals. --- **Global Economic Growth Outlook** The **International Monetary Fund (IMF)** projects global growth at **3.3%** for 2026, slightly upgraded from its October 2025 forecast. This stable outlook is attributed to technology investment, fiscal support, and private sector adaptability. Regional forecasts from major financial institutions for 2026 include **US GDP growth** at **2.7%**, the **Euro Area** at **1.3%**, and **China** at **4.8%**. While trade policy shifts create uncertainty, supportive financial conditions and fiscal stimulus are expected to provide a tailwind for global expansion, particularly in the first half of the year.
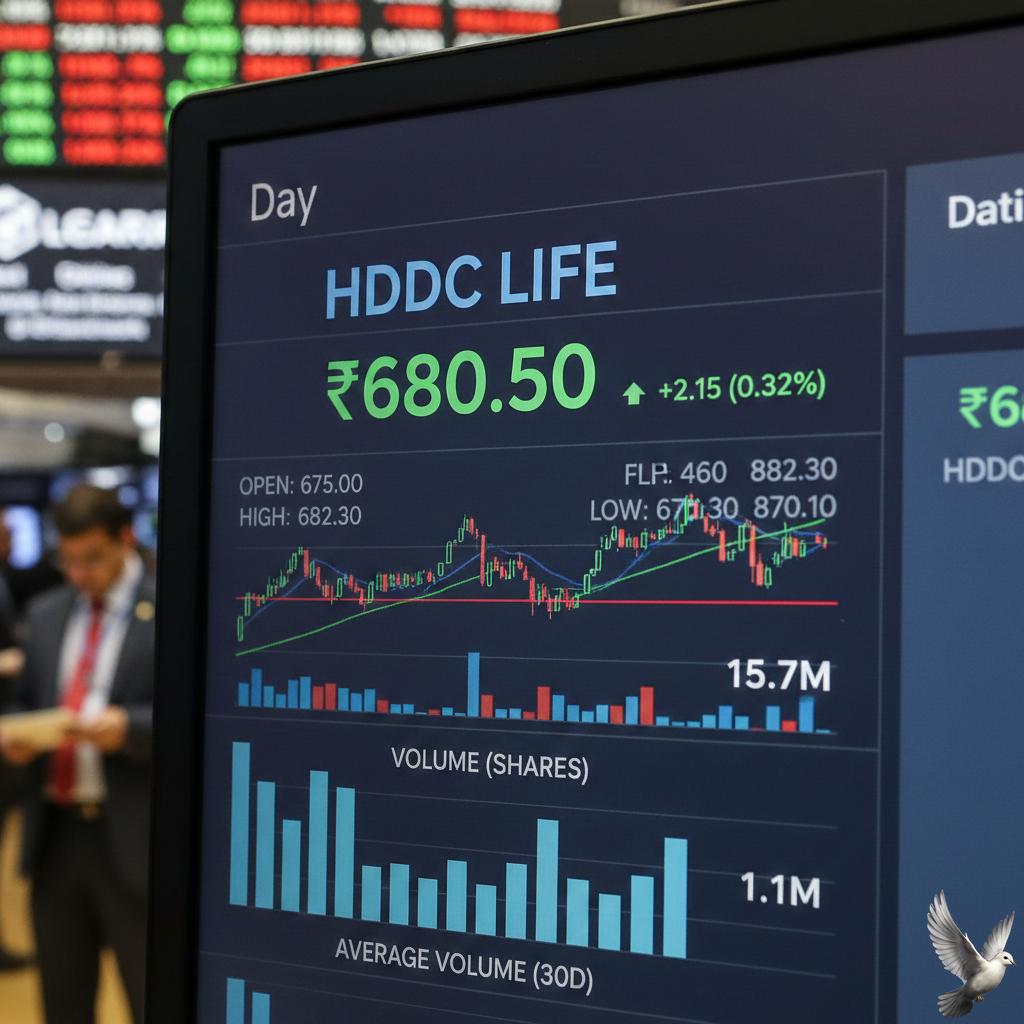
HDFC Life Share Price and Volume Metrics
📰 **Global Market Brief: January 27, 2026** --- 📈 **Equity Markets** Global equities continue to reflect a period of resilience, balanced against cautious investor sentiment ahead of key central bank decisions and a busy tech earnings week. The **S&P 500** last traded around **6,950**, marking a gain of about **0.50%** in the recent session. The market rally is largely supported by continued enthusiasm for the **AI-driven supercycle**, which is forecasted to propel double-digit earnings growth for technology-related firms over the next couple of years. Dow Jones futures are also holding positive gains, while Asian and European markets showed mixed performance. Japan's **Nikkei 225** slipped below **52,800**, pressured by a strengthening yen, which negatively impacts export-heavy sectors. The "winner-takes-all" dynamic continues to concentrate gains in a few large-cap US technology names. This trend is expected to persist in **2026**. --- 🏛️ **Monetary Policy and Macro Outlook** The global economic outlook remains **steady but divergent**. The IMF projects global growth to be resilient at **3.3%** in **2026** and **3.2%** in **2027**, slightly revised up from prior forecasts. This steady performance is fueled by surging **technology investment** and broadly accommodative financial conditions, which are currently offsetting headwinds from shifting trade policies. Central banks in developed markets are on **divergent paths**. The US Federal Reserve is expected to continue its easing cycle, with official projections suggesting the Fed Funds Rate may fall slightly from **3.6%** at the end of **2025** to **3.4%** by the end of **2026**. The European Central Bank is expected to hold its policy rate steady, while the Bank of Japan may gradually raise its rate. Global headline **inflation** is expected to moderate from an estimated **4.1%** in **2025** to **3.8%** in **2026**. However, **sticky core inflation**, particularly in the services sector, remains a prevailing concern, hovering near **3%**. --- 💸 **Fixed Income and Currencies** US Treasury yields are holding firm, reflecting the cautious stance on inflation. The **US 10-year Treasury yield** is currently trading around **4.23%**. This yield has been volatile, having been as high as **4.26%** just a few days ago. The **2-year yield** is near **3.61%**. Forecasts suggest DM yields may grind slightly higher over **2026**, with the **10-year Treasury** potentially reaching **4.35%** by the fourth quarter. The US Dollar Index (**DXY**) is trading slightly up, but the overall outlook remains bearish for the dollar as US interest rate differentials are expected to narrow amid Fed easing. --- 🛢️ **Commodities and Energy** Oil prices are trading within a narrow range, balancing supply risks against demand concerns. **Brent Crude** is currently hovering around **\$65.74** per barrel, while **West Texas Intermediate (WTI)** is near **\$60.83** per barrel. Geopolitical tensions in the Middle East continue to pose an upside risk to prices, but this is counteracted by ample global supply and near-record crude production in the United States. Global oil demand growth for **2026** is projected to be modest amid economic uncertainties. Meanwhile, **Gold** has surged, with prices topping **\$5,000**, a move some analysts interpret as a warning for government bonds as investors seek refuge from concerns over high debt eroding the value of money.
Six Stocks, Including Home First Finance, Displaying Rising RSI Momentum
🌍 Global Market Brief: January 2026 Opening The global financial landscape in January 2026 is defined by a **divergence** between strong equity performance, especially in technology and specific developed markets, and continued weakness in the energy commodity sector. Investor sentiment is broadly positive, underpinned by anticipated interest rate cuts and persistent growth expectations. --- 📈 Equity Market Momentum US equities have started the year with a rally following the Federal Reserve's rate cut in late 2025. The **S&P 500 Index** closed at approximately **6949.77** on January 26, reflecting a more than **1.3%** increase since the start of the month, even amid high valuation concerns. The forward Price-to-Earnings (P/E) ratio for the S&P 500 stands at about **22x**, matching the peak multiple seen in 2021. US technology and growth stocks, particularly those linked to **Artificial Intelligence (AI)** infrastructure, remain top performers, although some sector concentration risks are noted. Earnings are projected to grow by **12%** in 2026, providing a fundamental base for the bull market. Internationally, the **UK's FTSE100** index hit a record high, surpassing the **10,000** mark for the first time on January 2, 2026. **Japanese stocks** also achieved their highest-ever year-end finish, benefiting from corporate reforms and strong tech sector success. Emerging Market equities are expected to deliver robust performance this year, driven by lower local rates and commodity cycles. --- 💰 Commodities & Safe Havens The commodity space shows a significant split. **Precious metals** have seen a strong rally continuing into 2026, driven by geopolitical tensions, central bank demand, and US Dollar weakness. **Gold** prices have surged to trade near **\$2,680 per ounce** and have briefly breached **\$5,100 per ounce** on safe haven flows. **Silver** has registered an even steeper rally. In stark contrast, **crude oil** continues a downward trend, marking one of its weakest annual performances in years. Brent crude oil is now forecast to average around **\$56 per barrel** in 2026, a decline from the estimated **\$69/b** average in 2025. This weakness is attributed to a persistent surplus of global oil supply relative to demand. **WTI crude oil** is trading around **\$60.63 per barrel** for the March contract, having fallen slightly. Geopolitical disruptions, such as in Kazakhstan, provide only temporary upward price pressure. --- 📊 Macroeconomic Backdrop & Policy Global economic growth is projected to remain resilient but subdued, with the International Monetary Fund forecasting global expansion near **3%**. The US is projected to grow **2.7%**, the Euro area **1.3%**, and China **4.8%**. **Disinflation** is taking hold in advanced economies, allowing central banks to ease monetary policy. The US Federal Reserve is anticipated to make additional rate cuts this year. The **US dollar** has weakened significantly, falling about **9%** against major world currencies in 2025, which provides a tailwind for emerging market assets. Key events this month include the US Supreme Court's hearing on trade tariffs and the Federal Reserve's upcoming policy decision on interest rates, with expectations for the Fed to hold rates initially. The prevailing theme for 2026 will be the ongoing collision of divergent monetary policy paths, the relentless expansion of **AI technology**, and persistent geopolitical uncertainty.

Marico Acquires PVR Inox's Popcorn Brand for Rs 227 Crore
**MARKET BRIEF: MARICO ACQUIRES 4700BC FROM PVR INOX** **Deal Overview** FMCG major Marico has executed definitive agreements to acquire a **93.27%** stake in Zea Maize Pvt Ltd, the parent company of premium snacking brand "4700BC." The all-cash transaction is valued at up to **Rs 226.83 crore**. The seller, PVR INOX, is exiting its investment to monetize a non-core asset and sharpen focus on its primary cinema exhibition business. **Strategic Implications** This acquisition marks a significant push by Marico into the high-growth packaged foods segment. By integrating 4700BC, Marico aims to leverage its extensive distribution network to scale the brand beyond its current niche. For PVR INOX, the divestment generates a healthy return, with the deal translating to an Internal Rate of Return (IRR) of approximately **24.5%** on its initial equity investment. **Financial Snapshot** * **Transaction Value:** Rs 226.83 crore * **Stake Acquired:** 93.27% * **Target Revenue:** 4700BC reported a turnover of **Rs 98.66 crore** for FY25, though it remains loss-making with a net loss of **Rs 16 crore**. * **Market Reaction:** In the trading session preceding the announcement, Marico shares closed at **Rs 740.90** (down 1.41%), while PVR INOX settled at **Rs 931.85** (down nearly 3%). **Operational Outlook** The transaction is expected to conclude within **30 days**. 4700BC founder Chirag Gupta will retain the remaining stake of approximately **7%** and continue to lead the operations. Marico has secured the option to acquire this remaining balance after **3 years**, contingent on performance milestones. **Sector Impact** The move underscores a broader trend of large FMCG conglomerates acquiring direct-to-consumer (D2C) brands to capture younger demographics. Marico’s entry into the gourmet popcorn and snacking category—which includes makhana, chips, and nachos—positions it to compete more aggressively in the urban premium market. [Marico Share Price Analysis](https://www.google.com/search?q=https://www.youtube.com/watch%3Fv%3DkRKVd1eQG84) The video provides a technical analysis of Marico's stock performance, offering context on price trends that investors may find relevant following the acquisition news.

Gold and Silver Near Record Highs Amid Safe-Haven Demand
The precious metals complex is experiencing a historic surge, driven by unparalleled safe-haven demand and structural shifts in global monetary policy. Gold prices have shattered previous records, moving decisively past the **$5,100** per ounce threshold. The spot market recently registered an all-time high above **$5,110**, capping a remarkable performance that has seen the metal gain over **16%** since the start of the year. This aggressive momentum underscores gold’s crucial role as a primary hedge against rising global uncertainty. The price action is fundamentally dictated by escalating geopolitical risk. Investors are aggressively pricing in the possibility of a renewed, extensive global trade conflict. The market has reacted sharply to heightened tensions involving the US administration, including recent tariff threats directed at European partners and disputes over trade arrangements with Canada. Such political and commercial instability has triggered a flight from riskier assets, bolstering demand for bullion. Further support comes from a weakening US Dollar Index, which currently sits near **97.040**. The dollar’s slide enhances the appeal of dollar-denominated assets like gold. All eyes are fixed on the Federal Reserve’s upcoming policy decision. While the central bank is widely anticipated to hold the federal funds rate steady at its current two-day meeting, market consensus remains centered on a dovish outlook for the year. The Fed’s latest projections signal the potential for at least one, and potentially up to three, interest rate cuts in **2026**, which would push the target range down toward **3.25%** to **3.50%**. Any confirmation from Chair Powell on the easing path will be a major bullish signal for non-yielding gold. The silver market is commanding intense attention after delivering a powerful performance, eclipsing gold’s rise. Silver prices have surged by more than **200%** over the past year, confirming its status as a high-beta asset in the precious metals cycle. Spot silver recently achieved an historic peak, crossing the **$110** per ounce level. This dramatic ascent is fueled by a dual demand narrative. On one side, silver is functioning as a monetary safe-haven asset, benefiting from the same macroeconomic fears driving gold. On the other side, the metal is seeing unprecedented structural demand from the industrial sector. Silver is a critical component in the ongoing energy transition, essential for solar panel manufacturing, electric vehicle production, and new grid infrastructure. The gold-silver ratio is reflecting this seismic shift, having plummeted from pandemic highs of **127** to approximately **50** today. While this rapid compression indicates silver is currently historically expensive relative to gold, the long-term industrial demand outlook suggests sustained tightness in physical markets, which could keep the ratio at compressed levels. Structural buying remains a pillar of support for the gold market. Central bank accumulation has continued unabated, with China’s central bank leading the institutional buying spree for a fourteenth consecutive month. This institutional shift away from the dollar and into hard assets provides a strong structural floor under the metal. In the mining sector, the trend toward consolidation is accelerating. Strategic moves, such as Chinese miner Zijin Gold’s significant acquisition of Allied Gold, highlight a strategic imperative among major producers. Companies are focusing on securing high-grade reserves and improving scale to manage rising input costs, signaling a long-term commitment to leveraging the strong price environment through efficiency and growth. The overall sentiment across the precious metals complex remains extremely bullish, underpinned by financial uncertainty and persistent physical demand.
Mphasis, Indigo Among 5 Stocks With 10-30% Upside Potential for 2026
**Market Brief: Tuesday, January 27, 2026** **Overview: Volatility Ahead of Union Budget** Indian equity markets reopen today following the Republic Day holiday, with global cues suggesting a potential rebound. While the Nifty 50 and Sensex closed last week with sharp cuts of nearly **1%**, the GIFT Nifty is trading higher at **25,165**, indicating a positive start. Volatility remains the dominant theme as investors position themselves for the Union Budget on February 1 and the US Federal Reserve's upcoming interest rate decision. **Key Index Levels** * **Nifty 50:** Closed at **25,048** (Support seen at 24,800 levels). * **Sensex:** Settled at **81,537**. * **Trend:** The market has slipped below key moving averages, with foreign institutional investors (FIIs) remaining net sellers. However, domestic flows continue to cushion the downside. **Brokerage Radar & Strategic Calls** Top firms have issued fresh updates based on Q3 FY26 earnings and valuation comfort: * **JK Cement:** BNP Paribas retains an 'Outperform' rating with a target of **₹6,700**, citing strong volume growth and pricing discipline. * **Aditya Birla Sun Life AMC:** Equirus Securities maintains a 'Long' stance with a target of **₹885**, seeing a potential upside of **14%**. * **Manufacturing Focus:** Analysts are pivoting toward industrial plays. **Havells** and **CEAT** delivered robust Q3 numbers, driven by operational efficiency and demand recovery, contrasting with the muted performance in the IT sector. * **Long-Term Picks:** Mphasis and Indigo remain top picks for 2026, with projected returns of **10-30%** based on structural growth stories. **Stocks in Focus** * **Swan Defence:** Secured new orders worth **₹2,000 crore** ($227 million) from a European client. * **UltraTech Cement:** Reported a consolidated net profit of **₹1,729 crore**; management commentary on demand remains crucial. * **Adani Group:** Stocks including Adani Enterprises and Ports remain under pressure following regulatory news from the US; high volatility is expected. * **Banking Majors:** Axis Bank and Kotak Mahindra Bank are in the spotlight as the market digests mixed sectoral earnings. **Sectoral Trends** * **Weakness:** Realty, Consumer Durables, and PSU Banks have faced the brunt of recent profit-booking. * **Resilience:** Manufacturing and select Auto ancillary stocks are outperforming. * **IT Sector:** Remains range-bound. Major players like **TCS** show stable deal wins (TCV **$9.3 billion**), but revenue growth is tempered by global caution. **Macro Triggers** Traders are closely monitoring pre-budget whispers regarding changes to the **income tax regime** and **capital expenditure** allocations. A break above **25,200** on the Nifty could trigger short-covering, while failure to hold **25,000** may invite further selling pressure.

12 Stocks Cross Below 200-Day Moving Average
**200 DMA: The Line in the Sand for January 2026 Markets** The 200-day moving average (200 DMA) serves as the definitive long-term trend indicator for traders and institutional investors. It acts as a major support level in bull markets and a formidable resistance ceiling during downtrends. When a security trades comfortably above this line, the long-term trend is considered bullish. Conversely, a sustained break below the 200 DMA often signals a structural shift in market sentiment, prompting risk-management protocols and portfolio rebalancing. **Current Market Context: The Critical Test** As of late January 2026, the 200 DMA has become the central battleground for global and domestic equities. The prevailing "risk-off" sentiment, driven by geopolitical tensions and persistent foreign outflows, has pushed key indices to test this vital technical threshold. For the **Nifty 50**, the 200 DMA is currently positioned near the **25,130–25,170** zone. The index has been hovering dangerously close to this level, trading around **25,048**, signaling potential weakness. A decisive close below this average would confirm a trend reversal, likely triggering further algorithmic selling. **Key Market Data (January 2026)** * **Nifty 50:** ~25,048 (Testing 200 DMA Support) * **Sensex:** ~81,537 * **Bank Nifty:** ~58,200–59,000 range * **S&P 500:** ~6,915 (Remains Resilient) * **Gold:** ~$5,100+ (Record Highs) **Stock-Specific Trends** The divergence between stocks holding their long-term trends and those breaking down is stark. **Trading Below 200 DMA (Bearish Signal):** Many heavyweights have slipped below their long-term averages, dragging broader indices down. * **Reliance Industries:** Trading significantly below its 200 DMA, reflecting energy sector headwinds. * **HDFC Bank:** Struggling to reclaim its long-term trendline amid FII selling. * **ITC:** Correcting after a prolonged period of outperformance. **Trading Above 200 DMA (Bullish Signal):** Select pockets of strength remain, largely in defensive or export-oriented sectors. * **Bharti Airtel:** Continues to trade well above its 200 DMA (~1,950), showing relative strength. * **State Bank of India (SBI):** Holding firm above its long-term average (~866), supported by domestic institutional buying. * **Infosys:** maintaining its uptrend, benefitting from renewed interest in IT services. **Commodities: The Safe Haven Flight** While equities struggle with their 200 DMA levels, commodities have surged in a classic flight to safety. **Gold** has shattered psychological barriers, crossing **$5,100** per ounce. This breakout is driven by escalating geopolitical risks and central bank accumulation. **Silver** has also outperformed, jumping over **8%** in recent sessions, further validating the defensive rotation in capital. **Summary** The 200 DMA is currently the most watched metric on trading desks. With the Nifty 50 and major large-cap stocks testing or breaching this level, the market is at a pivotal junction. Traders are now monitoring closing prices closely. A bounce from these levels would reinforce the secular bull market, while a sustained trade below the 200 DMA could open the door for a deeper correction toward the **24,800** zones. For now, caution dominates. The divergence between resilient commodities and fragile equities highlights a defensive shift in global capital allocation.

Q3 Earnings Announcements: Asian Paints, Vodafone, Tata Consumer, and 56 Other BSE-Listed Companies
The third-quarter Fiscal Year 2026 earnings season has reached a crucial inflection point, with major Nifty components reporting results today, **January 27, 2026**. These disclosures, stemming from a list of **59 BSE-listed companies**, are shaping market sentiment against a backdrop of deep volatility and macroeconomic concerns. *** Macro Trends and Index Performance The Indian equity market has witnessed a significant correction, characterized by aggressive selling throughout January. The benchmark Sensex and Nifty indices have both declined by over **4%** since the start of the year. The Nifty **50** recently slipped below the critical **25,050** support level. This sharp downturn is largely attributed to sustained capital flight. Foreign Portfolio Investors (FPIs) have been net sellers, offloading shares worth approximately **₹36,591 crore** so far in January. This aggressive outflow has pressured the Indian Rupee, which fell to a historic low of **92** against the US dollar. In contrast, Domestic Institutional Investors (DIIs) have been crucial shock absorbers, remaining net buyers and providing support with inflows exceeding **₹54,822 crore**. However, the risk-off environment is clear, with broader market indices underperforming sharply. The NIFTY Midcap **150** index dropped **4.4%**, while the Smallcap **250** index fell **5.5%** over the recent trading period, reflecting heightened selling pressure in riskier segments. *** Consumer Majors: Asian Paints and Tata Consumer Investor scrutiny is intense for the consumer segment, seeking validation of domestic demand resilience. Asian Paints, a Nifty stalwart, was expected to demonstrate a **stable performance** anchored by improved volume growth. The focus is on whether raw material cost benefits translated into better margins. The company, with a robust market capitalization of around **₹2,59,338 crore**, saw its stock trade near **₹2703.70** ahead of the announcement, signaling anticipation for the official numbers. Tata Consumer Products, also announcing results, was widely projected to show a **significant year-on-year profit increase**. This growth was expected to be driven by strong execution across its diverse portfolio. Despite these projections, the stock displayed pre-earnings caution, declining by **-1.85%** to **₹1153.50** as of the latest trading data. Investors are balancing the prospect of higher profit against the company’s premium valuation, with the market cap holding at **₹1,14,144 crore**. *** Telecom Sector: Vodafone Idea’s Financial Stress The financial landscape for Vodafone Idea (Vi) remains precarious, and the Q3 results are expected to confirm the challenging trajectory. The original forecast for Vi was for **subdued results** marked by further **widening losses**. The company's immense financial struggle is evident in previous filings, which showed a substantial net loss of **₹7,175.9 crore** in the preceding quarter, even as revenue saw a modest **2.4%** year-on-year increase. The fundamentals reflect this deep financial stress, with the company operating on a negative book value per share of **₹-7.61**. The stock price closed lower by **-2.46%** at **₹9.93** ahead of its disclosure. The market is prioritizing management commentary on crucial network expansion plans and the path to raising essential capital. The outcome of today’s results will be pivotal, either stemming the tide of corporate earnings disappointment or accelerating the market's current cautious mood as attention soon shifts to the upcoming Union Budget.

GIFT Nifty Signals Positive Start as Asian Shares Trade Lower
It appears that the content you intended for me to update and rewrite was not included in your message. The prompt ends at "CONTENT:", but no text follows it. To proceed, I need the specific source text, topic, or market data you want me to analyze and blend with the latest web search results. **Please paste the content or specify the market topic you would like me to cover.**

Intervention Risks Support Yen, Capping Dollar Gains
**Market Brief: Yen Rallies as Dollar Falters on Intervention Risks and DC Gridlock** **USD/JPY Volatility & Intervention Signals** The Japanese yen has strengthened significantly, pushing the **USD/JPY** pair down to trade around the **154.29** level. This sharp appreciation follows a volatile slide from highs near **159.00**, triggered by reports that the Federal Reserve Bank of New York conducted a "rate check" with financial institutions. Market participants interpret this move as a prelude to potential coordinated currency intervention by U.S. and Japanese authorities to curb excessive dollar strength. **U.S. Political Risks Weigh on Greenback** The dollar is facing compounded downward pressure from Washington. A partial U.S. government shutdown looms with a **January 30** funding deadline, as Congress remains deadlocked over Department of Homeland Security appropriations. Simultaneously, President Trump's renewed tariff threats—recently targeting South Korea and European goods—have rattled investor confidence in U.S. policy stability, accelerating the flight from the dollar. **Broader Forex & Commodities Impact** Greenback weakness has been broad-based, sending the U.S. Dollar Index (DXY) to four-month lows near **97.30**. Major peers have capitalized on this slide: * **EUR/USD** has surged above the **1.1800** handle. * **GBP/USD** has climbed firmly past **1.3600**. **Safe Haven Flows** Uncertainty surrounding U.S. fiscal health and trade policy has ignited a historic rally in precious metals. Gold has breached the psychological **$5,000** mark, while silver has topped **$100** per ounce for the first time, reflecting an aggressive rotation into hard assets. **Key Event Watch** Traders are now bracing for the Federal Reserve’s upcoming policy decision. While rates are expected to hold steady, the central bank’s commentary will be scrutinized for reactions to the recent tightening in financial conditions and the potential economic drag from a government closure. **Next Step for User** I can generate a detailed technical analysis summary for the USD/JPY pair or the Gold market if you need specific entry/exit levels.

Wall Street Indexes Gain Ahead of Key Events
**Market Brief: Tech Earnings & Fed Decision in Focus** **Global Momentum & Key Indices** US markets closed higher Monday as investors positioned for a pivotal week of mega-cap earnings and central bank policy. The **S&P 500** climbed to **6,950** (+0.5%), while the **Dow Jones** rose to **49,412** (+0.6%). The tech-heavy **Nasdaq** advanced to **23,601**, driven by optimism ahead of "Magnificent Seven" reports. **Indian Market Outlook** Domestic indices return to action today following the Republic Day holiday. * **Last Close (Friday):** Sensex settled at **81,537**, while Nifty 50 ended at **25,049**, dragged by heavy selling in Adani group stocks and banking majors. * **Opening Signals:** GIFT Nifty trends suggest a **positive start** for Indian equities, aiming to recover lost ground despite mixed cues from Asian peers. * **Regional Headwinds:** Asian markets are trading lower this morning, with the Kospi dipping on renewed US tariff threats against South Korean goods. **Strategic Watchlist: AI & The Fed** * **Federal Reserve:** The FOMC meeting is underway (Jan 27–28). Markets widely expect rates to hold steady at **3.50%–3.75%**, with intense scrutiny on Chairman Powell’s commentary regarding future cuts amid mixed economic data. * **Mega-Cap Earnings:** Critical reports from **Microsoft, Meta, and Tesla** (Wednesday) and **Apple** (Thursday) will test valuations. Investors demand concrete evidence of AI monetization to justify massive capital expenditures. **Commodities & Currency** * **Gold:** Surged to a historic high, crossing **$5,000 per ounce**, fueled by geopolitical tension and dollar weakness. * **Oil:** WTI Crude remains subdued around **$60.80**, limiting inflationary pressure. * **Currency:** The US Dollar Index (DXY) weakened as traders speculate on potential joint intervention to support the Japanese Yen. **Summary** Volatility is expected as Indian markets price in three days of global action. The trajectory for the remainder of the week hinges on the Fed’s tone and whether Big Tech can deliver on AI growth promises.
Asian Markets, Korea Tariffs, and Yen Performance Overview
Global market sentiment remains pressured as geopolitical trade fears resurfaced, triggering volatility in Asian equity sessions. A sharp focus on upcoming mega-cap technology earnings will determine the immediate trajectory of the current AI-driven stock rally. *** Asian Markets Under Tariff Pressure The primary catalyst for regional friction is the renewed threat of US tariffs targeting South Korean imports. On Monday, President Trump announced plans to raise duties on South Korean goods, including automobiles, lumber, and pharmaceuticals, escalating the tariff rate from **15% to 25%**. This move is explicitly tied to the assertion that the South Korean legislature has failed to ratify a major bilateral trade agreement. The immediate impact was severe in Seoul. The benchmark **KOSPI Index** registered a pullback, closing recently near **4,949.59**, reflecting a decline of approximately **0.81%** following the announcement. Key South Korean stocks were immediately affected. Shares of major automakers saw losses, with one leading manufacturer falling by as much as **4.8%** in early Tuesday trading. The South Korean **won** weakened in currency markets, reflecting investor anxiety over trade disruptions in critical export sectors like autos, which account for a significant portion of South Korea’s trade with the US. *** Currency Volatility and Japanese Equities In Japan, markets continue to grapple with currency direction. The Japanese **yen** recently experienced rapid appreciation, a move that fueled concern over its impact on the nation's massive export-oriented corporate profits. This currency strength exerted significant selling pressure on the **Nikkei 225**, which closed down by approximately **1.53%** in recent action. The index settled near **53,023.28** points. Investors are highly sensitive to any policy signals that might curb speculative moves in the yen, given the currency’s ability to overshadow otherwise positive local corporate developments. Asian stocks overall exhibited a mixed session as traders digested the tariff news while also factoring in residual strength from the tech sector. *** The Critical AI Earnings Test Attention now shifts decisively to the United States, where the sustainability of the long-running technology rally, powered by enthusiasm for Artificial Intelligence, faces its most crucial test of the year. Wall Street indices finished Monday higher, with the **S&P 500** gaining **0.50%** to reach **6,950.23**, and the **Nasdaq Composite** adding **0.43%** to **23,601.36**. However, the market’s caution is palpable as a wave of mega-cap technology earnings approaches. Investors are specifically scrutinizing these results to identify concrete evidence of measurable returns on the enormous capital expenditure dedicated to AI infrastructure. The consensus belief is that the AI enthusiasm must translate into substantial, defensible revenue growth to justify current high valuations. The earnings calendar is exceptionally dense this week: **Microsoft, Meta Platforms, and Tesla** are all scheduled to report results on Wednesday. **Apple** follows closely on Thursday. Any weakness in cloud spending growth, or disappointing guidance regarding AI monetization, could lead to a major market reset for the entire technology complex. Concerns persist over capital expenditure plans, particularly for companies like Meta, where investors are wary of massive investment projects following prior shifts in corporate strategy. Simultaneously, the broader macro environment looms large. The Federal Reserve’s upcoming policy meeting is expected to conclude on Wednesday, providing the latest guidance on interest rates and the economic outlook, further shaping market risk appetite in the near term.
Morgan Stanley, BofA Forecast Continued Upside in Strongest Carry Rally Since 2009
🌏 Emerging Markets Carry Trade Rally Extends on Dollar Weakness The strategy of **selling US dollars** and purchasing **emerging-market (EM) currencies** is delivering exceptional returns, extending a historic rally well into early **2026**. Emerging market **carry trades**—which profit from borrowing in low-interest currencies, like the dollar, to invest in higher-yielding ones—are showing strong results. According to a Bloomberg index, these strategies are **up 1.3%** in the initial weeks of 2026, building on a massive **18% rally** seen in the previous year. This was the largest annual return since **2009**. --- 📉 Weakening US Dollar Drives Flows The core driver remains a widely anticipated and unfolding **weakening of the US dollar**. The US Dollar Index (**DXY**) is currently trading near **98**, hovering around multi-month lows. This depreciation is primarily influenced by the **Federal Reserve's** shift toward an easing cycle. Investors expect the Fed to continue cutting interest rates throughout 2026, narrowing the rate advantage the US has long held over other developed economies. Further adding pressure are the unpredictable policies from the **Donald Trump** administration, including trade tariffs, which introduce significant **geopolitical and fiscal risk** around the dollar. This uncertainty pushes global investors to diversify away from US-centric assets. --- 📈 EM Currencies Hit Multi-Year Highs Emerging market currencies are benefiting from this environment, supported by **attractive yield differentials** and resilient local economic fundamentals. The high real interest rates offered by many developing nations are a key lure for carry trades. Notable beneficiaries include currencies like the **South African rand** and the **Colombian peso**, both of which are currently hovering at **multi-year highs** against the US dollar. In Latin America, the performance is particularly strong. The **Brazilian real** has returned an impressive **4.3%** so far in 2026 for carry traders, adding to its **23.5%** gain from the prior year. Brazil maintains a high benchmark interest rate, sitting at approximately **15%**, despite successful disinflation efforts. --- ⚠️ Volatility and Divergence While the outlook remains bullish, the path for continued gains is unlikely to be smooth. The success of the carry trade relies heavily on volatility remaining **suppressed**. A sudden spike in global market fear or a sharper-than-expected rebound in US inflation could trigger a **dollar rally**, quickly eroding the gains from these trades. Currency performance is also **divergent** across emerging markets. While the Latin American region and high-yielding currencies like the **Turkish lira** and **Czech koruna** are favored, others are struggling. The **Indian rupee** and **Indonesian rupiah** are among the few currencies showing losses in carry terms at the start of the year. Overall, major banking strategists concur that the factors underpinning the rally—namely a softening dollar and attractive EM interest rates—are in place for the trend to **continue throughout 2026**.
Stocks to Watch: Asian Paints, Vodafone Idea, Axis Bank, BPCL, MCX, PVR Inox, Marico, Emkay Global
🚨 **Indian Market Brief: Earnings Season and Broad-Based Weakness** Indian benchmark indices have displayed persistent weakness, continuing the broad-based selling pressure seen at the end of the previous week. Markets were closed on **Monday, January 26, 2026**, for Republic Day. The last trading session on Friday, **January 23, 2026**, saw significant declines, with the **BSE Sensex** closing lower by **769.67 points** (a **-0.94%** drop) at **81,537.70**. The **Nifty 50** also slipped, shedding **241.25 points** (a **-0.95%** decline) to settle at **25,048.65**. The downturn on Friday was heavily influenced by continued **Foreign Institutional Investor (FII) outflows** and sharp losses in certain heavyweight stocks, particularly in the **Adani Group**. --- **Sectoral Performance and Key Stock Movements** Broader markets, despite the frontline indices' decline, showed a mixed performance on Friday. The **BSE MidCap** index closed **1.3% higher**, while the **BSE SmallCap** index rose by **1.1%**. However, the **Realty** and **Power** sectors witnessed strong selling pressure, and the **Nifty Bank** index was down by **-1.23%**. Key losers on Friday included **Adani Enterprises** (down **-10.76%**), **Adani Ports** (down **-7.02%**), **Eternal** (down **-5.74%**), and **Axis Bank** (down **-3.16%**). Gains were modest and selective, with **Dr. Reddy’s Labs** and **Tech Mahindra** among the top performers, up by **1.72%** and **0.79%** respectively. --- **Corporate Earnings in Focus** The market sentiment remains highly impacted by a mixed bag of **Q3 earnings reports**, with several high-profile companies either announcing or scheduled to announce results. * **Axis Bank:** The bank reported a **3% year-on-year (YoY)** rise in net profit for Q3 FY26 to **₹6,490 crore**. Net Interest Income (**NII**) grew by **5%**. Despite this, the stock was a key loser on Friday, down over **-3.1%**. * **Asian Paints:** This major paint manufacturer is set to announce its Q3 FY26 results today, **January 27**. Expectations point towards a potential surge in Profit After Tax (**PAT**), with some forecasts suggesting a **35% YoY increase** driven by double-digit volume growth and margin improvement from benign raw material costs. * **Vodafone Idea:** The telecom operator is also scheduled to report its Q3 FY26 earnings today, with investors watching closely for updates on its financial health and any corporate developments regarding its capital structure. --- **Key Market Drivers** The overall market mood has been cautious to bearish, primarily due to the persistent selling by FIIs. Technical analysis suggests the **Nifty 50** remains under short-term pressure, with the **25,000–24,800** area acting as a critical support zone. A sustained breakdown below this level could accelerate selling. The market is also absorbing external pressures, including a record low for the Indian Rupee and concerns stemming from global geopolitical events. The focus is expected to shift to the **Union Budget** and future **interest rate decisions** by the Reserve Bank of India.
Axis Bank Q3 Net Profit Up 2.9% as Margins Narrow
**Axis Bank Q3 FY26 Market Brief** **Financial Performance** Axis Bank reported a **modest 2.9%** year-on-year increase in net profit to **₹6,490 crore** for the third quarter ended December 31, 2025. Net Interest Income (NII) grew **5%** to **₹14,287 crore**, supported by a **15%** surge in total deposits. However, profitability was constrained by a narrower Net Interest Margin (NIM), which contracted to **3.64%** due to persistent cost-of-funds pressures. **Operational Headwinds** Performance was impacted by higher credit costs and specific regulatory adjustments. The bank absorbed a one-time catch-up provision of **₹55 crore** tied to new project finance norms, which heavily influenced the quarter's accounting. Despite these technical factors, core operating profit rose **7%** to **₹10,815 crore**, reflecting underlying business resilience. **Asset Quality & Balance Sheet** Asset quality showed steady improvement, with the Gross NPA ratio declining to **1.40%** (down **6 bps** QoQ) and Net NPA easing to **0.42%**. The loan book grew **14%** year-on-year to **₹11.59 lakh crore**, driven by a strategic recalibration of the portfolio towards higher-yielding segments. **Market Reaction** Investor sentiment remained cautious ahead of the earnings release, with the stock closing at approximately **₹1,258** on the BSE, down **2.7%** in the preceding session. Market participants are closely monitoring the bank's ability to manage margin compression in a tight liquidity environment.

Oil Agencies Diverge on 2026 Market Outlook
**Global Oil Market: A Clash of Forecasts** **Forecast Divergence** The global oil market is currently defined by a stark disagreement between major forecasting agencies regarding the supply-demand balance for 2026. The gap between the most bearish and bullish outlooks has widened to historic levels, creating significant uncertainty for traders and policymakers. The International Energy Agency (IEA) projects a massive oversupply, estimating a surplus exceeding 3.7 million barrels per day (bpd) for the year, potentially topping 4 million bpd in the first half of 2026. This bearish view is driven by surging output from the Americas and decelerating global demand growth. Similarly, the U.S. Energy Information Administration (EIA) forecasts a substantial overhang, predicting supply will outstrip demand by approximately 2.8 million bpd. Both agencies point to a structural shift where supply growth from non-OPEC+ nations outpaces the world’s appetite for crude. In sharp contrast, OPEC maintains a far more optimistic stance. Their latest estimates suggest a much tighter market, with the surplus averaging only about 600,000 bpd. This divergence of over 3 million bpd between the IEA and OPEC assessments represents one of the largest forecasting gaps in recent history. **Price Action and Market Sentiment** Current market pricing appears to favor the bearish sentiment. As of late January 2026, benchmark prices remain subdued, reflecting the market's anxiety over the looming inventory builds. * **Brent Crude** is trading near **$65.74** per barrel. * **WTI Crude** hovers around **$60.83** per barrel. Both benchmarks are down roughly 16% to 17% compared to year-ago levels. The persistent downward pressure underscores the market's focus on the incoming wall of supply rather than geopolitical risk premiums, which have largely eroded despite ongoing tensions in Eastern Europe and the Middle East. **Supply Dynamics: The Non-OPEC Surge** The core driver of the predicted surplus is robust production growth outside the OPEC+ alliance. The United States, Brazil, Guyana, and Canada are pumping record volumes, adding approximately 1.5 million bpd to global supply. This flood of new oil is hitting the market just as consumption growth hits a structural slowdown. **Demand Weakness** On the demand side, the IEA and EIA cite "subdued" growth prospects, forecasting annual increases of less than 800,000 bpd for both 2025 and 2026. Key factors include: * **China's Economic Shift:** The world's largest oil importer is seeing slower industrial demand. * **Electrification:** Rapid adoption of electric vehicles (EVs) is displacing gasoline consumption in major markets. * **Efficiency Gains:** The petrochemical sector remains the primary driver of growth, while transport fuel demand stagnates. **OPEC+ Strategic Response** Faced with these bearish headwinds, the OPEC+ alliance has adopted a defensive posture. In early January 2026, the group confirmed it would pause planned production increases through the first quarter of the year. Member nations, led by Saudi Arabia and Russia, are maintaining current output cuts until at least March 2026 to prevent a price collapse. This disciplined approach aims to drain excess inventories, though the sheer scale of non-OPEC expansion limits the group's ability to dictate price floors as effectively as in previous years. **Summary Outlook** The market is caught in a tug-of-war. If the IEA's surplus of 4 million bpd materializes, prices could face further downward corrections, potentially testing the $50 range. However, if OPEC's tighter view proves accurate—supported by resilient demand or unexpected supply disruptions—the current bearish positioning could unwind rapidly. For now, the weight of evidence points to a well-supplied market entering a period of significant inventory accumulation.

Big Tech Earnings Leave AI Market Leadership Unclear
**Market Brief: Big Tech Earnings & AI Reality Check** **Date:** January 27, 2026 **Focus:** Q4 Earnings, AI Capex, Sector Rotation **The "Prove It" Phase Begins** Big Tech earnings season enters a critical window this week, with **Microsoft (MSFT)**, **Meta (META)**, and **Tesla (TSLA)** set to report tomorrow, followed by **Apple (AAPL)** on Thursday. While the broader S&P 500 remains near record highs, the monolithic "Magnificent Seven" trade has fractured. Investors are demanding concrete evidence that the estimated **$475 billion** in combined 2026 capital expenditures (Capex) is translating into profitable AI monetization, not just infrastructure build-out. **Capex Fears vs. AI Returns** The spotlight is on Return on Investment (ROI). **Microsoft** faces pressure after Q1 Capex surged to **$34.9 billion**, outpacing guidance. Similarly, **Meta** is under scrutiny as it targets **$70–$72 billion** in 2025 infrastructure spending. If these giants fail to demonstrate stronger margins or clear revenue uplift from AI workloads, the recent market rotation into "niche AI" sectors—such as memory chips (**Micron**, **Western Digital**) and power infrastructure—may accelerate. Conversely, strong earnings could trigger a sharp rotation back into mega-cap tech. **Key Tickers to Watch** * **Alphabet (GOOGL):** Reporting **Feb 4**. Currently the group's outperformer, up **~20%** recently while peers lagged. Investors view its valuation as attractive relative to its AI integration in Search and Cloud. * **Nvidia (NVDA):** Reporting **Feb 25**. Shares remain resilient around **$186**, bolstered by a fresh **$2 billion** stake in cloud provider CoreWeave. This signals sustained demand for its GPUs despite valuation concerns. * **Amazon (AMZN):** Reporting **Feb 5**. Analysts forecast strong cloud growth but are wary of operating margin compression due to aggressive spending. **Strategic Outlook for 2026** The "build it and they will come" narrative is over. Investment strategies for the remainder of 2026 will hinge on this week’s ability to justify the cost of capital. Expect heightened volatility in **MSFT** and **META** post-earnings as the market recalibrates its long-term AI valuation models.