Bullish News
Collection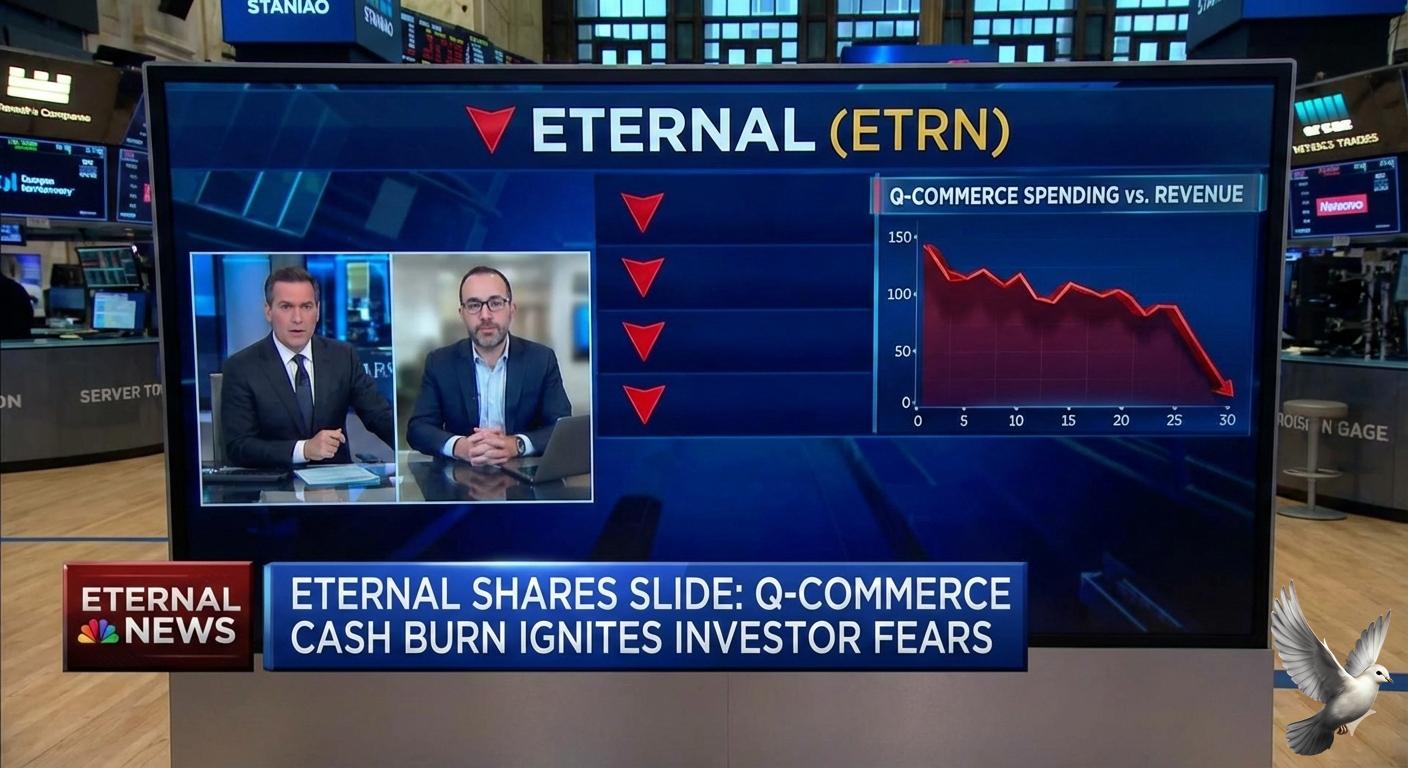
Eternal Shares Decline on Q-Commerce Cash Burn Concerns
**Eternal Stock Pressured by Quick Commerce Price War** The stock of online delivery platform **Eternal** faced immediate and intense investor pressure, dipping nearly **9%** despite the firm posting robust financial results for the December quarter. This sharp decline underscores deep market anxiety regarding escalating competitive intensity across the quick commerce sector, a risk that outweighed the company’s recent profitability milestones. Eternal delivered a spectacular quarter, with net profit surging over **50%** year-on-year and consolidated revenue jumping nearly **180%**. This phenomenal growth was primarily powered by the rapid scaling of its quick commerce vertical. That division alone averaged **2.6 million** orders per day during the reporting period, cementing its role as the company’s core growth engine. The core food delivery segment, meanwhile, maintained a stable, profitable performance, providing necessary support for the broader business expansion. A critical factor driving investor caution is the aggressive pricing environment. The quick commerce sector has spiraled back into a deep discounting phase, triggered by the strategic entry of deep-pocketed e-commerce behemoths. According to recent research, overall platform discounts rose sharply to **55%** in **January 2026**, an increase from **53%** in November. The surge has been most dramatic among new rivals, with discount levels nearly tripling over the preceding months. These competitors are leveraging massive balance sheet strength and extensive cross-platform synergies to drive customer acquisition. Tactics include offering zero delivery fees and implementing extreme promotional pricing, which is rapidly resetting consumer expectations for speed and cost. This intense pricing pressure presents a major dilemma for Eternal. While the firm had previously boosted its internal profitability by adopting a disciplined strategy of slower, more cautious store expansion, it is now compelled to aggressively increase spending to defend its hard-won market share. Executives have admitted that while profitability remains a focus, the immediate priority is responding to the current price war. Eternal holds a substantial **₹18,000 crore** of cash on its books, providing a crucial liquidity buffer to wage this ongoing battle. However, high operational costs tied to last-mile delivery and maintaining quick-turnaround infrastructure remain significant obstacles to sustained profitability across the industry. Rapid expansion into secondary markets, while promising future volume, is currently straining margins. Although operating costs are marginally lower in Tier-2 cities, the average order value in these regions is typically lower by **25%** to **30%** compared to metropolitan centers. This volume-versus-cost equation makes achieving sustainable contribution margins in new markets highly elusive for the entire sector. Analysts, while largely maintaining 'buy' ratings, have signaled their concern by trimming target prices. The central message from the brokerage community is clear: Eternal’s ability to sustain its rapid growth trajectory is now explicitly dependent on whether the competitive environment decides to become rational. The ongoing fight for customer loyalty, which executives acknowledge is fluid and heavily reliant on promotional pricing, continues to place severe pressure on unit economics. The long-term structural outlook remains strong. The entire global online grocery delivery services market is forecasted for massive expansion, projected to rocket from **$391.59 Billion** in 2025 to over **$1.51 Trillion** by 2031. Eternal must navigate the current irrational competitive phase effectively, balancing short-term market share defense against the imperative of cementing a long-term, sustainable path to profitability through operational excellence and logistical refinement.
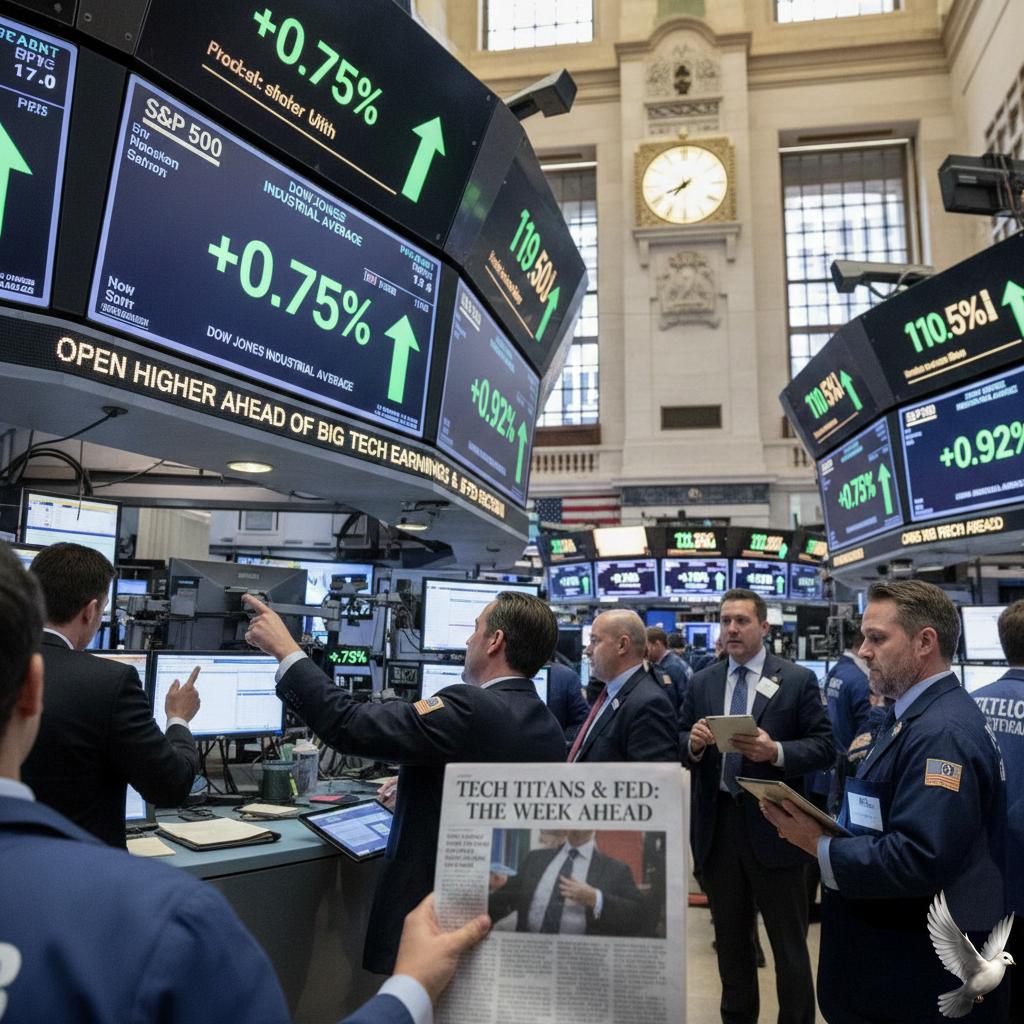
S&P 500, Dow Open Higher Ahead of Big Tech Results, Fed Decision
The start of a pivotal trading week saw **U.S. equities open mixed**, reflecting investor tension between upcoming Federal Reserve policy guidance and an intense crush of corporate earnings reports. The **Dow Jones Industrial Average** retreated, losing **285.30 points**, or **-0.58%**, signaling broad cautiousness across blue-chip stocks. In contrast, the technology sector provided support, pushing the **Nasdaq Composite** marginally higher by **+0.28%** to close at **23,501.24**. The broader **S&P 500** index finished essentially flat, ticking up only **+0.03%** to land at **6,915.61**. *** The primary macroeconomic focus remains squarely on the **Federal Reserve**. Policymakers are gearing up for their first **Federal Open Market Committee (FOMC)** meeting of the year this week. While the market widely anticipates the central bank will hold the **target rate steady** at its current range of **3.50% to 3.75%**, all attention is fixed on the accompanying statement and Chairman Powell’s commentary. Investors are actively seeking clarity on the timeline for future rate cuts, especially after the latest data showed stronger-than-expected economic resilience. The Fed has previously executed three consecutive rate cuts, but officials have signaled a higher bar for further easing without a clearer softening of the labor market or inflation trajectory. The consensus is focused on forward guidance, ensuring that policymakers do not inadvertently rule out options for the remainder of **2026**. *** Corporate performance is set to dominate headlines, with approximately **one-fifth of all S&P 500 companies** scheduled to report quarterly results. This earnings deluge is crucial given that the S&P 500 is trading at a high valuation multiple of over **22 times** expected earnings. The spotlight is brightest on the massive technology companies known as the **Magnificent 7**. Key reports are expected this week from giants including **Apple, Microsoft, Meta Platforms, and Tesla**. Market participants are looking for concrete evidence regarding the sustained strength of the **Artificial Intelligence (AI)** investment theme and its real impact on corporate profit margins. A failure to meet the already high earnings bar could trigger a significant repricing across the technology sector. Early sector performance was highly differentiated. **Materials** led gains for the day, rising by **+0.91%**, followed by **Consumer Staples** up **+0.74%**. Conversely, the **Financials** sector was the steepest laggard, dropping **-1.38%**, while **Industrials** also saw significant weakness, falling **-0.82%**. *** External factors continued to introduce volatility, notably a severe **winter storm** that swept across the United States. The extreme weather left over **one million Americans** without power, providing an immediate shock to the energy complex. **Natural gas futures** climbed sharply, increasing by **4.5%** as demand surged across the country. Geopolitical risks have also recently rattled stability. Although major U.S. indexes rebounded later last week, the impact of renewed trade tensions and the controversy surrounding President Donald Trump's rhetoric on **Greenland** caused initial global market turbulence. This demonstrates the fragility of risk sentiment amid a high-stakes macro and political calendar. In the commodities space, precious metals continue to attract safe-haven flows, pushing **Gold** prices to an all-time high, recently topping **\$5,000 per ounce**. This rise reflects underlying investor anxiety regarding both global political uncertainty and the long-term outlook for government bonds, with fears of heavy sovereign borrowing eroding value.

Asian Paints Q3 Earnings Preview: 8% YoY PAT Growth and Volume Pickup Expected
**Market Brief: Asian Paints** Asian Paints is navigating a highly competitive landscape, with the market focus shifting squarely to margin protection amid challenges in pricing and top-line expansion. The company’s latest quarterly performance, covering the December quarter, reflects a strong operational resilience driven by favorable input costs. The dominant narrative for the period is a significant divergence between volume and value growth. While volume recovery is palpable—with analyst estimates pointing toward high single-digit to low **double-digit volume growth** in the core decorative business—overall revenue growth remains tepid. Consolidated revenue is projected to grow modestly, with consensus estimates hovering between **3.5% and 6.5%** Year-over-Year (YoY). This muted value growth stems from persistent pricing pressure in the market and a shift in consumer preference toward lower-priced categories, known as downtrading. *** The key driver of financial outperformance is material cost deflation. Profitability is set for notable expansion, marking the largest positive swing of the quarter. This margin improvement is directly linked to the steady softening of prices for crude oil derivatives and Titanium Dioxide (TiO₂), which are critical raw materials. Crude oil derivatives alone account for roughly **40%** of the industry's raw material costs. The easing of global crude volatility provides a crucial structural tailwind, boosting the company’s operating margin (EBITDA margin). Consequently, the net profit (PAT) for the quarter is projected to register a healthy surge, with many analyses forecasting a YoY increase of around **8%**. This profit resilience underscores effective cost management and operational efficiency offsetting the weaker pricing environment. *** Despite the subdued decorative demand, the business-to-business (B2B) and industrial segments are providing solid support, stabilizing overall performance. This diversification helps mitigate the cyclical nature of retail housing demand. The company continues to reinforce its market leadership through strategic initiatives aimed at backward integration. Major capital expenditure projects are underway, including a new manufacturing facility with a substantial **4 lakh kilolitres** per annum capacity, intended to be commissioned in the coming three years. Such moves are designed to increase self-sufficiency in key intermediates and cushion profitability against future raw material price shocks. *** In the broader market context, Asian Paints maintains a premium valuation, with its stock trading near **₹2,700** per share as of the latest market close. The stock carries a high trailing P/E ratio, exceeding **65**, suggesting the market already prices in expectations of continued margin expansion and future volume dominance. Investor sentiment remains stable, with dealer confidence reported to be high regarding product quality and service delivery. The company’s focus on maintaining market share and protecting margins through superior execution, rather than aggressive price hikes, defines its current strategic stance in a highly competitive sector. The resilience of the distribution network and strong brand equity remain the primary defense mechanisms against both new and existing large-scale competitors in the Indian paints and coatings market.
Shadowfax IPO GMP Signals Discounted Listing; SME Sentiment Subdued
🌍 Global and Indian Market Brief: January 26, 2026 🇮🇳 India Market Holiday and Recent Sell-off Indian equity markets are **closed** today, Monday, January 26, for the Republic Day national holiday. Trading will resume tomorrow, Tuesday, January 27, across the NSE, BSE, and MCX. In the last session on Friday, January 23, markets experienced a sharp downturn driven by profit-booking, mixed Q3 corporate earnings, and geopolitical uncertainty. The benchmark Nifty 50 dropped by **0.95%** to close at **25,048.65** points. The BSE Sensex fell **0.94%** to **81,537.70** points. Broader markets saw more pronounced pressure, with the BSE Midcap index falling **1.6%** and the Smallcap index declining **2.2%**. In the last week, the Nifty 50 recorded a loss of **2.51%**. The total market capitalization of BSE-listed companies fell below **₹452 lakh crore** in the sell-off. The Indian Rupee has also depreciated, hitting a **record low** against the US Dollar. 📅 Key Events to Watch This Week The coming week is packed with market-moving events. The US Federal Reserve’s interest rate decision will be a major global focus. Domestically, market participants are preparing for the Union Budget for fiscal year 2026-27, which will be presented by the Finance Minister on **February 1**. This is expected to maintain its focus on capital expenditure and support for MSMEs. The ongoing quarterly corporate earnings season will also continue to influence sector performance. 🌐 Global Growth Outlook Remains Resilient The International Monetary Fund (IMF) projects global economic growth to remain resilient at **3.3%** in **2026**, a minor adjustment from the estimated **3.3%** in 2025. This steady headline number masks divergent forces across regions and sectors. A key tailwind is the surging investment related to **Artificial Intelligence (AI)**, which is driving capital expenditure in North America and parts of Asia and offsetting trade frictions. Global headline inflation is forecast to gradually ease from an estimated **4.1%** in 2025 to **3.8%** in **2026**. The United States is forecast to grow by **2.0%** in 2026, slightly higher than the prior year, while the Eurozone's growth is expected to slow to **1.3%**. India remains a global growth leader, with the IMF lifting its FY2026 GDP growth forecast to **7.3%**. 💲 Commodities and Currencies Precious metals are seeing upward momentum. Gold futures have surged, driven by a weakening US Dollar and renewed hopes for Fed rate cuts later in the year. The US Dollar Index (DXY) recently stood at **97.203**. The USD/INR rate closed at **91.5570** on Friday. Brent Crude oil is trading around **$65.94** per barrel, while WTI Crude is near **$61.14** per barrel. In other commodity news, the silver producer Fresnillo will release its Q4 trading update on **January 28**, with investors focused on silver and gold output figures. 📊 Market Projections While downside risks persist from geopolitical tensions and potential reassessment of AI-driven productivity gains, the medium-term outlook for equities remains constructive. Forecasts for 2026 suggest a possible Nifty 50 target of **27,500** to **30,000** points, with a strong emphasis on technology-related earnings and domestic reforms. Emerging Market (EM) equities are generally positioned for robust performance, supported by lower local interest rates and attractive valuations.
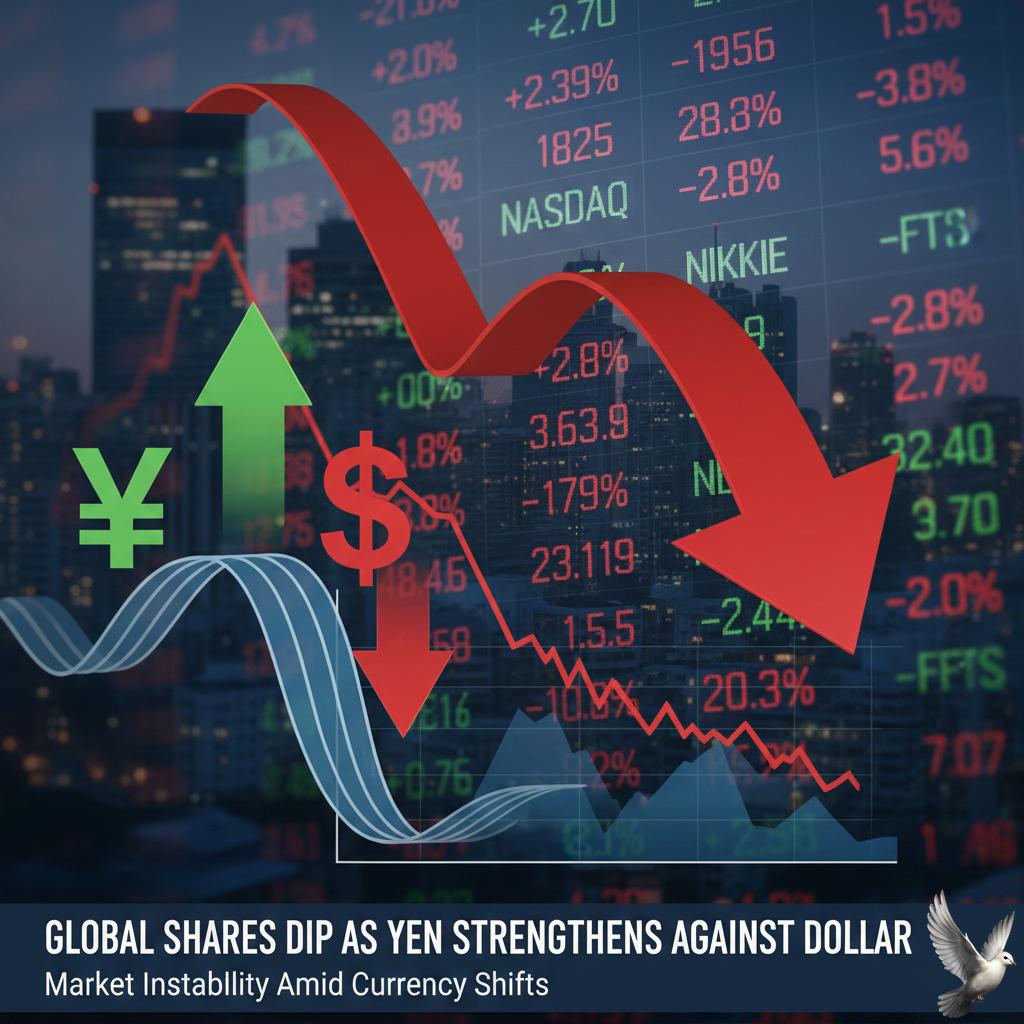
Global Shares Dip as Yen Strengthens Against Dollar
Global equity markets began the week on a defensive footing, with Asian sessions marking notable declines driven by a sharp shift in the currency landscape. The benchmark **Nikkei 225** in Japan plummeted, closing down **1.8%** at **52,870.15**. This tumble was directly linked to the rapid appreciation of the Japanese yen, confirming the prior session's dominant market theme. The sudden strengthening of the yen immediately pressured Japan's heavyweight exporting sector. Shares of major conglomerates, such as **Toyota Motor Corp.**, fell by **4%**, as a stronger domestic currency severely erodes the value of overseas earnings when repatriated. In the currency markets, the **U.S. Dollar/Japanese Yen** pair plunged to trade near **153.575**. This marks a steep drop from levels around **158.00** seen last week, highlighting the magnitude of the yen's rebound. Currency volatility has spiked on persistent market chatter regarding coordinated **U.S. and Japanese intervention**. Authorities signaled a readiness to act to stabilize the yen after its protracted slide, triggering a significant technical and sentiment-driven rally for the Japanese currency. Losses were observed across other regional benchmarks, although to a lesser extent. South Korea’s **Kospi** dipped **0.7%**, while the **Hang Seng** in Hong Kong tracked marginally lower. China’s **Shanghai Composite** was the exception, managing a small gain of **0.1%** amid low trading volume. Sentiment carried over into Western trading hours. U.S. equity futures for the **S&P 500** and **Dow Jones Industrial Average** indicated a soft open, trading down approximately **0.3%** each. Uncertainty surrounding U.S. tariff policy remains a drag on investor confidence. European markets were largely subdued coming off Friday’s session, where major markets settled **flat**. However, attention is shifting squarely to the upcoming slate of high-impact economic data, setting the stage for increased volatility across the region. This week's macro calendar is dominated by policy decisions. The **Federal Open Market Committee (FOMC)** meeting, concluding on Wednesday, is the primary event. While markets widely anticipate the Federal Reserve will keep rates steady, comments from the Fed Chair will be heavily scrutinized for any shifts in the forward guidance on easing. Key economic indicators are also due. Traders will watch for U.S. **Initial Jobless Claims** and German **Unemployment Change** figures, which will influence expectations for global monetary policy paths. Furthermore, Japanese **inflation prints** are due, adding complexity to the Bank of Japan's delicate balancing act. The earnings season is hitting its peak with crucial reports from the technology giants this week. Investors await results from **Microsoft, Meta Platforms, Tesla, and Apple**, seeking fresh signals on artificial intelligence adoption and overall corporate health into the new year. The underlying backdrop of geopolitical risk and shifting fiscal policies continues to keep fixed income and commodity markets watchful.
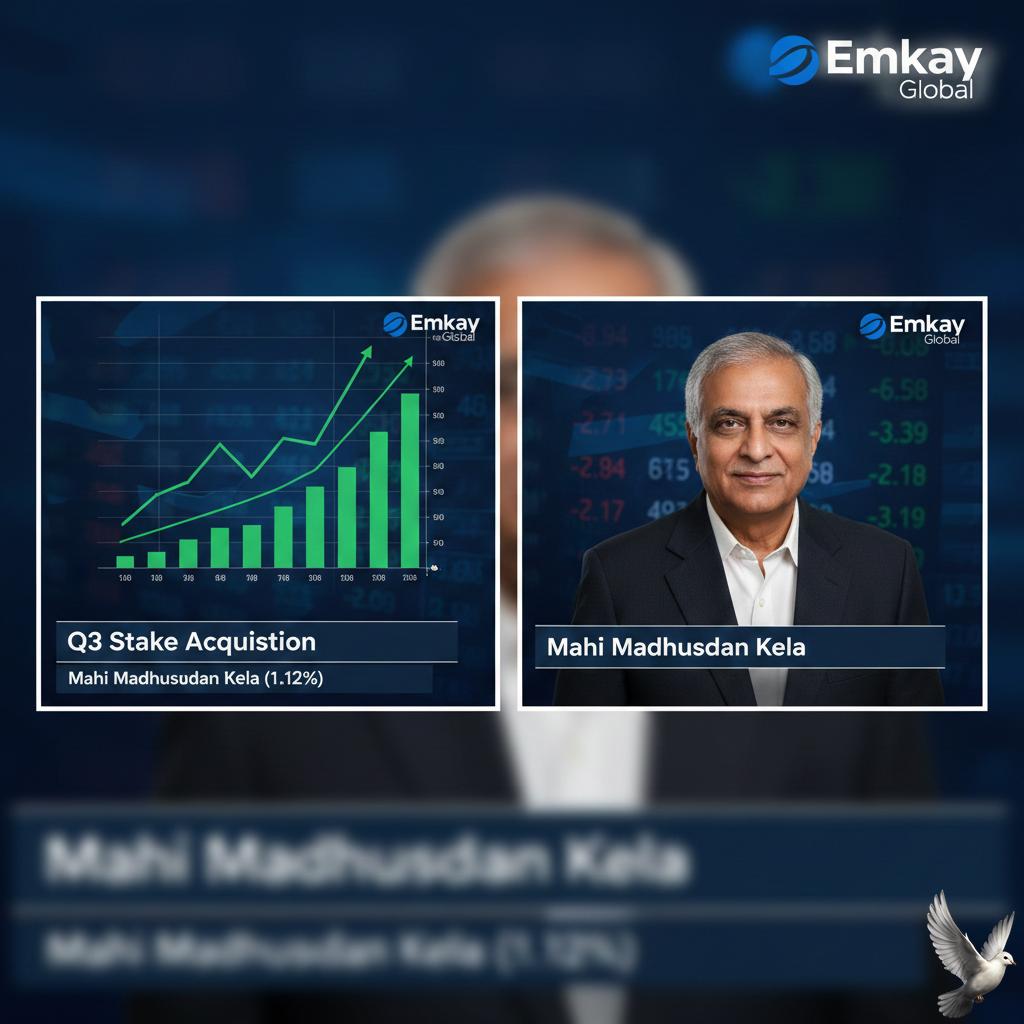
Emkay Global reports Q3 stake acquisition by Mahi Madhusudan Kela (1.12%)
Emkay Global Financial Services is currently under sharp market focus following a period of persistent price decline, contrasting with encouraging corporate activity and fundamental performance. The stock's latest traded price stands near **₹281**, placing the company's market capitalization at roughly **₹729 Crore**. *** **Recent Price Weakness and Long-Term Value** The stock has shown significant short-term weakness. Over the last three months, shares have declined by more than **15%**. This steep drop starkly contrasts with the relatively modest fall seen in benchmark indices such as the Nifty and the BSE Sensex during the same volatile window. However, this recent underperformance must be viewed against a backdrop of exceptional long-term gains. Despite recent consolidation, Emkay Global remains categorized as a strong performer over a multi-year horizon, having delivered compounded returns of approximately **283%** over the previous three years. *** **Strategic Investment and Ownership Stability** High-profile investor activity recently highlighted the stock's potential. Investor **Mahi Madhusudan Kela** acquired a **1.12%** equity stake in the company during the December 2025 quarter. This purchase, amounting to approximately **2.9 lakh equity shares**, signals fresh institutional confidence precisely as the stock underwent its correction phase. The overall ownership structure remains highly stable. Promoters maintain a significant holding, controlling just over **71.90%** of the company. This substantial insider stake is often interpreted by the market as a strong indication of management’s conviction in the business’s future prospects. *** **Robust Financial Momentum** The company's operational strength continues to build. Emkay Global operates a comprehensive financial services platform that spans institutional equities, wealth management, and investment banking. This diversification fueled substantial earnings momentum in the most recent fiscal period. For the Fiscal Year **2025**, Consolidated Total Revenue reached **₹361.24 Crore**. This figure reflects a solid year-on-year growth rate approaching **15%**. Profitability soared during the same period. The Profit After Tax (PAT) for FY **2025** was reported at **₹56.83 Crore**, representing impressive growth of more than **75%** over the previous fiscal year. *** **Market Positioning and Outlook** Emkay Global’s operational capability is anchored by its strong institutional research vertical, which provides coverage for over **200** companies. This focus is vital for serving its sophisticated client base, which includes foreign institutional investors and domestic mutual funds. While the stock is currently subject to elevated volatility, its technical structure remains resilient. The share price is trading above its key **50-day** and **200-day** Simple Moving Averages. This technical support suggests that despite short-term turbulence, the primary underlying bullish trend established over the last few years remains largely intact. The current valuation, with a P/E ratio of approximately **32.68**, positions it above industry peers, demanding continued superior earnings growth to justify the premium.

Promoter Pledges Reduced in 10 Stocks in Q3FY26
💊 Healthcare and Infrastructure Market Snapshot Recent Indian equity markets have shown volatility, influenced by mixed earnings and persistent foreign institutional investor (FII) outflows. The broader market indexes, like the **BSE Sensex** and **Nifty 50**, ended a recent week with declines, posting a monthly loss. Foreign capital movement and geopolitical risks, including news concerning the **Adani Group**, have contributed to the cautious investor sentiment. However, underlying economic indicators, such as accelerated private sector growth in January 2026, driven by manufacturing and services, suggest a degree of domestic resilience. **Onesource Specialty Pharma (ONESOURCE)** The stock for Onesource Specialty Pharma is currently exhibiting a **downtrend** in the intraday session. As of the last available closing price on January 23, 2026, the share price was **₹1,432.40** (NSE). The stock is trading near its **52-week low** of **₹1,209.95**. The company's latest consolidated financials for **Q3 FY26** reported a net loss of **₹88.70 crore**, with a year-on-year revenue decline of **26%** to **₹2,903 million**. Despite the negative technical and financial news, the analyst consensus remains a **Buy** rating, with **100%** of analysts recommending it. Promoter shareholding saw a slight uptick in the December 2025 quarter, reaching **29.93%**. **Apollo Hospitals Enterprise (APOLLOHOSP)** Apollo Hospitals Enterprise continues to garner a strong **Strong Buy** consensus from analysts, with **88.46%** holding a Buy rating. The stock's average analyst **12-month target** is around **₹8,718.34**. The stock price, as of January 23, 2026, closed at **₹6,797.00**. The stock's intraday trend is currently moving **sideways**. Key institutional activity includes a notable block deal in November 2025 where **Bank of America (BOFA)** acquired a significant stake from Goldman Sachs. Foreign Institutional Investors (FIIs) hold a substantial stake of **43.54%** in the company. **GMR Airports Infrastructure (GMRAIRPORT)** GMR Airports stock closed recently at **₹95.10**. The 52-week range is wide, between a low of **₹67.75** and a high of **₹110.36**. The company has demonstrated good revenue growth, with a **3-year growth rate of 218.61%**. However, it is currently trading at a high Enterprise Value to EBITDA (EV/EBITDA) of **126.09**. The company announced a corporate action to redeem **₹5,000 crore** Non-Convertible Bonds (NCBs) by August 30, 2025. **Promoter Decreasing Pledge Trend** A positive sign in corporate governance and investor confidence is the recent trend of promoters decreasing the percentage of their shareholding pledged. This reduction in pledged shares is often viewed as easing the pressure of potential forced selling. Notable companies that reduced their pledged promoter holdings in the **December 2025 quarter (Q3 FY26)** include: * **GMR Airports** saw its pledge reduced to **15.51%** from 16.61%. * **JSW Steel** decreased pledged shares to **11.70%** from 12.47%. * **Wockhardt** lowered its pledged shares to **18.04%** from 21.30%. * **Gujarat Fluorochemicals** showed a sharp reduction to just **0.01%** from 0.86%. This trend of unencumbering shares signals a favorable development in the outlook for these specific stocks.

Axis Bank Q3 Net Profit Rises 3% to Rs 6,490 Crore; Interest Income Up 4%
Axis Bank: Q4 FY24 and Current Market Pulse The bank’s financial momentum accelerated through the close of the fiscal year, with core performance metrics signaling strong operational discipline and growth. The results for the January-March quarter (Q4 FY24) significantly surpassed the preceding December quarter (Q3 FY24). The standalone net profit for Q4 FY24 surged to **₹7,130 crore**, marking a substantial **17%** quarter-on-quarter increase. This robust performance follows the December quarter, where standalone profit stood at **₹6,490 crore**. For the full financial year (FY24), the bank’s net profit reached **₹24,861 crore**. *** Net Interest Income (NII), a critical measure of core lending profitability, grew **11%** year-on-year in Q4 to **₹13,089 crore**. This sustained growth trajectory helped the bank post an NII of **₹49,894 crore** for the entire fiscal year. The Net Interest Margin (NIM) reflected strength, standing at **4.06%** in Q4, an increase of **5 basis points** sequentially. The Core Operating Profit further cemented this momentum, rising **15%** year-on-year to **₹10,536 crore**. Non-interest revenue streams remain highly lucrative. The bank’s fee income in Q4 saw a **23%** year-on-year jump, reaching **₹5,637 crore**. Crucially, **74%** of this fee income was generated from granular retail fees, which climbed **33%** year-on-year. *** The balance sheet expansion is measured and concentrated on high-growth segments. Total advances grew **14%** year-on-year, driven primarily by the retail segment. Retail loans expanded a strong **20%** year-on-year, highlighting successful penetration across consumer and priority sectors. Rural loans saw exceptional growth, surging **30%** year-on-year. Deposit mobilization was robust, with total deposits growing **13%** year-on-year. The Current Account and Savings Account (CASA) ratio, a key indicator of low-cost funds, was maintained at a healthy level of approximately **43%**. *** Asset quality continues its significant improvement trend, reflecting vigilant credit underwriting. The Gross Non-Performing Assets (GNPA) ratio showed substantial decline, improving to **1.43%**, a reduction of **59 basis points** over the last year. Similarly, the Net Non-Performing Assets (NNPA) ratio now stands at a low **0.31%**. The Provision Coverage Ratio (PCR) is maintained at a comfortable **79%**, providing ample buffer against potential stress. *** The strong operational foundation is mirrored in the bank’s equity performance. The stock currently trades around **₹1,258**, having delivered a commendable one-year return of approximately **31.87%**. The bank holds a significant market capitalization of over **₹3,90,000 crore**. This outperformance aligns with the broader Indian banking landscape, which is currently enjoying record profitability and improved structural health. System-wide credit growth remains strong, while the average industry Non-Performing Loan ratio has reached multi-decade lows of around **2.1%**. As the third-largest private sector lender, the bank is well-capitalized, maintaining a Total Capital Adequacy Ratio (CAR) of **16.63%**, positioning it for sustained market share gains and strategic expansion, particularly as the integration of the Citi India consumer portfolio approaches its final milestones. The clear strategic focus remains on digital engagement and targeted growth in small business and mid-corporate segments.
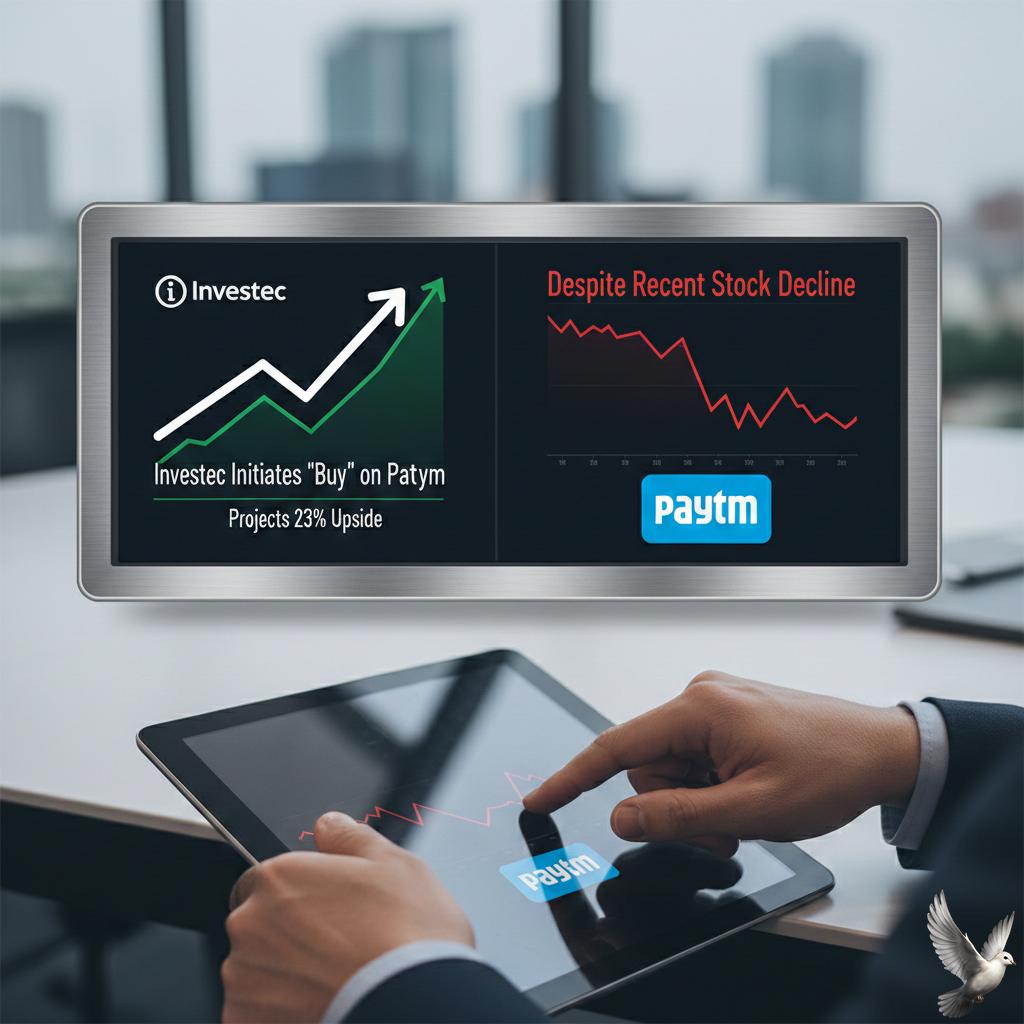
Investec Initiates 'Buy' on Paytm, Projects 23% Upside Despite Recent Stock Decline
**Professional Market Brief: One 97 Communications Ltd.** The investment thesis for **One 97 Communications Ltd. (Paytm parent)** remains robust, fueled by India's structural shift toward a fully digital financial economy. A major brokerage recently initiated coverage with a **Buy** rating, establishing a price target of **₹1,550**. This forecast implies an upside potential of approximately **23%** from the recent trading price, despite significant short-term stock volatility. The company’s trajectory is underpinned by three foundational growth pillars. *** Pillar 1: The Digital Toll Road The primary driver is the sheer scale and efficiency of India’s digital payments infrastructure, where the fintech operates essentially as a **"toll road."** This core payments processing business earns a small fee on every transaction, benefiting directly from the exponential growth of the Unified Payments Interface (UPI). UPI has become the world’s leading real-time payment system. It now accounts for over **83%** of India’s digital payment volumes, demonstrating an unparalleled rate of adoption. In a single recent month, UPI transactions surpassed **16.73 billion**, moving a staggering value of **₹23.25 lakh crore**. This digital shift is far from saturation. The overall digital payments market in India is projected to expand more than **three times** in volume, rising from approximately **159 billion** transactions in the last fiscal year to a forecast of **481 billion** by FY 2028–29. This sustained, high-growth environment guarantees a continuous expansion of the company's addressable market and net payment processing margins. *** Pillar 2: Merchant Leadership and Ecosystem Scale The second key trigger is Paytm’s entrenched merchant leadership and its physical distribution network. The company has successfully established the largest payment ecosystem in India, boasting a registered merchant base that exceeds **4.2 crore**. This dominant presence is visible in its massive deployment of devices, with more than **112 lakh** payment devices currently facilitating transactions across the country. In the crucial offline market, the fintech commands a market share exceeding **50%**. This large, sticky footprint translates directly into steady, recurring subscription revenue, primarily through devices like the Soundbox and card machines. Device subscription revenue is projected to see a compounded annual growth rate (CAGR) of over **22%** in the coming years. The platform processes an immense volume of commerce, with its quarterly Total Payment Volume (TPV) reaching approximately **₹570,000 Crore**. This scale ensures sustained device rental income and provides critical cross-selling opportunities for financial services. *** Pillar 3: Rising Operating Leverage The third trigger is the expected realization of rising operating leverage. Operating leverage occurs when fixed costs are spread across a rapidly growing revenue base, resulting in faster profit growth compared to revenue growth. The company’s strategy of leveraging its existing payments infrastructure to distribute profitable financial services—such as lending, insurance, and wealth products—is central to this outlook. Despite short-term regulatory headwinds, which included the expiration of a **₹128 crore** RBI incentive, management is focused on offsetting this impact through optimized pricing and targeted sales efforts. Brokerage estimates anticipate a sharp increase in profitability, projecting a year-on-year EBITDA growth rate of **44%** and PAT (Profit After Tax) growth of **52%** for the upcoming quarter. The consensus view is that as the high initial investment in customer acquisition and technological infrastructure matures, the incremental revenue generated by the core payments "toll road" will flow disproportionately to the bottom line, accelerating the path toward sustained long-term profitability and value creation.

Market Timing in a VUCA Environment
The established Western economic architecture, long defined by post-Second World War stability and US multilateral leadership, is now fracturing under the strain of unpredictable policy shifts. This dynamic is manifesting as extreme market volatility and a structural rerouting of global capital. *** Market Volatility and The AI Anchor US equity indices recently showcased this tension. Early this week, the **Dow Jones Industrial Average** dropped **1.32%** to **48,706** points, and the **S&P 500** fell **1.39%** to **6,843** points following escalated geopolitical rhetoric and threats of cross-Atlantic tariff hikes. However, the technology sector provided a critical counterweight. The **Nasdaq Composite**, anchored by high-growth mega-cap names, demonstrated resilience, rallying later in the week to **23,501** points. This performance reflects a persistent investor conviction in domestic artificial intelligence (AI) and productivity gains, offsetting broader trade uncertainty. *** The Economic Cost of Protectionism The most disruptive policy action is the aggressive pivot toward trade protectionism. The US has imposed and scheduled tariffs that elevate the weighted average applied tariff rate to an estimated **14.0 percent**. This marks the highest average rate recorded since **1946**. Economists model this friction as a structural drag on growth. Current projections suggest the new policy landscape will ultimately reduce US GDP by **0.5 percent** over the next decade. Furthermore, trade-related uncertainty is expected to result in the loss of more than **500,000** full-time equivalent jobs nationwide. *** Inflation, Rates, and Currency Outlook Despite the external policy noise, the domestic US economy shows signs of strong underlying momentum. The Atlanta Fed’s latest GDPNow forecast put real GDP growth for the fourth quarter of 2025 at a robust **5.4 percent** annualized rate. Looking forward, 2026 growth forecasts generally hover near **2.5 percent**. Core PCE inflation, the Federal Reserve’s preferred measure, is estimated to cool substantially, falling toward **2.1 percent** by year-end. The monetary policy trajectory is clear: easing is expected. The Federal Reserve is anticipated to deliver two rate cuts of **25 basis points** each in 2026, likely starting around mid-year. This expected easing has already weighed on the US Dollar Index (DXY), which currently trades in the **97–98** range, representing a significant softening from previous highs. *** Geopolitical Risk and Safe Havens The fragmentation of the global order is driving capital into safe-haven assets. Recent military deployments and heightening US-Iran tensions in the Middle East caused an immediate and notable market reaction. **Brent crude** oil saw a surge of nearly **3 percent** in a single day, illustrating the tight coupling between geopolitical friction and energy prices. Gold has been a major beneficiary of this sustained uncertainty. The February gold contract recently closed near **$4,980** per ounce and is quickly approaching the psychologically significant **$5,000** threshold. Gold prices are up nearly **15 percent** since the start of the year, reflecting widespread institutional caution and a clear search for stability outside of traditional fiat and equity risk. *** The market environment is defined by a deep divergence: pockets of exceptional growth in AI-linked technology and US domestic consumer spending are constantly challenged by elevated policy uncertainty and trade war escalation. Global growth, estimated at **3.3 percent** for 2026, remains remarkably resilient, yet this resilience is navigating a landscape where the cost of doing business internationally is increasing and major bilateral trade flows are being fundamentally reconfigured.
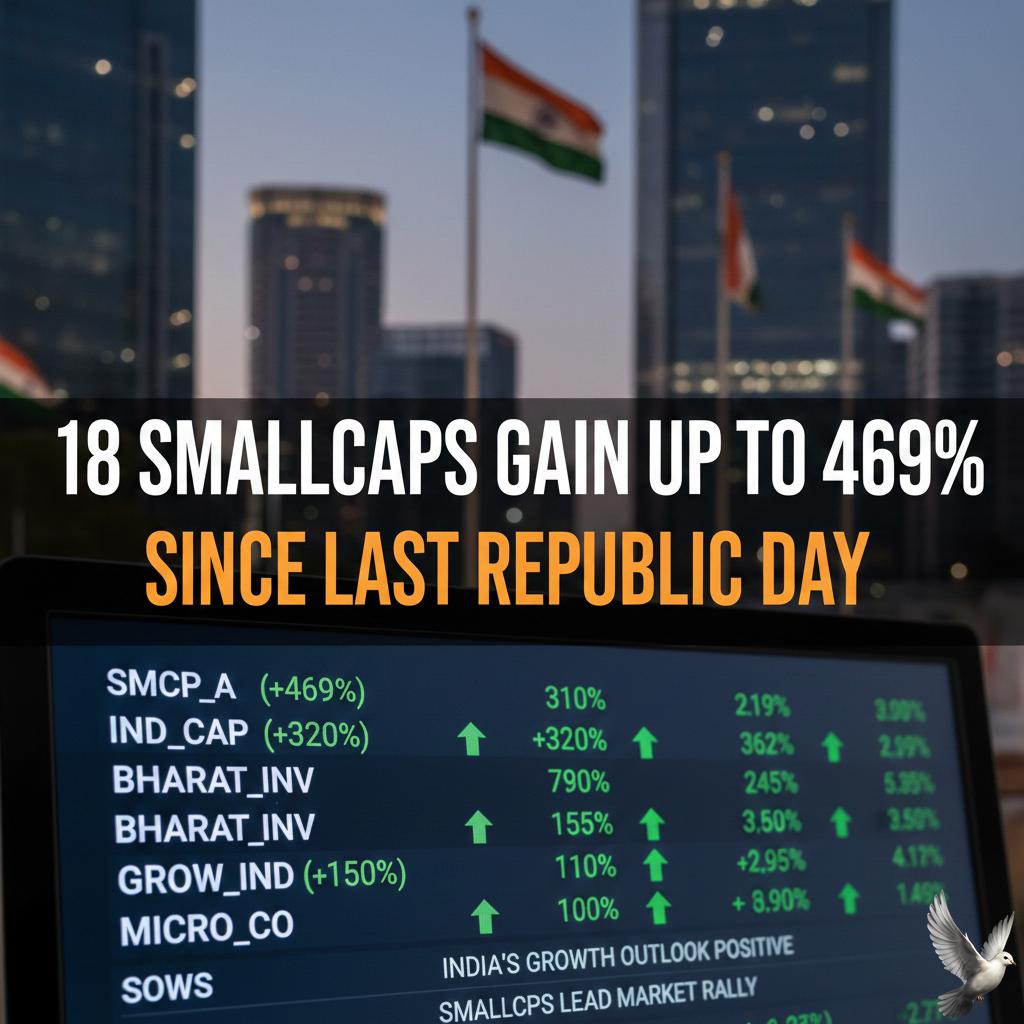
18 Smallcaps Gain Up to 469% Since Last Republic Day
🌎 Global Market Brief: January 2026 The global economy enters **2026** with continued **resilience**, projecting **3.3 percent** growth, a slight uptick from previous forecasts. This stability masks divergent forces, with strong **technology investment** serving as a major tailwind against persistent geopolitical and trade-policy headwinds. --- 📈 Equity & Macro Indicators Stock markets remain buoyed, particularly by the tech sector's momentum. The **S&P 500 Index** recently closed at **6,915.61**, showing a **13.35%** change over the past 12 months. Developed and Emerging Markets are broadly expected to post **double-digit gains** for the year, supported by anticipated **earnings growth** and an easing monetary policy environment. In the US, economic growth is expected to rebound to **2.2%** in 2026, driven partly by fiscal stimulus and a forecast of **Federal Reserve** rate cuts. The Fed is expected to ease its policy rate to a range of **3.0% to 3.25%** by year-end, which should further improve financial conditions. --- 🔥 Inflation & Interest Rate Outlook **Inflation** is proving sticky and is expected to hover above central bank targets for the US. US Core PCE inflation is forecast to average **2.7%** in 2026, still elevated from the Fed's 2% goal. Global headline inflation, however, is broadly projected to decline from an estimated **4.1 percent** in 2025 to **3.8 percent** in **2026**. The persistence of inflation is partly attributed to the lagged effects of trade tariffs, a weakening US dollar, and tight labor supply. Conversely, falling **crude oil prices** and a gradual convergence of shelter inflation are mitigating factors. For the **Bank of Japan**, officials are expressing greater confidence in reaching the **2%** inflation target, signaling a potential move toward a **higher rate regime** later in the year. --- 💻 The AI-Driven Technology Sector **Artificial Intelligence (AI)** is the undeniable **backbone** of the 2026 technology landscape, moving from fragmented pilots to core enterprise architecture. This marks the "Year of Truth for AI," demanding a shift from hype to measurable **proof-of-impact**. Key trends include the rise of **Agentic AI**—autonomous agents handling end-to-end workflows—and the concept of **"AI is Eating Software,"** where development shifts from manual coding to simply "expressing intent." Furthermore, **Physical AI**, including the proliferation of general-purpose **humanoid robots**, is bringing machine intelligence into the physical world and smart infrastructure. These advancements are fueling substantial **technology investment** globally. --- ⛽ Energy Markets & Commodities The **crude oil market** is facing an oversupply outlook, which is expected to drive prices lower through the year. The **Brent crude oil** spot price is projected to average around **$56 per barrel** in **2026**, down from **$69/b** in 2025. This downward pressure stems from strong **global oil production growth** outstripping consumption. This supply growth is being driven by producers outside of OPEC+, primarily from countries in South America, who are forecast to increase production by **0.6 million barrels per day** in 2026. While geopolitical tensions and threats of military action in key regions have caused recent price upticks, the overall fundamental picture points to rising global inventories. --- ⚠️ Key Risks on the Horizon Despite the stable headline growth forecast, risks are skewed to the downside. A significant concern is a **reevaluation of AI productivity expectations**, which could trigger an abrupt financial market correction, spreading from highly-valued **AI-linked companies** to the broader market. The ongoing uncertainty from **geopolitical tensions** and escalating **trade conflicts** also remains a substantial threat to global supply chains and commodity price stability.

Gold Reaches $5,000, Silver Gains 8% in Post-Republic Day Market Outlook
Global gold prices have achieved an historic milestone, surging past the **$5,000 per ounce** threshold for the first time ever. This definitive breakout confirms a significant structural shift in investor allocation, driving the metal to a fresh record high around **$5,024** per ounce in the spot market. The move marks the continuation of an unparalleled rally, with gold prices advancing more than **16 percent** in the initial weeks of 2026 alone. This follows a powerful run throughout 2025 where the metal delivered gains of approximately **64 percent**. This momentum is rooted in intense safe-haven demand. *** Silver, often considered gold's more volatile counterpart, has delivered an even more striking performance. The metal has also achieved a historic peak, breaching the three-digit mark to trade decisively above **$100 per ounce**, settling around **$104.72** in recent sessions. Silver’s rally is a dual-engine phenomenon. It benefits from the same safe-haven flows supporting gold, while simultaneously capitalizing on fundamental industrial tightness. The white metal posted an exceptional rise of roughly **147 percent** in 2025 and is building rapidly upon that foundation this year. *** This surge is magnified by a persistent structural supply deficit. Demand from the accelerating energy transition—specifically in **solar panel manufacturing**, **electric vehicles**, and **advanced electronics**—continues to outstrip mining capacity, creating a genuine physical scarcity that underpins the price gains. The intense run-up in both metals reflects a widening market unease regarding geopolitical stability and monetary policy direction. Renewed global tensions, particularly those concerning the **United States and NATO** over key strategic regions, have injected substantial volatility into traditional markets. *** This elevated geopolitical risk environment has accelerated capital rotation out of riskier assets, including a notable flight from fixed income instruments. This ongoing **bond selloff** dynamic sees investors moving aggressively into hard assets like gold as a hedge against financial instability and potential currency debasement. Furthermore, strong institutional buying provides a structural floor for prices. Central banks worldwide remain aggressive buyers, led by nations like China, which has extended its gold-buying spree for the **fourteenth consecutive month**. These official sector purchases underscore a clear long-term strategy of reserve diversification away from traditional fiat currencies. *** The consensus among analysts suggests the current bullish phase is far from complete, pointing to sustained support throughout 2026. Key institutions are updating their forecasts, with some predicting gold could climb toward **$6,100 to $6,700** per ounce by year-end, while silver may test the **$175 to $220** range, driven by ongoing deficits. However, after such explosive gains, market volatility is expected to remain high. The price action signals rebalancing in a market accustomed to lower valuations. For investors, the immediate environment demands a **wait-and-watch approach**. While the long-term fundamentals remain overwhelmingly bullish, tactical entry points may require patience. The prevailing sentiment favors strategic positioning rather than chasing record highs.

The Role of Gold and Silver in 2026 Asset Allocation
**Commodities Brief: Precious Metals as Strategic Assets** **Strategic Shift in Asset Allocation** PL Capital’s 2026 outlook signals a fundamental shift in how precious metals are viewed in portfolios. Beyond their traditional role as defensive hedges, gold and silver are now emerging as active building blocks for capital appreciation. This transition is driven by a unique convergence of monetary policy shifts, industrial super-cycles, and sustained central bank accumulation. **Current Market Snapshot (January 26, 2026)** The precious metals complex has maintained strong momentum entering late January. **Gold** is trading firmly near record highs, with international spot prices hovering around the **$4,700 per ounce** mark. On domestic exchanges (MCX), gold holds steady at approximately **₹1,60,260 per 10 grams**. **Silver** continues to outperform with high volatility, trading near **$94 per ounce** globally and **₹3,35,000 per kg** in domestic markets. **Key Drivers & Industrial Demand** Silver's aggressive pricing is underpinned by a structural deficit. The metal is benefiting from a "double demand" dynamic: its monetary role as a store of value and critical industrial applications. Surging requirements from the **solar PV**, **EV battery**, and **semiconductor** sectors are outstripping supply, creating a floor for prices even during consolidation phases. **Outlook & Sentiment** Market sentiment remains "moderately to strongly positive" for the remainder of 2026. Institutional inflows are being bolstered by central bank purchases, which have evolved from sporadic buying to a consistent trend of reserve diversification. With interest rate environments favoring non-yielding assets, the 2026 narrative places these metals central to growth strategies rather than just safety nets.

Joanne Goh Analyzes Investment Value in Gold, Silver, AI, and Indian Stocks
Market Outlook Brief: Commodities & Asian Equities **Date:** January 26, 2026 Precious Metals: Structural Bull Run Intact The rally in precious metals shows no signs of fatigue. Joanne Goh, Senior Investment Strategist at DBS Bank, maintains a **constructive outlook** on gold and silver, citing persistent structural drivers: US fiscal concerns, monetary debasement risks, and sustained central bank buying. Current market figures reflect this strength. As of today, **Gold (MCX)** is trading near **₹1.61 Lakh per 10g**, while **Silver** continues its impressive run, hovering around **₹3.35 Lakh per kg**. DBS has upgraded its 12-month gold price target to **$3,330/oz** (by 1Q26), viewing the metal as a critical portfolio diversifier against geopolitical volatility and currency risks. Silver is also favored for its dual role as a monetary hedge and a key industrial input for green energy technologies. --- AI Trade: Pivot to "Adapters" While the Artificial Intelligence theme remains a long-term growth engine, caution is advised regarding potential froth in pure-play technology stocks. The strategy is shifting from chasing overvalued tech giants to identifying **"AI Adapters"**—companies outside the tech sector that are effectively deploying AI to drive efficiency and widen margins. Investors are encouraged to look for value in large-cap firms with the capital and data advantages necessary to implement AI at scale, rather than speculative tech startups. --- India & Asian Equities: Where Value Emerges Despite recent volatility and FII outflows impacting the Nifty and Sensex (which closed sharply lower on Jan 23), the advice is to **maintain equity exposure**. **India Strategy:** Value is emerging in domestic-demand-centric sectors protected from global trade headwinds. Key focus areas include: * **Infrastructure & Capital Goods:** Supported by government capex. * **Banking:** Benefiting from credit growth and deregulation. * **Manufacturing:** Aided by "China +1" supply chain shifts. **Asian Regional Outlook:** Broader Asian markets are entering a "re-acceleration phase." **ASEAN equities** are projected to see earnings momentum improve, with banks serving as the best proxy for this growth. **Singapore equities** remain a strong pick for defensive yield, with the STI target set at **4,880 by end-2026**, driven by market reforms and safe-haven inflows. **Core Approach:** Adopt a "Barbell Strategy"—balancing secular growth themes (AI, aging population) with stable income generators (high-quality bonds, dividend-yielding equities, and REITs) to navigate ongoing geopolitical risks.

PSU Banks as Value Play in BFSI: An Analysis by Alok Singh
**Market Brief: BFSI Sector Outlook & Opportunities (Jan 2026)** **Sector Valuation & Entry Point** Current market volatility has opened a strategic window for Banking, Financial Services, and Insurance (BFSI) accumulation. Alok Singh, CIO at Bank of India Mutual Fund, identifies the present phase as a compelling entry point. Valuations have moderated significantly; the Nifty Bank index is trading at approximately **2.4x Price-to-Book (P/B)**, a discount to its historical average of **2.7x**. **PSU Banks: The Value Proposition** Public Sector Undertaking (PSU) banks have emerged as distinct value plays over private peers. Recent data indicates a structural shift, with PSU banks overtaking private lenders in credit growth for Q3 FY26 (posting **7–20%** growth versus **4–17%** for private banks). Despite the Nifty PSU Bank index correcting to near **8,780** levels in late January 2026, the segment retains strong momentum with a **1-year return exceeding 40%**. The divergence in valuation between public and private players continues to offer margin of safety for investors focusing on state-owned entities. **Structural Growth Drivers** The medium-term outlook remains anchored by robust fundamentals. Total bank credit has surpassed the **₹200 lakh crore** milestone, with aggregate credit growth accelerating to **~14.5% year-on-year** as of December 2025. Asset quality has reached multi-year highs. Gross Non-Performing Assets (GNPA) across the sector have compressed to approximately **2.31%**, the lowest in over a decade. This balance sheet clean-up, combined with India’s trajectory toward a **$7–8 trillion economy**, provides a long runway for earnings compounding. **Investment Stance** Short-term Foreign Institutional Investor (FII) selling and market fluctuations are transient noise. The sector's high correlation with GDP growth, coupled with revived deposit mobilization and strong return ratios (RoE), reinforces the case for systematic allocation. *** [**Metric to Watch: Alok Singh on Fund Strategy**](https://www.youtube.com/watch?v=EtsUw00bqxA) This video features Alok Singh discussing key metrics for mutual fund investing, providing direct insight into the investment philosophy driving Bank of India Mutual Fund's current sector outlook. http://googleusercontent.com/youtube_content/0
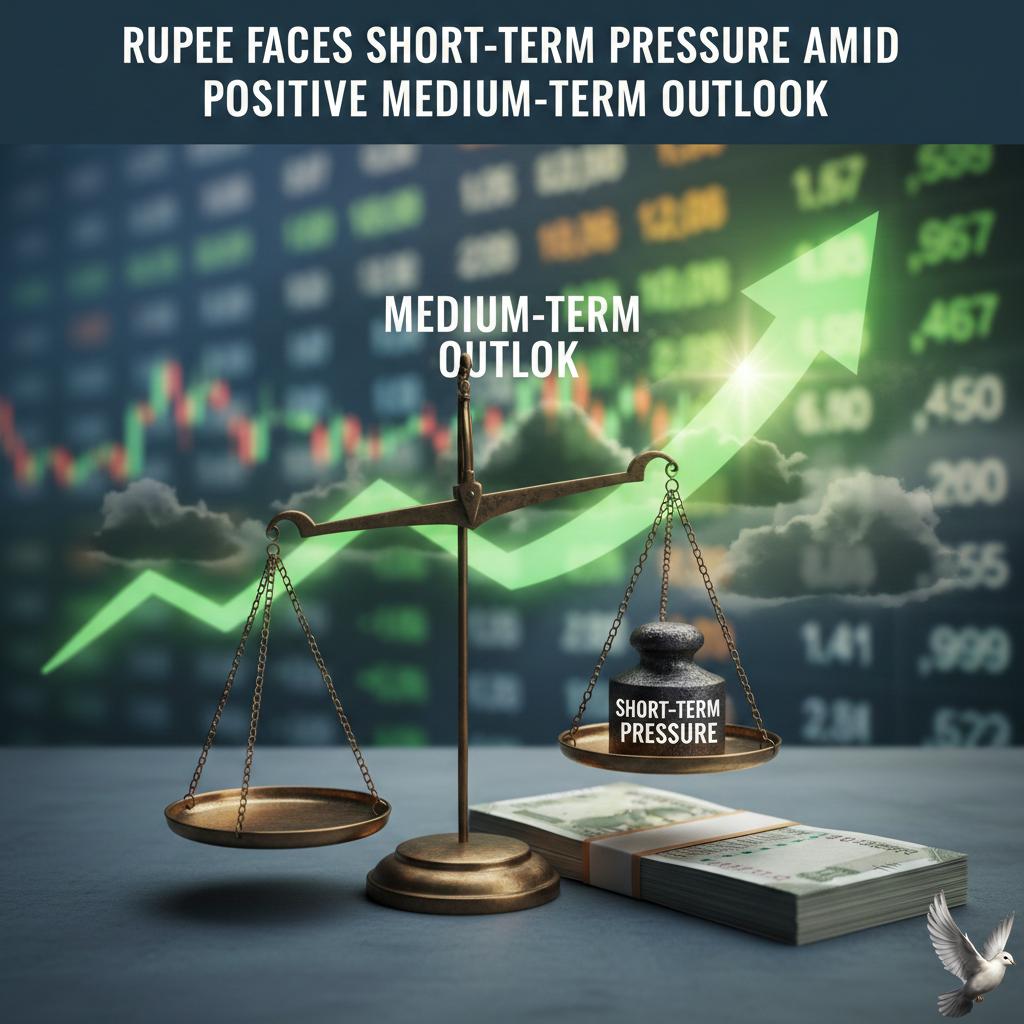
Rupee Faces Short-term Pressure Amid Positive Medium-term Outlook
**Market Brief: Rupee Outlook & Currency Trends** **Current Market Status** The Indian Rupee (INR) remains under significant strain, recently hitting record lows around **91.62–91.74** per US Dollar. Market pressure is pushing the currency toward the psychological **92** mark, driven by persistent foreign portfolio outflows and a widening Current Account Deficit (CAD). Data indicates foreign investors have pulled approximately **$2.7 billion** year-to-date, following nearly **$19 billion** in outflows last year. **Expert Projections** Abhishek Goenka of IFA Global forecasts continued near-term volatility, citing weak capital inflows and hesitation among exporters to sell dollars. However, the medium-term outlook for FY27 appears constructive. The rupee is expected to average below **90** in the next fiscal year, supported by favorable valuations—currently estimated to be **5%** undervalued—and potential triggers from new trade agreements. **Central Bank Strategy** The Reserve Bank of India (RBI) is actively managing volatility through selective intervention. The central bank has reportedly sold nearly **$45 billion** since October to curb sharp depreciation. To balance liquidity needs without choking the system, the RBI is utilizing foreign exchange swaps alongside spot market sales. This approach reflects a strategic choice to tolerate moderate weakness to preserve domestic liquidity and support growth. **Key Drivers & Risks** * **Exporter Dynamics:** While a weaker rupee offers partial margin relief to export-oriented sectors, order visibility remains low, limiting immediate dollar supply. * **Global Headwinds:** Geopolitical uncertainties and tariff-related risks continue to weigh on emerging market currencies. * **Valuation Support:** Forward premiums suggest one-year levels near **94.50–95.00**, indicating significant room for appreciation once external pressures stabilize.
Goldman Sachs Forecasts Earnings-Led Market Outlook and Potential Foreign Inflows for India in 2026
**MARKET BRIEF: GOLDMAN SACHS INDIA OUTLOOK 2026** **Upgrade to Overweight** Goldman Sachs has officially upgraded Indian equities to **Overweight** for 2026, forecasting an earnings-led recovery after a challenging 2025. Strategist Timothy Moe projects the Nifty 50 will reach **29,000** by year-end, implying a potential upside of approximately **14%** from late 2025 levels. The firm anticipates MSCI India earnings growth to accelerate to **15%** in 2026, up from an estimated **10%** last year. **Valuations and Market Drivers** While current valuations remain elevated—trading at roughly **22x** forward earnings—Goldman Sachs views them as "expensive but defensible" given India’s long-term growth trajectory. The valuation premium over other Asian markets has compressed, offering a more attractive entry point than previous highs. Returns in 2026 will likely be driven by consistent earnings delivery rather than further expansion of price-to-earnings multiples. **Foreign vs. Domestic Flows** Foreign Portfolio Investors (FPIs) sold over **$19 billion** in Indian equities in 2025, with outflows continuing into early 2026 ($2–3 billion). However, strong domestic participation, particularly through recurring SIP inflows, has provided critical market resilience. Goldman Sachs expects foreign inflows to return later in the year, triggered by evidence of earnings recovery, potential rate cuts, and a supportive Union Budget. **Sector Strategy** The outlook favors domestic cyclicals over export-oriented themes. Key "Overweight" sectors include: * **Financials:** Driven by a recovery in the private credit cycle. * **Consumption:** Focus on rural recovery, autos, and consumer staples. * **Defense & Oil:** Supported by policy stability and local manufacturing pushes. In contrast, the firm remains cautious on the IT services sector due to global AI-related disruptions and prefers broad industrial growth linked to domestic capex.
Nifty volatility and Kalyan Jewellers' potential rally noted ahead of Budget
**Market Brief: Week of January 26, 2026** **Market Pulse: Bears Tighten Grip** Markets remain closed today for Republic Day, but the setup for the upcoming Budget week is decidedly fragile. The Nifty 50 closed the previous session deep in the red at **25,048.65**, shedding **241 points (0.95%)**. The Sensex mirrored this weakness, plunging **769 points** to finish at **81,537**, driven by relentless FII selling and weak global cues. **Volatility Spikes Ahead of Budget** Anand James' warning of a "fragile technical setup" has materialized. The India VIX—the market's fear gauge—surged **6.31%** to settle at **14.19** on Friday, signaling heightened anxiety ahead of the Union Budget. This validates the forecast for "heightened volatility," with traders aggressively hedging positions as the index flirts with the psychological **25,000** support level. **Technical Outlook** The Nifty’s inability to sustain higher levels confirms the bearish grip. Technical data indicates that **24,700** is now the critical immediate support. On the upside, any relief rallies are likely to face stiff resistance near **25,400**. The "buy-on-dips" strategy is currently risky, with experts advocating for a cautious, sector-specific approach rather than broad index bets. **Stock in Focus: Kalyan Jewellers** Kalyan Jewellers has been battered, closing near **₹398** after hitting a fresh 52-week low of **₹390**. The stock has corrected approximately **32%** over the last six months, pushing it into "oversold" territory on technical charts. While the steep fall might trigger a short-term relief rally, analysts caution that the structure remains damaged. Support is seen in the **₹380–390** zone. However, any bounce toward **₹430–445** is viewed by technical desks as an exit opportunity rather than a trend reversal, unless the stock manages a decisive close above **₹460**.

Budget 2026: Potential Shift from Broad Rallies to Stock-Specific Focus
The Indian economy is undergoing a strategic recalibration, pivoting sharply away from a decade-long emphasis on consumption stimulus toward a new mandate of production enablement. This policy evolution reflects a move from a 'Buy India' consumption model to an aggressive 'Build India' industrial strategy. The shift is evident in key macroeconomic data for the fiscal year 2025–26. Gross Fixed Capital Formation, a crucial measure of investment, is projected to accelerate, growing at an estimated rate of **7.8%**. This surpasses the estimated growth rate for Private Final Consumption Expenditure (PFCE), which is pegged at **7.0%** for the same period. While consumption remains the single largest contributor to the GDP, the relative strength of investment signals a fundamental change in the drivers of economic expansion. Overall, India’s economic momentum remains robust. Real Gross Domestic Product (GDP) is forecast to expand by **7.4%** in FY 2025–26, according to official advance estimates. This strong performance, which led the IMF to upwardly revise India's growth outlook to **7.3%** for 2025, is primarily rooted in domestic resilience. The manufacturing sector is at the heart of the 'Build India' surge. The sector is estimated to achieve a strong growth rate of **7.0%** in FY 2025–26, a notable acceleration from the **4.5%** recorded in the previous year. High-frequency data supports this trend, with Industrial Production (IIP) increasing by **6.7%** year-over-year in November 2025, driven largely by an **8.0%** rise in manufacturing output. Capacity utilization across the manufacturing base stands near **75%**, indicating healthy demand and justifying further capital expenditure. A major catalyst for this production push is the government’s Production Linked Incentive (PLI) scheme. The cumulative actual investment realized under the various PLI schemes has crossed **₹2 lakh crore** (approximately $24 billion) as of late 2025. This targeted investment has leveraged substantial output, leading to incremental production and sales exceeding **₹18.7 lakh crore** across 14 key sectors. The electronics segment provides a clear success story. Domestic mobile phone manufacturing has surged to **₹5.45 lakh crore** in 2024–25, up nearly 28 times from a decade prior. Furthermore, smartphone export volumes climbed significantly, reaching **22.9 million units** in the first half of 2025, cementing India's emerging role in global supply chains. The economic landscape is being supported by broadly favorable macro conditions. Inflation, as measured by the Consumer Price Index (CPI), eased significantly throughout 2025, dropping to a multi-year low of **0.71%** by November. This benign inflationary environment provides the central bank with stability. Simultaneously, the job market is strengthening. The national unemployment rate has trended lower, reducing to **4.7%** in November 2025. This highlights a crucial outcome of the 'Build India' push: quality employment generation across the industrial heartland. In summary, policy emphasis is now firmly anchored on supply-side reforms and capital creation. The shift is transforming the economic growth narrative from being primarily consumer-driven to being structurally powered by investment, manufacturing output, and a decisive integration into global production networks.
NBFCs Pass Through Rising Funding Costs
MARKET BRIEF: NBFC FUNDING COST AND RETAIL PRICING DYNAMICS The current lending environment is marked by a clear paradox. Non-Banking Financial Companies (NBFCs) are facing climbing borrowing costs even as the central bank has maintained an easing monetary stance. Recent policy decisions saw the Reserve Bank of India deliver a cumulative **125 basis points** of repo rate cuts. However, this easing impulse is not translating effectively into lower funding costs for the non-bank sector. In fact, liquidity constraints and higher bond yields have driven up market borrowing costs for many NBFCs. *** Widening Corporate Cost Spread This has led to a significant widening of the cost differential between the non-bank sector and similarly rated corporate entities. The funding spread between NBFCs and corporates has hit a **four-year high**. As a specific example, an **AA-rated NBFC** currently pays approximately **75 basis points** more interest for a five-year loan compared to an AA-rated corporate borrower. This differential highlights the premium investors are demanding for exposure to the NBFC sector amid high credit growth and regulatory scrutiny. *** Retail Loan Pricing Adjustment Facing these elevated funding expenses, many NBFCs are compelled to adjust their retail loan pricing. While larger, highly-rated players are often able to absorb some of the pressure through margin compression, smaller and mid-sized entities are directly passing on the increased cost to the end customer. This is manifesting either as a direct increase in floating lending rates, or through the introduction of higher associated fees. For the relatively weaker, sub-prime segments served by NBFCs, lending rates typically start from **12% to 13%**. An upward rate adjustment of even **100 to 150 basis points** is being seen across certain retail portfolios. The result is that the intended benefit of the central bank's repo rate cuts is being blunted, or entirely offset, for numerous retail and MSME borrowers accessing credit through NBFC channels. *** Sector Growth and Asset Quality Despite the pressure on funding costs, the NBFC sector remains a key growth engine for domestic credit. Total credit expansion for the sector reached **17%** year-on-year in the first half of the current fiscal year. This significantly outpaces the bank credit growth rate of **12%**. Retail assets continue to be the primary driver, accounting for roughly **60%** of the industry’s overall credit book. Total Assets Under Management (AUM) for NBFCs is projected to reach approximately **₹48-50 lakh crore** by the end of March 2026. However, profitability metrics are under strain. Regulatory tightening, particularly around unsecured loans, is driving higher credit costs. Return on Average Managed Assets (RoMA) for the sector is forecast to decline by **30 to 50 basis points** over the next year compared to previous highs. *** Key Growth Segments Growth momentum remains robust in specific, less risky secured segments: **Gold Loans** are leading the charge, exhibiting strong annual growth between **30% and 35%**. The **Affordable Housing** segment, defined by loans under **₹25 lakh**, is also showing impressive expansion, with growth estimated at **22% to 23%**. Vehicle finance, particularly for **used vehicles**, remains a structural strength for NBFCs, with growth forecasts holding steady at **16% to 17%**. The challenge for the sector now is successfully managing asset quality in the unsecured retail space while diversifying funding sources to narrow the cost gap with corporate peers.