Bullish News
Collection
BPTP and Landowner Partner for 11-Acre Residential Development in Faridabad
BPTP Ltd has officially entered a joint development agreement to launch a premium residential project in Sector 39, Surajkund. This expansion involves an 11-acre land parcel secured through its subsidiary, Urban Realtech Pvt Ltd. The project is designed to deliver a massive developable area exceeding 2 million square feet. This move aligns with a broader trend of developers adopting asset-light models to scale operations without the heavy capital expenditure of outright land purchases. **Market Context & Connectivity** Faridabad is currently undergoing a structural transformation. The most significant catalyst is the proposed Gurugram–Faridabad–Noida Namo Bharat RRTS corridor. This ₹15,000 crore infrastructure project is expected to slash travel times across the NCR, repositioning Faridabad as a primary residential hub rather than just an affordable alternative. Property values in the region are already responding to these upgrades. Recent data indicates that plot prices in certain Greater Faridabad sectors have appreciated by nearly 400% over the last five years. **Key Figures & Sector Data** - Surajkund project size: 11 acres - Total developable area: 2 million+ sq. ft. - Average property rates in growth sectors: ₹5,000 – ₹8,000 per sq. ft. - Recent price appreciation in key pockets: Up to 33% annually - Infrastructure investment: ₹15,000 crore for regional rapid transit **Rising Demand for Luxury** The Faridabad market is shifting from mid-segment housing toward lifestyle-oriented communities. While affordable housing starts have slowed due to rising construction costs (up 25%–30%), demand for premium 3 BHK and 4 BHK units remains high, currently making up 54% of buyer inquiries. Surajkund is positioned as a differentiated micro-market. Its proximity to the Delhi border and the scenic Aravalli ecosystem makes it a preferred choice for high-net-worth individuals and professionals seeking larger homes with better natural integration. **Operational Updates** The Haryana government is further supporting this real estate surge with digital reforms. A pilot for faceless property registration is scheduled to launch in Faridabad by March 2026, aiming to streamline transactions and improve transparency for investors. This latest development by BPTP Ltd strengthens its existing NCR portfolio, which already includes massive townships and LEED-certified commercial hubs. The project is expected to set new benchmarks for density and luxury in the Surajkund corridor.
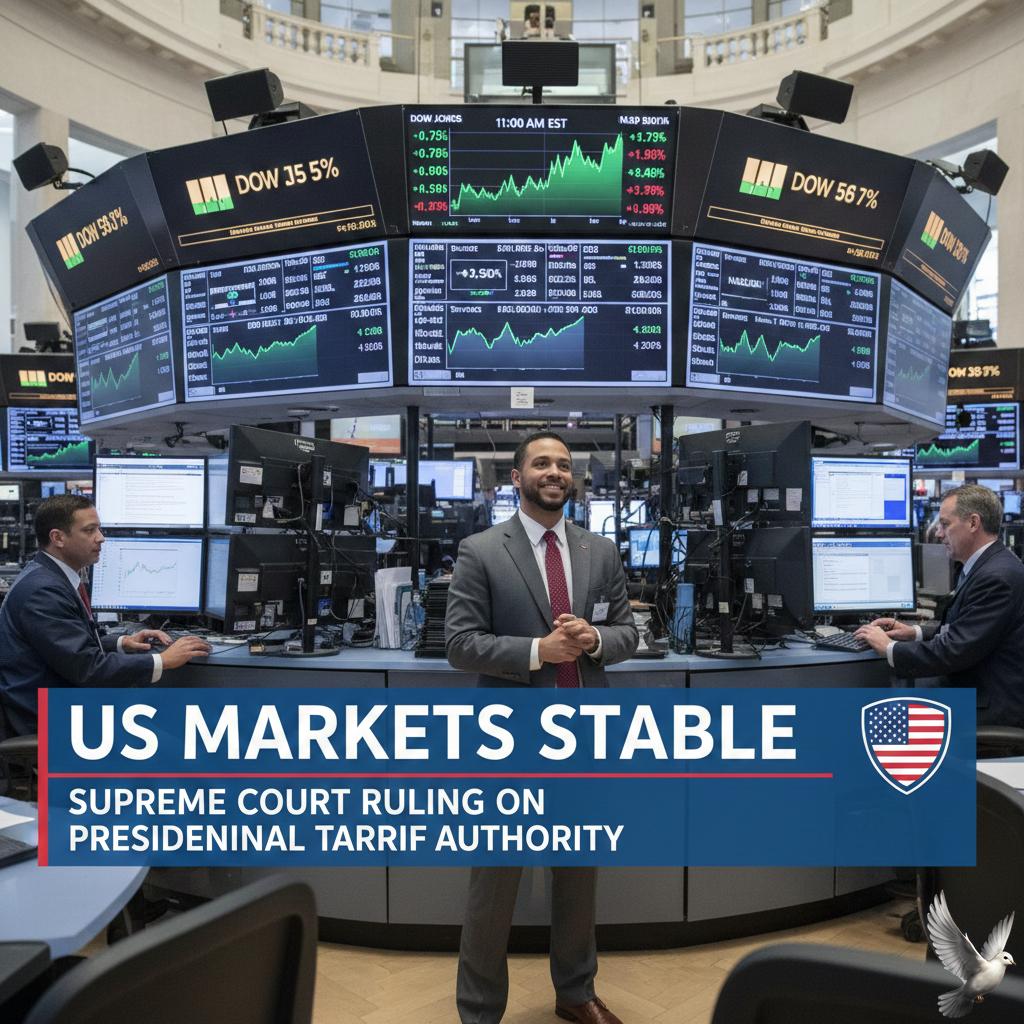
US Markets Stable Following Supreme Court Ruling on Presidential Tariff Authority
Market Brief: Global Trade Policy Shifts **February 23, 2026** The global trade landscape has entered a period of intense volatility following a landmark **6-3 Supreme Court ruling** on February 20. The Court struck down broad "reciprocal" tariffs previously imposed under the International Emergency Economic Powers Act (IEEPA), ruling the executive branch exceeded its authority. The decision has immediate fiscal implications, with an estimated **$175 billion to $284 billion** in collected duties now potentially subject to corporate refunds. Major US refiners and retailers are already initiating litigation to recover these payments. Immediate Policy Response In a direct pivot to bypass the judicial setback, a new **15% global baseline tariff** has been announced. This measure utilizes **Section 122 of the Trade Act of 1974**, a different legal framework designed to address balance-of-payment deficits. This new levy is currently set for a **150-day window**. Extension beyond this period will require congressional approval, setting the stage for a significant legislative battle by late summer 2026. Market and Sector Reactions Financial markets reacted with a "Sell America" narrative over the weekend. The **US Dollar Index shed 0.2%**, while **S&P 500 and Nasdaq 100 futures dropped by 0.7% and 0.9%** respectively during Monday’s Asia session. Gold prices have surged, testing resistance at **$5,170 per ounce** as investors seek safety. In the logistics sector, the **Drewry World Container Index** showed a slight decline to **$1,919 per 40-foot container**, reflecting a "shippers' market" characterized by soft demand and excess capacity despite the policy turbulence. Regional Impact: China and South Korea South Korean exports demonstrated resilience despite the uncertainty. Data for the first 20 days of February shows outbound shipments jumped **23.5% to $43.52 billion**. This growth was propelled by a **134% surge in semiconductor exports**, totaling **$15.12 billion**. While South Korea maintains a trade surplus of **$4.95 billion**, the automotive sector remains a weak point, with shipments dipping **26.6%** amid the tariff shifts. Exports to China notably rose nearly **31%**, while shipments to the US increased **22%** in the same period. Stability of Existing Deals US trade officials have moved to reassure partners that the approximately **20 bilateral framework deals** struck over the last year remain in force. This includes specific agreements with the UK, EU, and India. The EU has expressed concern that the new **15% levy** might be layered on top of existing negotiated rates, though US representatives insist these deals are separate from the global baseline. Strategic carve-outs for industries like UK pharmaceuticals and Indian energy remain critical components of current trade stability.
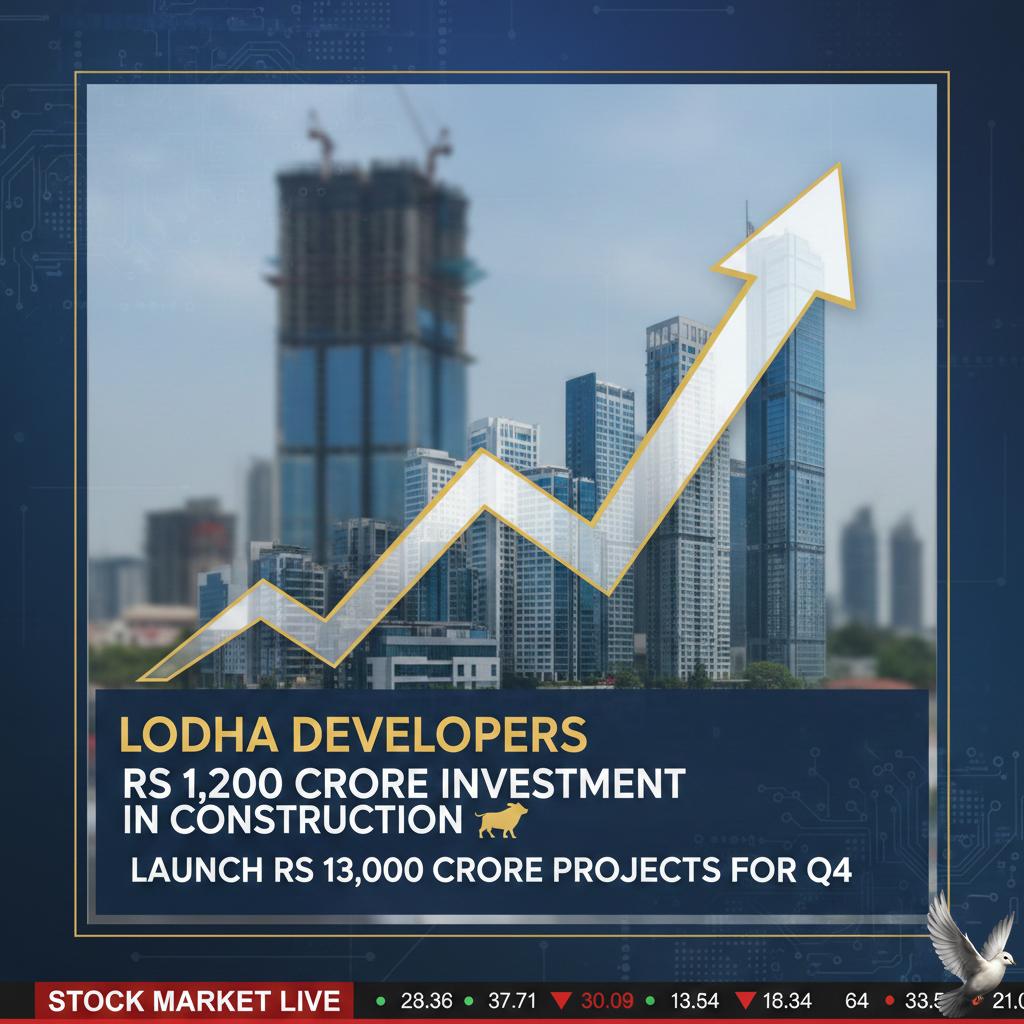
Lodha Developers to Invest Rs 1,200 Crore in Construction and Launch Rs 13,000 Crore in Projects for Q4
Macrotech Developers, operating under the Lodha brand, has accelerated its expansion strategy with a significant capital commitment of 1,200 crore INR for construction activities this quarter. This investment supports a robust pipeline of 12 new housing projects with an estimated sales value of nearly 13,000 crore INR. The company is currently tracking toward an ambitious pre-sales guidance of 21,000 crore INR for the 2026 fiscal year. This momentum is evidenced by record-breaking performance in recent quarters, including a 25% year-over-year growth in sales bookings. Current market data shows the firm is successfully diversifying its footprint beyond its stronghold in the Mumbai Metropolitan Region. Operations have significantly expanded in Pune, where sales grew from 200 crore INR in 2021 to 1,800 crore INR in the latest annual cycle. Additionally, the developer has established a successful presence in Bengaluru, securing 1,200 crore INR in pre-sales during its inaugural year in that market. A pilot entry into the Gurugram and Delhi-NCR luxury markets is also underway to capture growing demand in Northern India. Financial health remains a focal point, with net debt reduced to approximately 3,990 crore INR. The company maintains a conservative leverage profile with a debt-to-equity ratio of 0.2x, well below its self-imposed ceiling of 0.5x. Profitability remains strong, with embedded EBITDA margins holding steady at approximately 33%. As of February 23, 2026, the company’s stock is trading at 1,071.15 INR on the National Stock Exchange, reflecting a market capitalization of approximately 1.07 lakh crore INR. Investor confidence is bolstered by a 13.69% return on equity and a consistent 20% annual growth target for pre-sales over the medium term. The broader Mumbai real estate market continues to show resilience, particularly in the luxury segment. While overall volumes in the region have remained stable, average selling prices in key micro-markets like Thane have seen double-digit growth. Lodha’s strategy focuses on these high-demand zones, utilizing a 600 million square foot development potential to sustain long-term revenue. The company is also diversifying into digital infrastructure and annuity-based assets. This includes a massive 400-acre data center park in Palava and premium retail spaces. These initiatives are projected to generate annual rental potential of 560 crore INR by 2031, providing a balanced mix of sales-led and recurring income streams.

Twelve Stocks Decline as Foreign Institutional Investors Reduce Holdings
Foreign Institutional Investors (FIIs) have significantly altered their positioning within the BSE 500 index over the last two quarters. Data as of late February 2026 confirms a sustained trend of stake reductions in 12 specific stocks, contributing to sharp price corrections and a shift in market sentiment. While the broader BSE 500 currently trades at a P/E ratio of 24.57, these underperforming counters have faced intensified selling pressure. Cohance Lifesciences has emerged as the most impacted, with its share price plunging approximately 75% from its 52-week high of 1,328 INR. Currently trading near 305 INR, the company has grappled with a 76% decline in net profit and a warning letter from the USFDA for its Hyderabad unit. FII holding in the firm has dropped as investors react to these regulatory and operational hurdles. Blue Jet Healthcare and Vedant Fashions (Manyavar) have similarly experienced price drops exceeding 50%. Blue Jet Healthcare, recently downgraded by major global brokerages, saw its stock slide to a 52-week low of 353 INR. Despite a robust ROCE of 39.8%, the stock has struggled with high volatility as foreign investors reduced their exposure to 1.14%. Vedant Fashions is currently trading at 424 INR, down over 50% from its yearly peak of 880 INR. The premium apparel retailer has seen its one-year return sink to -48.84% compared to a double-digit gain in the Nifty 50. High debtor days and a slowdown in sales growth have prompted institutional caution, with FIIs paring stakes amidst a wider sectoral rotation. Broader market activity in February 2026 shows FIIs as net sellers in the cash market, with outflows totaling roughly 1,374 crore INR by mid-month. This follows a heavy exit of over 41,000 crore INR in January. Domestic Institutional Investors (DIIs) have acted as a buffer, injecting 9,775 crore INR into the market this month to stabilize indices like the Sensex, which currently fluctuates around the 82,800 level. The exit from mid-cap and small-cap BSE 500 stocks is driven by a combination of high valuation premiums, global interest rate dynamics, and specific corporate earnings misses. While the structural growth narrative for India remains intact, the heavy institutional selling in these 12 stocks serves as a cautionary signal for retail participants regarding valuation sustainability in the current macro environment.

**Market Outlook: Gold Potential and Technical Indicators from LKP Securities**
Domestic gold prices have surged to a notable level of 1,60,600 INR per 10 grams as of February 23, 2026. This rally is primarily driven by intensifying global trade uncertainties and geopolitical friction. A key trigger for this upward movement is the recent announcement of a new 10% to 15% global tariff on imports following a US Supreme Court ruling on trade powers. On the Multi Commodity Exchange (MCX), gold futures for April delivery have climbed by approximately 3,010 INR, or 1.92%, reaching a trading range near 1,59,886 INR. In the international market, spot gold has reclaimed the psychologically significant 5,000 USD per ounce threshold, currently trading around 5,163 USD. This shift reflects a flight to safety as investors hedge against potential US military developments in the Middle East and stalled nuclear negotiations with Iran. LKP Securities has identified a potential upside of up to 3,400 INR for the current week. Technical indicators supporting this bullish outlook include a stabilizing MACD and the RSI holding firm. Analysts highlight that the metal is currently following a pattern of higher highs and higher lows, reinforcing a strong medium-term uptrend. Market experts recommend a buy-on-dips strategy within the 1,58,500 INR to 1,59,000 INR zone. Immediate support is established at 1,57,000 INR, while the next major resistance level is pegged at 1,60,800 INR. A decisive break above this resistance could pave the way for a move toward 1,65,000 INR in the near term. City-wise rates across India show 24K gold trading at approximately 1,59,420 INR per 10 grams in Delhi and Mumbai. Chennai continues to trade at a slight premium, with rates hovering around 1,60,720 INR. Despite a 25% retreat from January's lifetime highs of 1,81,000 INR, the current consolidation phase is viewed by bullion traders as a healthy base-building period. The broader market remains sensitive to upcoming US economic data, including the Producer Price Index and consumer confidence reports. Central bank demand also remains a core pillar of support, with emerging economies continuing to diversify reserves away from the US dollar. This structural demand, combined with tariff-related volatility, is expected to maintain upward pressure on precious metal prices throughout the quarter.

Silver Prices Increase 18% Since 2026 Low with Four Primary Drivers for Continued Growth
Silver is staging a significant recovery as February 2026 comes to a close. After a period of extreme volatility that saw prices plunge to a monthly low of **₹2,55,000** per kg on February 18, the metal has rebounded sharply. As of February 23, 2026, silver is trading near **₹2,75,000** to **₹3,00,000** per kg in major physical markets. The primary catalyst for this resurgence is the escalation of geopolitical tensions between the United States and Iran. A **10-day deadline** set by the U.S. for a deal with Iran, combined with new military deployments in the Middle East, has reintroduced a substantial risk premium. Investors are rotating back into silver as a defensive safe-haven asset to hedge against potential conflict. Trade policy shifts are further fueling the rally. Recent U.S. Supreme Court rulings striking down broad tariffs were followed by the administration’s executive orders imposing a new **15% global tariff**. This move has weakened the U.S. Dollar, which fell toward the **97.8** level, making dollar-denominated silver more attractive to international buyers. Industrial fundamentals remain a critical support pillar. Silver is currently facing its sixth consecutive year of a structural supply deficit, with the 2026 deficit projected to hit **135 million ounces**. Demand is being driven by the green energy transition, particularly solar photovoltaics and electric vehicle infrastructure, which are less sensitive to short-term price swings. Market liquidity is also shifting. The conclusion of the Lunar New Year holiday in China is expected to bring speculative capital back to the Shanghai Gold Exchange. Analysts note that silver ETFs recently saw surges of up to **17%** in a single session, signaling a move from "paper" liquidation back toward physical accumulation. Technical indicators suggest silver is establishing a firm floor. While the metal remains nearly **33%** below its January all-time high of **₹4,10,000** per kg, the successful defense of the **₹2,50,000** support zone has turned sentiment cautiously bullish. Major financial institutions now project an average price target of **$81** per ounce for the remainder of the year. The current market landscape is defined by a "risk-off" mood. With U.S. GDP growth slowing to **1.4%** in the recent quarter, silver is increasingly viewed not just as an industrial commodity, but as a vital monetary hedge against both inflation and geopolitical instability.
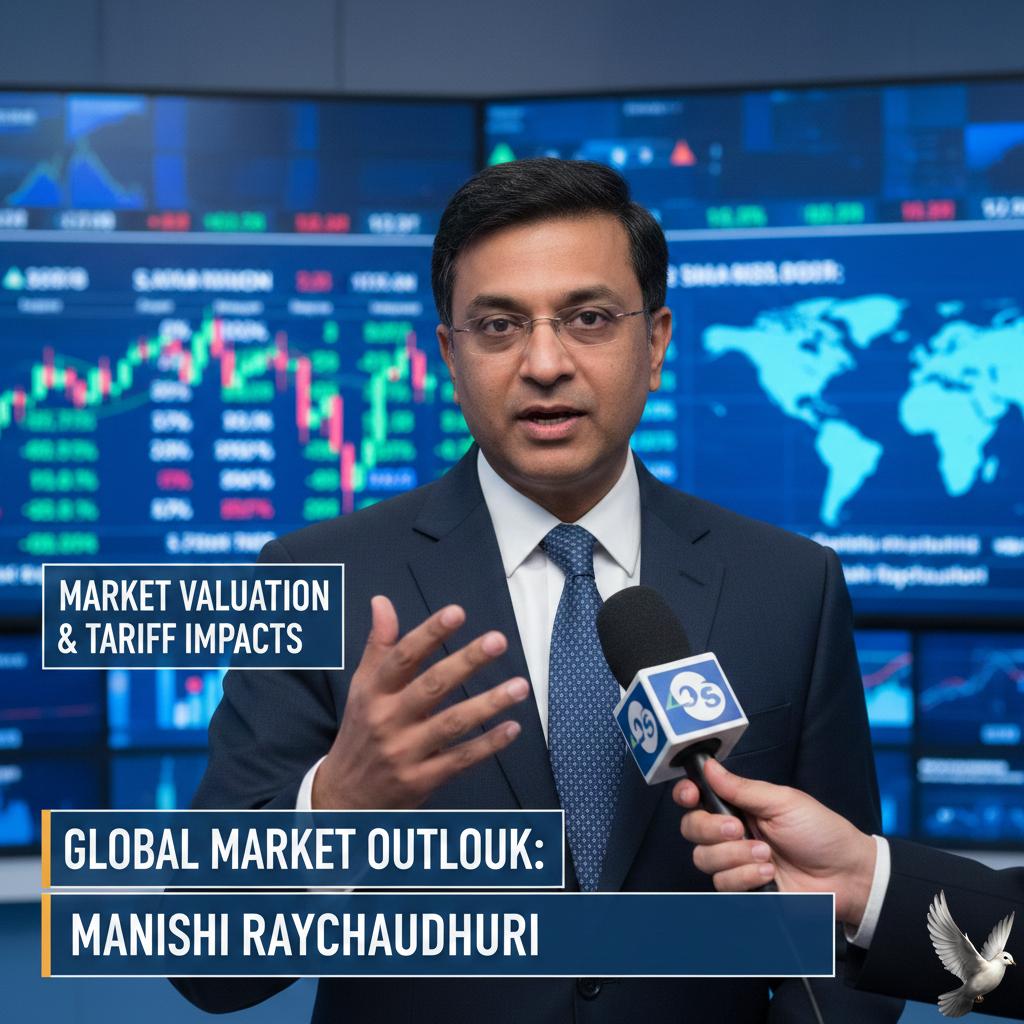
**Manishi Raychaudhuri on market valuation and tariff impacts**
Global trade policy is undergoing a period of intense volatility in early 2026. Trade growth is projected to slow to **0.6%** this year, down significantly from **2.0%** in 2025. This deceleration is largely driven by rising effective US import tariffs, which are expected to peak at approximately **14%** by year-end. In this environment, market strategist Manishi Raychaudhuri advocates for a strategic pivot toward domestic growth. He maintains a target of **91,000** for the Sensex by the end of 2026, representing a potential upside of **7.0% to 8.0%**. The focus remains on selective stock picking rather than broad market momentum. Preferred Growth Sectors Investors are increasingly favoring sectors tied to local demand and infrastructure. Industrial activity in major emerging markets like India is gaining pace, with the sector projected to grow by **6.2%** in FY26. **Basic Materials & Industrials** Infrastructure, capital goods, and defense remain top picks. Manufacturing activity in technology-linked segments has shown remarkable resilience, with computer and electronic products expanding by **34.9%**. **Consumer Discretionary** The outlook is positive for market-leading automobile companies and niche segments. Growth in motor vehicles and trailers reached **33.5%** recently, supported by strengthening rural incomes and urban demand. **Healthcare & Financials** Healthcare services, specifically hospital and diagnostic chains, are viewed as defensive growth plays. Private banks are also highlighted for potential recovery following a three-year period of underperformance. Sectors Facing Pressure Caution is advised for sectors heavily exposed to global trade barriers and technological disruption. Roughly **77%** of imported goods are now seeing tariff costs absorbed by exporters, directly squeezing profit margins. **IT Services** The sector faces structural challenges from artificial intelligence. The adoption of large language models for coding is viewed as a threat to traditional service models. Short-term sentiment remains bearish as the industry navigates this transition. **Exporters & Consumer Staples** Export-oriented companies are grappling with a more restrictive trade landscape. Consumer staples are also under watch due to potential margin compression. Higher tariff costs on raw materials are increasingly difficult to pass on to consumers without impacting demand. Global GDP growth is forecasted to reach **2.5%** in 2026, a slight dip from the previous year. With corporate insolvencies predicted to rise by **5.0%** globally, the shift toward domestic-facing assets serves as a hedge against heightening international risks.

Gurugram Outpaces Mumbai in 2025 Ultra-Luxury Real Estate Sales
Gurugram Luxury Housing Market Brief Gurugram has solidified its position as India’s premier luxury residential hub in 2025, officially outpacing Mumbai in the ultra-premium segment. The city recorded a historic **Rs 24,120 crore** in transactions for homes priced at **Rs 10 crore and above**. This represents a staggering six-fold increase in sales value compared to the **Rs 4,004 crore** registered in 2023. A total of **1,494 ultra-luxury units** were sold during the year, the highest volume ever recorded in a single 12-month period for the city. This surge highlights a dramatic shift in market leadership, with the ultra-luxury category now accounting for **24 percent** of Gurugram’s total residential market value. Key Market Indicators The average ticket size for homes in this elite segment reached approximately **Rs 16 crore**. Buyers showed a distinct preference for scale, with the average home size standing at **5,000 square feet**. Properties exceeding **8,000 square feet** alone contributed nearly **22 percent** of the total transaction value, signaling a move toward sprawling, customized estates. Price appreciation remains aggressive in 2026. Premium corridors like the Golf Course Extension Road are witnessing annual growth rates between **15 percent and 18 percent**. Even in the broader luxury and upper mid-segment, experts forecast a steady appreciation of **8 percent to 12 percent** throughout the current year. Infrastructure and Emerging Zones Growth is increasingly decentralized, moving away from traditional premium addresses toward massive infrastructure-led corridors. The full operationalization of the **Dwarka Expressway** and the **Delhi-Mumbai Expressway** connectivity has transformed accessibility, making peripheral sectors prime targets for high-net-worth individuals (HNWIs). * **Golf Course Extension:** Prices in prime pockets have hit **Rs 18,000 per square foot**, with some high-end projects projected to reach **Rs 50,000 per square foot** by 2028. * **New Growth Spine:** Sectors **104, 113, and 54** are outperforming the broader market due to their proximity to corporate hubs and new transit links. * **Inventory Trends:** Over **28 luxury projects** were launched in early 2025 to meet demand, with many selling out immediately upon release. Buyer Profiles and Capital Flow The market is increasingly dominated by end-users and long-term investors rather than short-term speculators. Strong capital inflows from **NRIs** and high-income professionals in the tech and finance sectors are providing a resilient floor for pricing. Current trends indicate that livability, green spaces, and community-focused designs are now as critical to valuation as location. While supply has increased, the scarcity of land in established sectors ensures that the seller-favored market conditions are likely to persist through 2026.

Clean Max Enviro Energy IPO: Subscription Status, GMP, and Brokerage Analysis
CleanMax Enviro Energy Solutions launched its Rs 3,100 crore Initial Public Offering (IPO) today, February 23, 2026. The issue has seen a measured start, with an overall subscription of approximately 10% reported during the initial hours of Day 1. The price band for the offering is fixed between Rs 1,000 and Rs 1,053 per share. This public issue is a combination of a fresh issue worth Rs 1,200 crore and an offer for sale (OFS) of Rs 1,900 crore by existing promoters and investors, including Brookfield-backed entities. Market sentiment remains cautious regarding short-term gains. The Grey Market Premium (GMP) is currently hovering around Rs 3 to Rs 4, indicating a marginal listing upside of just 0.3%. Analysts suggest that the valuation is aggressive, with an Enterprise Value to EBITDA (EV/EBITDA) multiple of approximately 16x. CleanMax is currently India’s largest provider of renewable energy to the commercial and industrial (C&I) segment. As of late 2025, the company operates 2.80 GW of capacity with an additional 3.17 GW under execution. This scale is a key highlight for long-term investors, as the C&I renewable sector is projected to grow at a CAGR of 22-24% through 2030. The company's financial profile shows a significant turnaround. Revenue rose to Rs 1,610 crore in FY25, and the firm moved from a loss in previous years to a net profit of Rs 19.43 crore. However, high leverage remains a primary concern, with total borrowings reaching Rs 10,121 crore by September 2025. A substantial portion of the fresh issue proceeds, roughly Rs 1,123 crore, is earmarked for debt repayment. This move is expected to strengthen the balance sheet and improve interest coverage, which currently consumes nearly 43% of total income. While the listing gain prospects appear muted, the structural demand for green energy from data centers and AI-linked industries provides a strong visibility for future growth. The bidding window remains open until February 25, with the shares expected to debut on the BSE and NSE on March 2, 2026. Institutional interest was notably strong prior to the public launch. The company successfully raised Rs 921 crore from 41 anchor investors, including high-profile names such as Temasek, Nomura, and the Abu Dhabi Investment Authority. This institutional backing underscores confidence in the company’s long-term utility-scale and rooftop solar strategies.

Sameer Dalal: Buying Opportunity Amid Tariff Uncertainty, Iran Tensions, and IT Stock Volatility
Indian equity markets are navigating a period of sharp global transitions. The Nifty 50 currently holds a position near **25,571**, while the Sensex has stabilized around **82,814**. Despite external pressures, domestic benchmarks have recently recorded a three-day winning streak, signaling underlying resilience. Market participants are closely tracking the impact of a revised **15%** global tariff announced by the U.S. administration. While this has deferred some bilateral trade discussions, the immediate effect on Indian exports is being partially cushioned by a new trade agreement that brought reciprocal rates down from previous highs. Oil price volatility remains a critical variable. Brent crude is trading in the range of **$70.81** to **$71.28** per barrel. While these levels are currently manageable, any geopolitical escalation in the Middle East that pushes prices higher poses a direct risk to India’s inflation targets and trade deficit. Foreign Institutional Investors (FIIs) continue to exert pressure on the cash segment, with net sales totaling approximately **₹1,374 crore** so far in February. This follows a heavy exit of over **₹41,000 crore** in January. However, Domestic Institutional Investors (DIIs) have acted as a significant buffer, absorbing the selling with substantial inflows. The valuation correction in the IT sector is reaching a mature stage. The Nifty IT index recently faced an **8.2%** weekly decline, but analysts suggest the downside is now limited. IT spending in India is actually projected to grow by **10.6%** in 2026, reaching an estimated **$176.3 billion**. Mid-sized private banks remain a focal point for growth. Despite a recent **₹590-crore** fraud incident involving a prominent mid-sized lender, the regulator has indicated no systemic risk. The sector continues to see interest as the RBI proposes raising collateral-free MSME loan limits to **₹20 lakh**, potentially boosting credit books. Currency markets show the Indian Rupee trading near **90.73** against the US Dollar. Record foreign exchange reserves of **$725.7 billion** provide a robust safety net against further depreciation. Investors are increasingly adopting a "buy on dips" strategy. The current market P/E ratio stands at approximately **22.4** for the Nifty 50, which is considered a fair valuation for long-term entry, especially as corporate earnings growth for the next fiscal year remains promising.
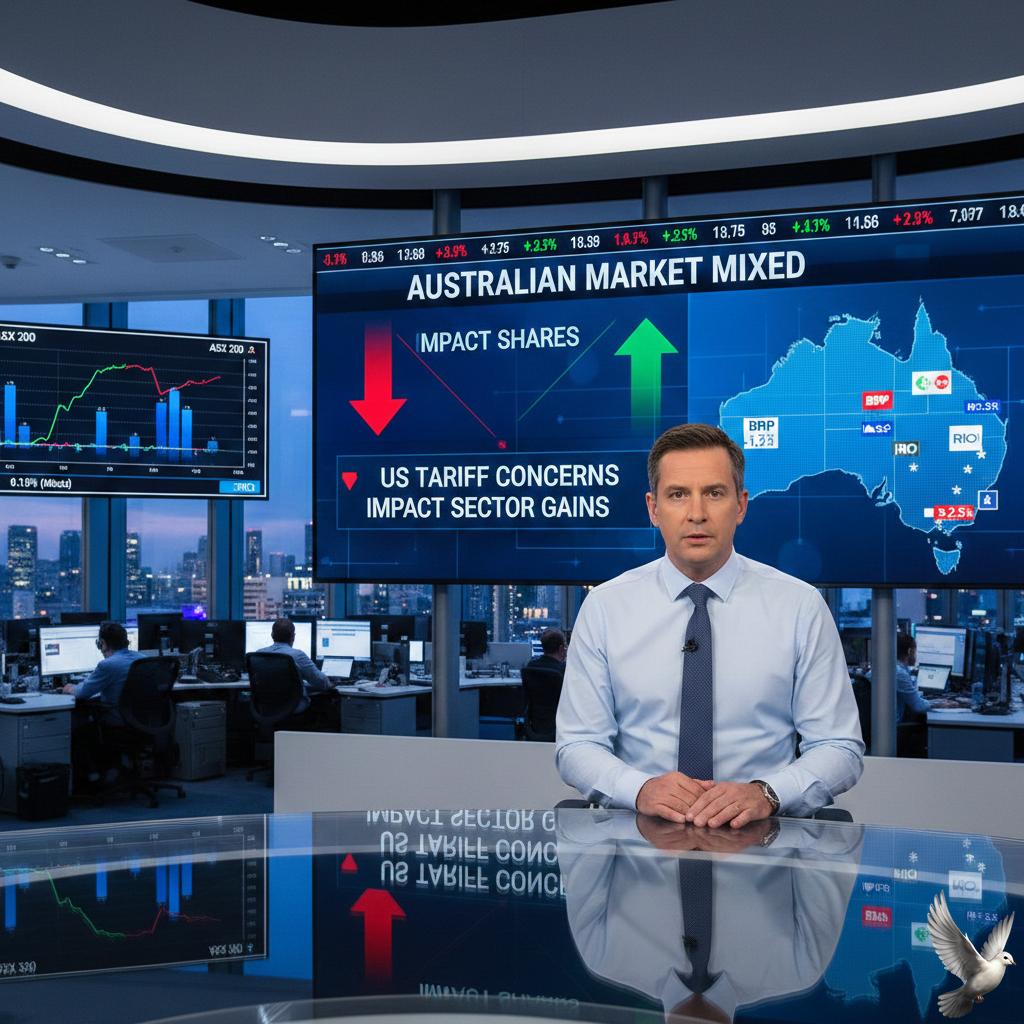
Australian Market Mixed as US Tariff Concerns Impact Shares Amid Mining Gains
The Australian sharemarket faced significant downward pressure today, with the S&P/ASX 200 Index sliding 47.80 points, or 0.5%, to close at 9033.60. Investor sentiment was rattled by renewed uncertainty surrounding U.S. trade policies, following a complex legal battle involving the scope of presidential tariff powers. While eight out of eleven sectors recorded losses, the materials sector emerged as a notable exception. Mining heavyweights acted as a defensive shield for the broader market, driven by a surge in gold prices. Spot gold climbed 1.3% to reach $5,172.21 per ounce, fueling a sharp rally in precious metal producers. Ramelius Resources led the gains with a 7% surge, while Evolution Mining and Newmont added 2.6% and 4.3%, respectively. BHP also hit a milestone, touching a new record high of $54.75 during the session. In contrast, the technology sector bore the brunt of the sell-off. Concerns over global logistics and artificial intelligence valuations saw WiseTech Global drop 5.7%, while data center operator NextDC fell 5%. The financial sector provided little support as three of the "Big Four" banks traded lower; ANZ paced the decline with a 1.9% drop. The ongoing February reporting season remains a critical stabilizer. Despite the daily volatility, corporate fundamentals appear resilient. BHP’s half-year results featured an 11% revenue jump to $27.9 billion and a 46% dividend hike to $0.73 per share. Similarly, ANZ reported a 17% jump in quarterly cash profit to $1.94 billion. Economic indicators show Australia navigating a delicate "soft landing." The RBA currently projects GDP growth to settle around 2.1% for 2026, though headline inflation remains a persistent challenge at 3.6%. While the unemployment rate has edged up slightly to 4.3%, the labor market remains relatively tight by historical standards. Market analysts view the current pullback as a tactical buying opportunity rather than a structural shift. With the index sitting just below its October record of 9115.2, strong earnings and the haven appeal of the resource sector are expected to underpin a recovery toward previous highs as trade policy clarity returns.

Global Investment Outlook: Tariffs, Trade Realignment, and Market Strategies
Tariffs have officially shifted from temporary trade measures to permanent strategic pillars in global economic policy. Following a landmark February 20, 2026, Supreme Court ruling that limited specific presidential authorities, the U.S. administration immediately pivoted to Section 122 of the Trade Act. Effective February 24, 2026, a new 10% global import surcharge has been imposed on most goods. This move aims to address a persistent $1.2 trillion goods trade deficit and a current account deficit sitting at 4% of GDP. The global trade landscape is reacting to an average effective tariff rate that has climbed to 9.1%—the highest level since 1946. While certain essentials like critical minerals, pharmaceuticals, and energy products remain exempt, the manufacturing sector faces significant pressure. U.S. manufacturing output is projected to expand by 1.2%, yet this growth is balanced against a cooling services sector and rising input costs for businesses. India is navigating this volatility through a proactive "China+1+1" strategy. This model encourages diversifying supply chains not just into India, but also through third-party hubs like Vietnam or Malaysia to mitigate tariff risks. Despite global headwinds, India’s exports grew by 5.5% in the latter half of 2025, reaching over $560 billion. To maintain this momentum, the government has allocated ₹25,060 crore toward an Export Promotion Mission, focusing on MSME resilience and advanced logistics. By mid-2026, supply chain realignment will be largely defined by regionalization. The logistics sector is seeing a massive shift, with India and the EU recently finalizing a trade deal to remove duties on 90% of goods. Simultaneously, logistics costs in India have stabilized at 7.97% of GDP, providing a cushion against international price spikes. Global businesses are now prioritizing vertical integration and "near-shoring" to bypass the high-tariff walls of traditional trade corridors. Investment strategies for 2026 are increasingly centered on technology and diversified sourcing. AI-related trade now accounts for nearly 20% of global value growth, driven by a semiconductor market nearing $1 trillion. Companies are hedging against tariff-driven inflation by moving away from high-concentration sourcing. For North American buyers, the reliance on the top three traditional supplier nations has already dropped from 61% to 54%, signaling a permanent shift toward a multi-polar trade world.
Bharat Dynamics Shares Decline 3% Amid Broad Weakness in Defense PSUs
Bharat Dynamics Market Update Bharat Dynamics Limited (BDL) shares are currently trading under significant pressure, recently falling approximately **2.98%** to reach **₹1,271.40**. This decline is part of a broader correction within the defense Public Sector Undertaking (PSU) space following the Union Budget 2026. While the budget increased defense capital expenditure by roughly **21%** to **₹2.19 lakh crore**, the figures failed to meet the aggressive "big bang" expectations previously priced into the sector. The stock has witnessed a sharp reversal from its **52-week high** of **₹2,096.60**, now trading nearly **39%** below that peak. Technical indicators signal a bearish trend as the price remains stuck below key long-term hurdles, specifically the **200-day Moving Average** of **₹1,589.98** and the **50-day Moving Average** of **₹1,411.84**. Although short-term support is emerging near the **₹1,265** level, the overall momentum remains cautious. Financial Performance and Valuation Recent quarterly earnings have added to the sober sentiment. For the third quarter of fiscal year 2026, BDL reported a significant drop in profitability. Net profit stood at **₹72.92 crore**, a sharp decline compared to the **₹147.13 crore** recorded in the same period last year. Earnings Per Share (EPS) for the quarter fell to **₹1.99**, down from **₹4.01** year-on-year. Despite the recent price drop, BDL’s valuation remains a point of discussion among analysts. The stock currently trades at a trailing Price-to-Earnings (P/E) ratio of approximately **80.3**, which is higher than the broader sector average of **74.3**. This premium suggests that while the stock has corrected, it is still priced for high future growth, leaving little room for further operational delays or earnings misses. Sector Trends and Outlook The defense sector is undergoing a necessary valuation reset. After a massive multi-year rally, investors are shifting focus from momentum to execution. High-beta stocks like Mazagon Dock and Garden Reach have also faced double-digit corrections this month. However, the structural narrative for BDL remains supported by a strong order book and the government’s continued push for "Atmanirbhar Bharat." Export potential serves as a long-term catalyst, with India targeting **₹50,000 crore** in defense exports by FY29. BDL, as the primary manufacturer of guided missile systems like the Akash and Astra, is central to this strategy. While institutional holdings by FIIs slightly decreased to **2.30%** in the recent quarter, the company maintains a debt-free balance sheet and a steady dividend yield of **0.40%**, providing a fundamental floor for long-term investors. Short-term volatility is expected to persist as the market absorbs the recent earnings data and adjusts to the new fiscal allocations. Immediate resistance is pegged at **₹1,324**, while a sustained break below **₹1,250** could lead to further technical weakness.

Rupee gains 21 paise to 90.73 against US dollar in early trade
The Indian rupee experienced a notable surge on Monday, gaining **21 paise** to reach **90.73** against the US dollar. This recovery follows a volatile period where the local unit had previously settled at **90.94**. Market sentiment was primarily buoyed by a significant shift in global trade policy. The US Supreme Court issued a landmark ruling striking down several broad-based tariffs, labeling them a "transformative expansion" of presidential authority. While the US administration quickly countered by announcing a temporary **10% to 15%** global import surcharge, the overall dollar index fell **0.33%** to **97.47**, easing pressure on emerging market currencies. Energy costs provided additional relief for the Indian economy. Brent crude, the global oil benchmark, dropped **1.09%** to trade at **$70.98** per barrel. This decline is critical for India, as lower oil prices directly reduce the national import bill and help stabilize domestic inflation. Domestic financial indicators also showed robust strength: * India's foreign exchange reserves hit a fresh all-time high of **$725.727 billion** for the week ended February 13, according to the latest RBI data. * Equity markets opened with strong momentum, with the Sensex surging **621.78 points** to **83,436.49** and the Nifty 50 climbing **180.05 points** to **25,751.30**. The influx of capital into domestic equities and the record-high forex cushion have provided the Reserve Bank of India with significant firepower to manage further currency volatility. Despite the rupee's gain, traders remain watchful as global trade uncertainties persist following the new US executive orders on surcharges. The interbank foreign exchange market saw the rupee open at **90.76** before strengthening further, reflecting improved risk appetite among international investors and a temporary retreat in the greenback’s dominance.

Textile Stocks Fluctuate Following US Supreme Court Tariff Ruling
Market Brief: Indian Textile Sector The Indian textile sector experienced a dynamic trading session on Monday, February 23, 2026, as markets reacted to a historic legal shift in U.S. trade policy. A landmark ruling by the U.S. Supreme Court invalidated previous sweeping tariffs, initially sparking optimism before a new administrative levy introduced fresh complexity. Stock Performance and Market Reaction Indian equity markets advanced on the news, with specific textile players leading the charge. **Kitex Garments** surged by **10.4%**, while **Trident** and **Welspun Living** climbed **7.5%** and **4.2%** respectively. The rally reflects a perceived easing of the extreme tariff pressures that had previously seen duties on Indian goods fluctuate between **26%** and **50%**. However, the gains were not uniform across the board. **Gokaldas Exports** saw a dip of **4%**, and **Indo Count** slipped **1.3%** in early trade as investors weighed the long-term impact of the new global trade framework. The broader textiles sector market cap currently stands at approximately **₹1,66,969.77 crore**, reflecting a daily increase of **1.91%**. The U.S. Tariff Reset The U.S. Supreme Court ruled **6–3** that the use of the International Emergency Economic Powers Act (IEEPA) to impose global tariffs was unauthorized. This decision effectively struck down the "Liberation Day" tariffs that had heavily burdened Indian exporters throughout 2025. In immediate response, the U.S. administration invoked **Section 122** of the Trade Act of 1974. This move established a new **15%** global tariff, revised upward from an initial **10%** announcement. For Indian textile firms, this represents a significant reduction from the previous **18%** effective rate, though it removes the specific competitive advantage India held over rivals like Bangladesh and Vietnam. Strategic Trade Rescheduling The Indian government is currently evaluating the implications of the **150-day** temporary import surcharge. In light of these legal developments, a high-stakes meeting between Indian and U.S. chief negotiators, originally set for February 23 in Washington, has been rescheduled. Both nations seek to reassess the text of a proposed interim trade pact. Analysts suggest the new **15%** baseline provides a fresh floor for negotiations, as India aims to secure its target of reaching **$100 billion** in textile exports by 2030. Outlook for Exporters The shift to a uniform global tariff is expected to alleviate margin pressures for small and mid-cap engineering and textile firms. While the uniform rate places all competing nations on equal footing, the reduction from higher 2025 levels is viewed as a net positive for Indian order books. The domestic industry remains a pillar of the economy, contributing **2%** to India's GDP and providing livelihoods for over **45 million** people. Investors are now focused on the mid-March window, when the final text of the India-US bilateral agreement is expected to provide definitive clarity on duty-free access and long-term trade stability.

**Indian Markets and Broader Indices Rally Following Signs of Recovery**
Market Pulse: Indian Equities Indian equity markets have entered a decisive recovery phase as of February 23, 2026. The benchmark **Nifty 50** has reclaimed the **25,700** level, while the **BSE Sensex** continues to trade firmly above **82,800**. This upward momentum follows a complex 18-month cycle, signaling a shift from a defensive stance to selective accumulation. Market breadth has notably improved, with over **2,200** advancing stocks against roughly **1,900** declining on the BSE. Volatility remains under control as the India VIX cools, reflecting growing investor confidence in the current price action. PSU Banking Dominance The Public Sector Undertaking (PSU) banking sector has emerged as the primary engine for the current rally. The **Nifty PSU Bank Index** recently touched **9,665**, driven by historic earnings growth. Combined net profits for state-owned lenders reached **₹52,603 crore** in the December quarter (Q3 FY26), an **18%** year-on-year increase. **State Bank of India (SBI)** reported a record net profit of **₹21,028 crore**, contributing roughly **40%** of the total sector earnings. Asset quality is at a multi-year high, with gross NPAs falling to a record low of **2.30%**. With credit growth holding at **12%**, these institutions serve as a robust proxy for the broader domestic economy. Corporate Earnings and Growth India Inc. continues to show resilience, with corporate earnings expected to grow at an accelerated pace of **8.8%** to **13%** for the fiscal year. This performance is backed by a stable GDP growth projection of **7.2%** for the quarter, maintaining India’s position as a top-performing major economy. Quality stocks are witnessing a "buy-on-dips" sentiment. While the IT sector has faced headwinds due to global spending caution—dropping roughly **1.2%** in recent sessions—sectors like Metals, FMCG, and Infrastructure have picked up the slack. **Larsen & Toubro** and **Tata Steel** have recently hit or approached 52-week highs, emphasizing the strength in capital goods and industrial segments. Institutional Resilience A structural shift in market dynamics is now evident. While Foreign Institutional Investors (FIIs) have been selective, withdrawing approximately **₹25,000 crore** in early 2026, Domestic Institutional Investors (DIIs) have more than compensated with inflows exceeding **₹40,000 crore**. Robust retail participation through SIPs, which now exceed **₹15,000 crore** monthly, provides a massive liquidity cushion. This domestic conviction reduces the market's historical dependence on foreign capital and stabilizes valuations during global geopolitical uncertainty. Strategic Outlook The technical structure remains constructive. Immediate support for the Nifty is established at the **25,000–25,300** zone, while a sustained break above **25,800** could pave the way for a move toward **26,300**. The risk-reward balance is increasingly favorable for long-term investors. High-quality counters with clean balance sheets and strong dividend yields are the preferred targets for current capital allocation. Focus remains on sectors benefiting from government infrastructure spending and stable domestic consumption.
UPL Shares Decline 10% Following Restructuring Announcement and Nuvama Downgrade
UPL Strategic Reorganization and Market Impact UPL shares experienced a sharp **10.26%** decline during intraday trading on **February 23, 2026**, hitting a lower circuit limit of **676.60**. The sell-off followed the announcement of a massive three-step corporate restructuring plan. The reorganization aims to consolidate Indian and international crop protection operations into a single, unified entity called **UPL Global**. This new platform is projected to become the world’s second-largest listed pure-play crop protection company, with operations spanning over **140 countries**. Restructuring Mechanics The plan involves the amalgamation of UPL Sustainable Agri Solutions into the parent company, followed by a vertical demerger of the India-based business into **UPL Global**. Simultaneously, the international arm, UPL Corp, will be merged into this new entity. Following the transition, the original listed UPL entity will evolve into a diversified platform focused on specialty chemicals and next-generation agricultural ventures. Financial Performance and Debt Despite the share price volatility, UPL reported a **12%** year-on-year revenue growth in the quarter ending **December 2025**, reaching **12,269 crore**. Net profit for the period surged **45%** to **452 crore**, driven by strong volume growth in Europe and Latin America. Addressing leverage remains a primary strategic goal. The company successfully reduced its net debt by **2,553 crore** over the past year, bringing the total down to **23,317 crore**. Management has set a target to improve the Net Debt to EBITDA ratio to a range of **1.6x–1.8x** by the end of **March 2026**. Market Sentiment and Outlook Investor caution stems from the complexity of the merger and potential execution risks. While the move is designed to eliminate the "conglomerate discount" and unlock value, analysts have flagged concerns over near-term cash flow and the lack of a precise timeline for the integration. The broader agrochemical sector continues to face pricing headwinds due to Chinese overcapacity. However, demand for herbicides and fungicides remains robust, with global crop protection spending projected to grow by **2.6%** in the coming year. Strategic deleveraging is further supported by the upcoming IPO of **Advanta**, UPL’s seeds and technology unit. Proceeds from this listing are intended to further strengthen the group’s balance sheet as it transitions toward a more focused corporate structure.

Internet Stocks Decline Up to 28% YTD as Brokerages Maintain Positive Outlook on Paytm, Groww, and Five Others Post-Q3
Market Brief: Indian Internet Sector Q3 Update The Indian internet ecosystem is currently navigating a period of sharp divergence. While several key platforms delivered record revenue momentum and profit expansion in the December quarter, share prices have faced downward pressure due to broader market volatility and waning sentiment in the new-age tech space. Total year-to-date declines for some internet stocks have reached up to **28%**. However, underlying business fundamentals show a significant pivot toward sustainable profitability and margin expansion across major players. Key Performance Drivers **Zomato (Eternal Ltd)** The food delivery and quick-commerce leader reported a staggering **202%** year-on-year jump in revenue. Profit after tax surged **73%**, reflecting strong operating leverage. Despite these metrics, the stock has traded flat at approximately **₹271.95**, as investors weigh valuation against long-term growth. **Paytm (One 97 Communications)** The fintech major achieved a notable turnaround, posting a net profit of **₹225 crore** for the quarter, compared to a loss of **₹208 crore** in the previous year. Revenue grew **20%** to **₹2,194 crore**, driven by a **35%** growth in consumer UPI volume. Market price currently stabilizes around **₹1,115**, with brokerages setting upside targets near **₹1,375**. **Nykaa (FSN E-Commerce)** Strong demand during festive sales propelled a **142%** rise in net profit, reaching **₹63.3 crore**. Revenue climbed **27%** to **₹2,873 crore**. The company expanded its specialized retail footprint to **276 stores**, maintaining a double-digit same-store sales growth. **PB Fintech (Policybazaar)** The insurance aggregator reported a **37%** revenue increase, with net profit soaring **164%**. While operational efficiency has improved, the stock remains down **18%** year-to-date, mirroring the cautious sentiment toward high-growth digital platforms. Emerging Trends & IPO Pipeline Market sentiment is shifting from "growth at any cost" to a focus on cash flow and margin stability. This maturity is evident in the robust IPO pipeline for 2026. Nearly **14 companies** aim to raise over **₹20,000 crore** in the coming months. High-profile listings such as **PhonePe**, **Jio**, and **Lenskart** are expected to hit the market within the next six months. Lenskart, in particular, has seen renewed interest with target prices established around **₹600** by major brokerages. Sector-wide, IT spending in India is projected to reach **₹15.14 lakh crore** by the end of 2026. This growth is increasingly driven by data-center expansion and the integration of native digital service models, despite a global cooling in traditional software exports.

Global Market Performance vs. US Market Equities
U.S. investors are orchestrating a massive structural shift in capital, moving billions away from domestic equities to break a decade of "home bias." For the first time in years, international markets are outperforming the S\&P 500 by significant margins, signaling a potential end to the era of American exceptionalism. Global markets outside the U.S. delivered a staggering 31% return in dollar terms throughout 2025. This performance outpaced U.S. equities by more than 1,500 basis points, the widest gap recorded since 1993. The rotation is driven by a stark valuation disconnect: U.S. stocks currently trade at a 34% premium over international peers, well above the long-term historical average of 19%. Emerging Markets (EM) have emerged as the surprise leaders of this cycle. The MSCI Emerging Markets Index surged 34% in 2025, nearly doubling the S\&P 500’s 18% return. Despite this rally, EM remains deeply undervalued at 13.5x forward earnings, representing a 40% discount compared to the U.S. market. Japan and Europe are also capturing significant inflows. Japan is benefiting from structural corporate reforms and a return of inflation, while European markets—led by Germany’s DAX—have seen strong gains in defense, banks, and industrials. Investors are increasingly drawn to these regions for dividend yields that are often twice as high as those found in the U.S. The U.S. dollar, long a headwind for international returns, fell roughly 8% in late 2025. This weakening trend has removed a major barrier for American investors, boosting the value of foreign holdings when converted back to dollars. Narrowing interest rate differentials and stronger economic activity abroad suggest the dollar’s decade-long uptrend may be cooling. Concentration risk in the U.S. remains a primary concern. The top 10 companies now represent over 40% of the S\&P 500, with much of that value tied to intensive AI capital expenditure. While AI remains a core growth theme, many investors are diversifying into "AI laggards" in Europe and Asia that offer more attractive entry points. Capital flow data confirms the trend is accelerating. In late 2025, U.S. residents increased their holdings of long-term foreign securities by nearly 35 billion in a single month. As corporate earnings growth begins to narrow between the U.S. and the rest of the world, this global reallocation is expected to remain a dominant theme through 2026. [Global Equity Performance Analysis](https://www.google.com/search?q=https://www.youtube.com/watch%3Fv%3DqkaDISrJ0lQ) This video provides a detailed breakdown of why international markets began outperforming the U.S. in 2025 and analyzes the historic valuation gap between these regions.
Silver and Gold Prices Surge Amid US-Iran Tensions and Tariff Uncertainty
Precious Metals Market Brief: February 23, 2026 Gold and silver prices surged this Monday as geopolitical instability and trade policy shifts redirected global capital into safe-haven assets. Spot gold rose **0.8%** to reach **$5,148.08** per ounce, maintaining its position above the critical **$5,000** threshold. Silver followed with a stronger gain of **2%**, climbing to **$86.52** per ounce. In India, the Multi Commodity Exchange (MCX) reflected this upward momentum. Gold futures held steady near **₹1,59,420** per 10 grams, while silver prices in major metros like Delhi and Mumbai were quoted at approximately **₹2,74,900** per kilogram. Trade Policy and Geopolitical Catalysts The primary driver for today's rally is the escalating trade tension following a landmark US Supreme Court decision. The court struck down President Donald Trump’s broad tariff powers, ruling the use of emergency laws to levy reciprocal duties was unlawful. In immediate retaliation, President Trump announced a temporary **15%** global tariff on imports, up from the previous **10%**. This move has heightened market uncertainty, causing India to postpone scheduled trade talks with the US and prompting European officials to reassess their trade commitments. Simultaneously, persistent US-Iran tensions have fueled risk aversion. Investors are increasingly pivoting away from volatile equities and moving toward bullion to hedge against potential regional escalations. Domestic Regulatory Shifts and Liquidity Trading conditions in India have become significantly more favorable for participants. The MCX and NSE recently withdrew additional margin requirements that were previously imposed to curb extreme volatility. The removal of the **3%** additional margin on gold and the **7%** additional margin on silver has dramatically improved capital efficiency. This reduction in the cost of carry is expected to boost trading volumes and encourage broader participation in precious metal futures. Despite the recent rally, silver remains in a consolidation phase. It has recovered roughly **₹20,000** from its February 18 low of **₹2,55,000**, though it still sits well below its January all-time high of **₹4,10,000**. Technical Outlook and Sentiment Market analysts note that gold continues to show relative strength compared to silver. The gold-silver ratio remains elevated, reflecting gold's superior performance as a defensive asset during this period of high-frequency news cycles. Support for gold is currently established in the **$4,964** to **$4,915** range, with resistance anticipated between **$5,055** and **$5,122**. For silver, immediate support is seen at **₹2,38,000** on the MCX, with upside resistance nearing **₹2,54,400**. Long-term sentiment remains bullish, supported by consistent central bank demand. Global institutions are projected to average **585 tonnes** of quarterly gold demand throughout 2026 as they diversify official reserves away from fiat currencies.