Bullish News
Collection
US Supreme Court Ruling on Trump Tariffs: Global Market Implications
Global markets have entered a period of volatile relief following a landmark February 20, 2026, ruling by the US Supreme Court. In a 6-3 decision, the Court struck down sweeping global tariffs, ruling that the executive branch exceeded its authority under the International Emergency Economic Powers Act (IEEPA) of 1977. This decision has effectively lowered the trade-weighted average US tariff rate from 15.4% to approximately 8.3%. Investors and trade partners are currently assessing the impact of this legal reset, which invalidates country-specific "reciprocal" duties and emergency levies that had generated over $175 billion in revenue. Financial markets responded immediately to the news. The Dow Jones Industrial Average rose 207 points to reach 49,602, while the S&P 500 climbed 0.52% to 6,895. This rally reflects short-term optimism as businesses anticipate a more predictable trade environment and the potential for billions of dollars in tariff refunds. However, the relief may be temporary. Within hours of the ruling, the administration invoked Section 122 of the Trade Act of 1974 to impose a new 10% global import surcharge. This was quickly adjusted on February 21 to a 15% global tariff framework. Unlike the previous emergency levies, these new duties are subject to a 150-day statutory limit unless extended by Congress. Key sectors remain under pressure. The Court’s ruling does not affect industry-specific duties on steel, aluminum, and automotive imports, which remain in place under separate national security authorities. For major partners like India, the effective tariff burden has shifted from 18% under previous deals to 15% under the current revised framework. Global trade dynamics are now focused on legislative hurdles. With the 150-day window active for the new 15% tariffs, the focus shifts to the US Congress, which now holds a more central role in determining trade policy. Markets are bracing for continued uncertainty as the administration explores alternative legal avenues to maintain its trade agenda. Current economic indicators suggest that while the ruling provides a structural check on executive power, the broader trend of economic nationalism persists. Analysts expect persistent price pressures, as the effective US tariff rate remains significantly higher than the 3% level seen at the start of 2025. Trade partners including the EU, China, and Canada are now re-evaluating bilateral agreements that may have been rendered obsolete by the Court's decision.

Impact of IT Sector Performance on Mutual Fund Returns and SIP Portfolios
Market Brief: Indian IT Sector & Mutual Fund Impact The Indian IT sector is navigating a significant period of volatility as of **February 2026**. Concerns over **Artificial Intelligence (AI)** disruption and slowing global discretionary spend have triggered a sharp correction in frontline tech stocks. The **Nifty IT Index** has faced intense selling pressure, dropping approximately **16%** over the last month. Year-on-year, the index has declined by more than **21%**, currently trading near its 52-week lows around the **32,000** mark. Key Market Data * **Nifty IT Index:** ~32,004 (down **0.98%** in the latest session) * **Monthly Decline:** **16-17%** * **Annual Decline:** **21.69%** * **Major Stock Hits:** * **TCS:** Down **29%** from 52-week high * **Infosys:** Down **27%** from 52-week high * **Wipro & Oracle:** Crashed over **30%** from recent peaks Mutual Fund Exposure & Investor Sentiment Indian retail investors are feeling the heat as diversified equity funds hold significant exposure to the IT sector. Mutual funds currently have approximately **₹4,00,000 crore** at stake in IT stocks. However, fund managers have started trimming positions. In **January 2026**, mutual funds were net sellers in **9 out of 10** major IT companies. **ICICI Prudential AMC** alone offloaded nearly **₹1,953 crore** in Infosys and **₹783 crore** in TCS during this period. The AI Disruption Factor The "AI Scare" is no longer theoretical. Reports suggest that generative AI and automation are delivering productivity gains of **20% to 40%** in core tasks like coding and testing. This shift is eroding the traditional billable-hours model of Indian IT services. Market experts indicate that global capital is shifting toward AI infrastructure and software platforms, potentially contracting the services share of tech spend by **8 percentage points** through 2026. Portfolio Implications For investors with **SIPs (Systematic Investment Plans)** or lump sum holdings in diversified and large-cap funds, the IT slump is a drag on overall returns. While the broader **Nifty 50** remains relatively resilient with an annual gain of over **11%**, the IT sector's underperformance is creating a stark divergence. The **India AI Impact Summit 2026** held in New Delhi highlighted that companies must now pivot from "outsourcing" to "AI-led transformation" to regain investor confidence. Investors are closely watching the **₹31,400 - ₹32,000** support levels for the Nifty IT index. A breach below these levels could signal further downside for technology-heavy portfolios. This video provides a deep dive into how AI is fundamentally changing the revenue models of major Indian IT firms. [AI Impact on Indian IT Stocks 2026](https://www.youtube.com/watch?v=CkqR0lvOI2M) http://googleusercontent.com/youtube_content/0

Indian Benchmark Indices Rise on Domestic and Global Cues
Market Brief: Indian Equities Surge on US Tariff Ruling Indian benchmark indices opened with significant gains on Monday, February 23, 2026. The BSE Sensex climbed over **600 points** to cross the **83,300** mark, while the Nifty 50 advanced past **25,700**. This rally follows a pivotal legal development in the United States that has reshaped global trade expectations. The primary catalyst was the US Supreme Court's Friday decision to strike down President Donald Trump's sweeping global tariffs. The court ruled 6-3 that the administration exceeded its authority under the International Emergency Economic Powers Act. This judgment effectively invalidated a central pillar of recent US trade policy, which had been a major source of volatility for emerging markets. Market sentiment was further bolstered by the prospect of significant corporate refunds. Estimates suggest over **$175 billion** in previously collected US tariffs could be subject to potential claims. In India, export-oriented sectors such as IT, Pharmaceuticals, and Textiles are leading the gains as the effective tariff burden on Indian goods is expected to ease toward **10%**, down from earlier peaks near **25%**. Global cues remain cautiously optimistic. While the court ruling provides immediate relief, the US administration has already responded by announcing a new **15%** global tariff rate through alternative legal channels. However, investors view the judicial intervention as a vital check on executive trade power, leading to a more predictable—if still contested—trade environment. Domestic institutional investors supported the rally, acting as net buyers of equities worth **₹2,637 crore** in recent sessions. This offset continued selling by foreign portfolio investors. Additionally, a **1%** drop in crude oil prices on Monday further eased inflationary concerns for the Indian economy. Gains are broad-based across Dalal Street, with heavyweight stocks in the banking and auto sectors showing strong momentum. The GIFT Nifty had earlier signaled this gap-up start, trading at a premium of **163 points** before the domestic market opening. This [Sensex and Nifty analysis](https://www.google.com/search?q=https://www.youtube.com/watch%3Fv%3DR30v98u3eO8) provides a deeper look into how the US Supreme Court decision specifically impacts Indian export sectors.

Ola Electric to Reduce Physical Store Count
Market Brief: Ola Electric Strategic Pivot **Network Consolidation and Retail Reset** Ola Electric is aggressively scaling back its physical footprint as part of a "structural reset." The company aims to reduce its store network to approximately **550 outlets** by the end of March 2026. This is a significant reversal from earlier ambitions to reach 4,000 locations. Currently operating about 700 stores, the planned closure of another **150 sites** is intended to align costs with a cooling demand environment and a "leaner" operating model. **Financial Performance and Revenue Contraction** Latest Q3 FY26 results highlight severe operational pressure. Revenue from operations plummeted **55% year-on-year** to **₹470 crore**, down from ₹1,045 crore in the same period last year. Despite the top-line slide, net losses narrowed slightly to **₹487 crore** (from ₹564 crore), aided by a **43% reduction** in total expenses. Gross margins improved to **34.3%**, supported by vertical integration and the new Gen 3 platform. **Market Share Erosion** The company’s dominance in the electric two-wheeler segment has faded. Market share, which stood at **26%** a year ago, fell to **6.3%** in January 2026. Preliminary data for February 2026 indicates a further drop to approximately **4.2%**, placing Ola behind legacy players like TVS Motor (**28%**) and Bajaj Auto (**21%**), and even startup rival Ather Energy. **Volume and Delivery Metrics** Vehicle deliveries for the quarter ended December 31, 2025, totaled **32,680 units**, representing a **61% decline** compared to the previous year. To achieve EBITDA breakeven, management estimates a requirement of **15,000 units** per month. However, current monthly registration averages remain below this threshold, with February mid-month figures showing just **2,252 units** sold. **Stock Market Dynamics** The stock remains under heavy pressure, recently hitting a 52-week low of **₹28.71** before fluctuating around the **₹26–₹27** range. While recent trading sessions saw a massive volume surge of over **4.4 crore shares** suggesting potential accumulation, the technical outlook remains bearish. The stock is currently trading nearly **65% below** its post-listing peak, with a market capitalization stabilizing around **₹11,700–₹12,300 crore**. **Operational Outlook** The "Hyperservice" program is the primary internal focus to resolve brand trust issues. The company reports that **80% of service tickets** are now closed within the same day. Simultaneously, the Gigafactory is scaling toward **6 GWh** of installed capacity by March 2026 to deepen vertical integration and lower long-term unit costs.
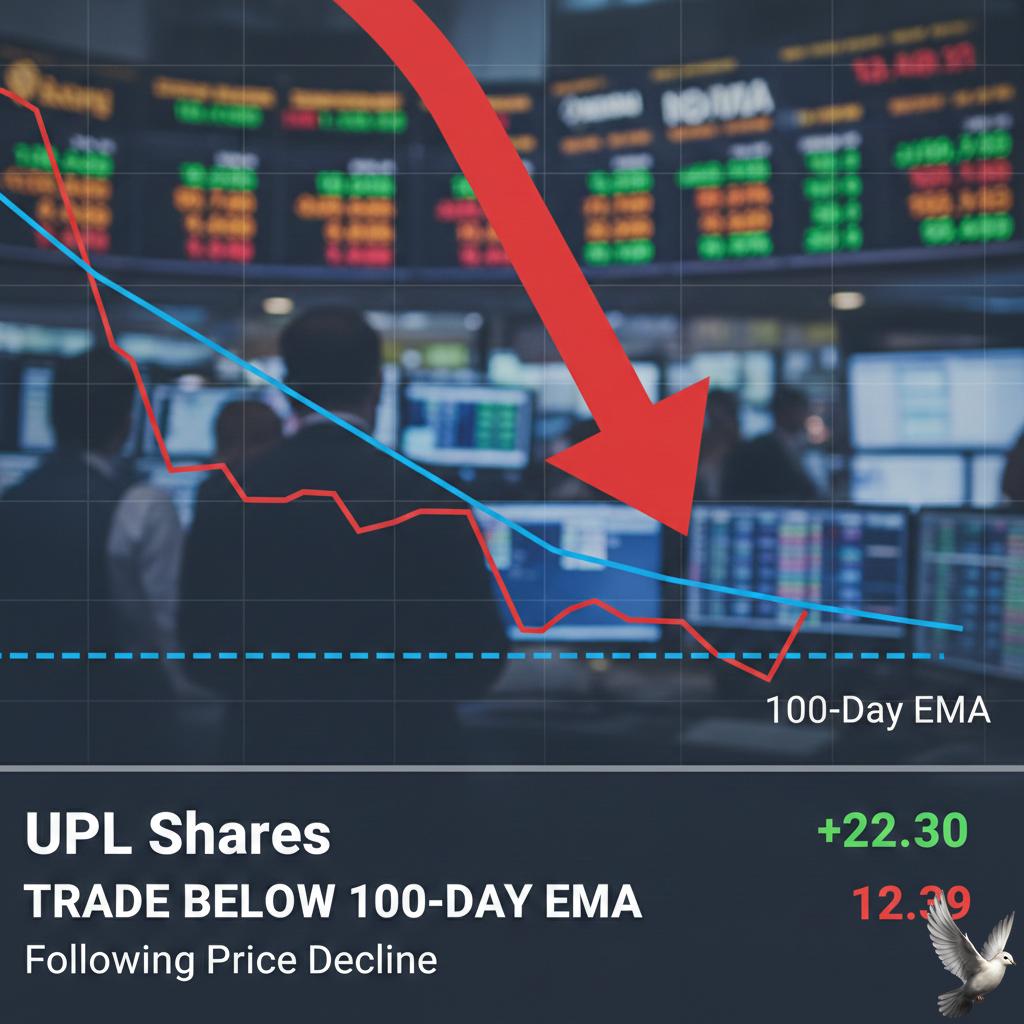
UPL Shares Trade Below 100-Day EMA Following Price Decline
Global Market Brief: February 23, 2026 Global financial markets are navigating a complex landscape defined by shifting trade policies and a pivot in monetary strategy. After a period of aggressive intervention, the narrative has moved toward stabilization and the management of geopolitical friction. Equities and Indices US equity markets show resilience despite ongoing volatility. The **S&P 500** recently traded near **6,900**, while the **Nasdaq Composite** pushed toward **22,800**. Market leadership remains concentrated, with high-weight stocks like Alphabet and Amazon providing a buffer against broader uncertainty. In India, the **BSE Sensex** has crossed the **83,000** milestone, supported by strong domestic institutional buying. The **Nifty 50** maintains its position above **25,600**. This performance reflects a decoupling from some Asian peers, such as the **Nikkei 225**, which faced pressure earlier in the session. Monetary Policy and Interest Rates The Federal Reserve has paused its easing cycle, holding the federal funds rate in the **3.5% to 3.75%** range. Projections for the remainder of 2026 suggest a cautious approach, with potentially only one additional **25-basis-point** cut. The "neutral rate" is now widely estimated between **3.0% and 3.5%**. This shift from active cutting to a "simultaneous hold" reflects a stabilization in labor markets, where unemployment has settled near **4.4%**. Trade and Commodities Trade policy remains a primary source of market noise. Following judicial challenges to blanket tariffs, a new **15%** global tariff structure has been introduced. This has heightened concerns regarding global growth prospects and supply chain costs. Energy and metal markets are responding to these shifts: * **Crude Oil:** Prices have fluctuated near **$73** per barrel. * **Gold:** Bullion maintains strength, holding levels above **$5,100** as a hedge against trade-related risks. Technology and Digital Assets The technology sector is undergoing a valuation reset. While AI investment continues to drive **13–15%** earnings growth expectations for top-tier firms, investors are increasingly scrutinizing the immediate ROI on massive capital expenditures. In the digital asset space, **Bitcoin** has seen a correction, recently trading near **$64,800**. This downward pressure is attributed to increased "whale" selling and a general risk-off sentiment triggered by the new tariff environment. Economic Indicators Global growth for 2026 is projected at a subdued **2.6%**. While advanced economies show resilience, emerging markets are facing an uneven recovery. Inflation remains a persistent theme, with core PCE projected to end the year at approximately **2.4%**.

Retail Investor Strategy Amidst Nifty Bear Market Trends
Market Brief: Retail Trading Dynamics **February 23, 2026** Indian retail investors are increasingly adopting a "contrarian" stance, though data suggests this approach is challenging personal portfolio health. Recent market tracking reveals a persistent pattern: individual investors are aggressively buying stocks during sharp declines while liquidating positions as prices recover. While this behavior provides essential liquidity to the broader market, it has led to a noticeable divergence in returns. In the most recent quarter, retail holdings surged in over **1,019 companies** where share prices fell by an average of **8.6%**. Conversely, retail exposure was reduced in **1,092 companies** that saw price appreciation. Capital Flows and Market Anchors Domestic liquidity remains the primary stabilizer for Indian equities. Monthly SIP inflows have reached a historic range of **₹25,000 crore to ₹30,000 crore**, effectively cushioning the impact of volatile foreign outflows. Foreign Portfolio Investors (FPIs) have remained cautious, influenced by a weaker Rupee trading near **₹90.70** and shifting global yields. However, Domestic Institutional Investors (DIIs) continue to act as net buyers, frequently absorbing sell-offs with daily net purchases often exceeding **₹1,100 crore**. Sector Performance and Volatility Market sentiment is currently defined by sharp sectoral rotations. The **Nifty 50** and **Sensex** have faced pressure from a significant correction in the IT sector, which plunged over **8.2%** in a single week due to global technology shifts. * **Nifty 50** is hovering near the **25,800–26,000** resistance zone. * **Banking** remains a pillar of strength, with the **Bank Nifty** maintaining levels above **60,000**. * **Small-cap indices** have shown relative resilience, occasionally gaining while large-caps consolidate. The Cost of Active Trading Regulatory and fiscal changes are further impacting the profitability of frequent retail trading. Following the **Budget 2026** adjustments, the Securities Transaction Tax (STT) on derivatives has increased to **0.15%**. This change specifically targets high-frequency strategies. For active traders, these incremental costs can significantly erode net gains, particularly as historical data indicates that over **90%** of individual F&O participants have struggled to maintain profitability. Outlook on Domestic Demand Despite technical volatility, India’s economic fundamentals remain robust. GDP growth for the current fiscal year is projected between **7.5% and 7.8%**, supported by a decade-low average inflation rate of approximately **1.8%**. Retail participation has matured structurally, with direct plan adoption rising to **26%**. While "buying the dip" remains a popular retail tactic, the shift toward long-term systematic plans is providing a more stable foundation for the market compared to the speculative cycles of previous years.

Impact of Valuations on IT Stock Resilience Against AI Disruption: S Naren Analysis
The Indian Information Technology sector is currently navigating a period of significant structural adjustment. As of late February 2026, the Nifty IT index reflects this volatility, trading near the **32,004** level. This represents a decline of approximately **0.98%** in recent sessions and a more substantial correction of nearly **21%** over the past year. Market valuations have retreated from previous peaks, with the sectoral Price-to-Earnings (P/E) ratio now hovering around **22.74**. While these levels appear more attractive compared to the historical highs of the post-pandemic era, institutional experts suggest caution. S Naren of ICICI Prudential AMC notes that low multiples alone do not provide a sufficient safety net in a disrupting landscape. The primary source of uncertainty is the accelerating impact of Artificial Intelligence. Industry leaders have highlighted a massive shift in the global workforce, projecting that while AI could put **90 million** traditional tech roles at risk, it may simultaneously create **170 million** new opportunities. This "root-and-branch" transformation is forcing companies to pivot from routine development and testing toward high-skill AI engineering and agentic workflow design. Quarterly earnings for the period ending December 2025 further underscore the sector's current strain. Major players like Infosys reported a **2.2%** year-on-year decline in net profit to **6,654 crore**, while LTIMindtree saw a sharp **30.7%** profit drop to **971 crore**. These figures highlight the immediate pressure from rising operational costs and one-time regulatory expenses, even as deal pipelines remain active. Investor sentiment remains tethered to long-term growth clarity. While a correction in global AI-linked stocks could trigger a relative outperformance for Indian equities, the sector's upside depends on whether AI enhances or impairs the traditional services model. Currently, Tier 2 companies are showing more agility, often outperforming Tier 1 giants in revenue growth during this transition. For the sector to regain decisive momentum, it must move beyond mere cost-optimization. High dividend yields and lower entry prices are providing some downside protection, but the market is still waiting for proof that Indian IT can successfully monetize the AI transition without permanent impairment to industry margins. This video analyzes the recent sell-off in major IT stocks and evaluates whether current valuations represent a value trap or a long-term buying opportunity.
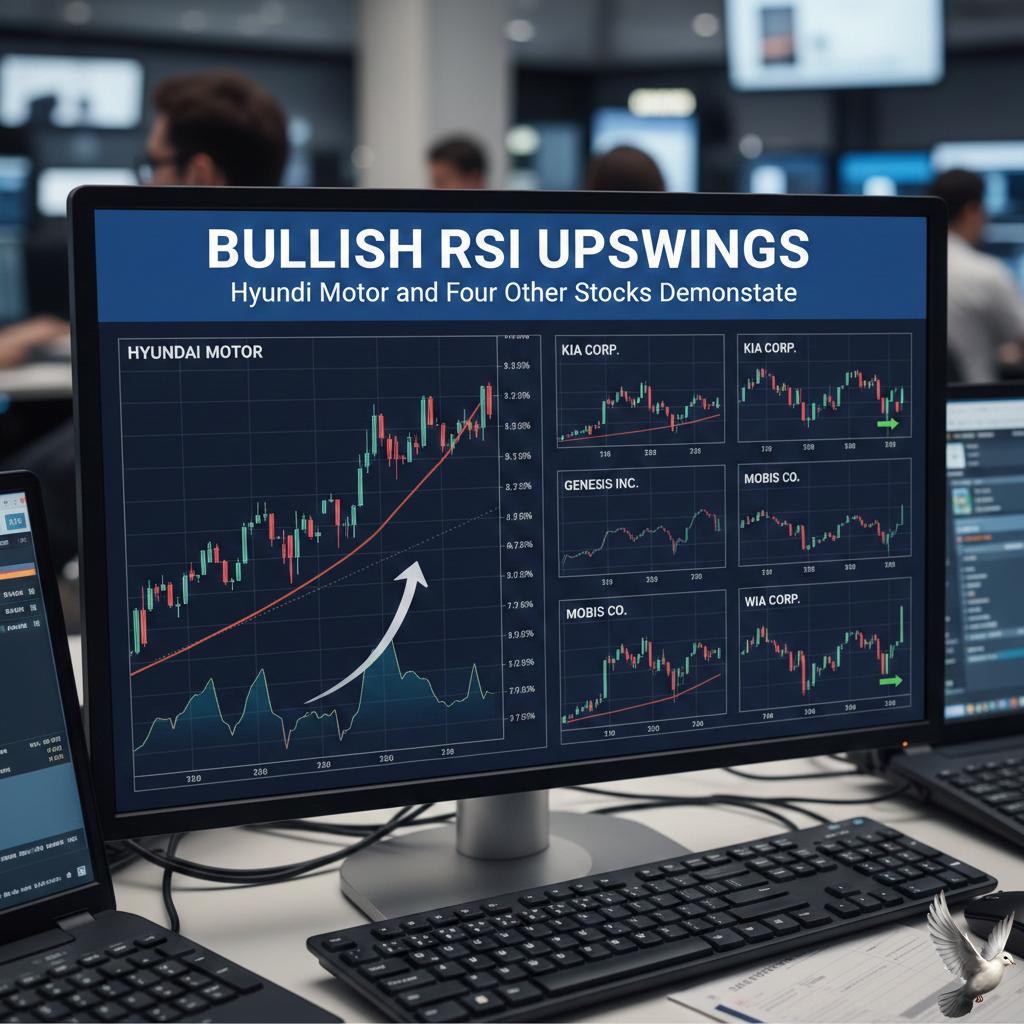
Hyundai Motor and Four Other Stocks Demonstrate Bullish RSI Upswings
Market Brief: Nifty 500 Technical Breakouts The Nifty 500 index reached **23,395.00** on February 20, 2026, marking a **0.4%** rise amid a broader market recovery. Technical scans have identified a cluster of high-momentum stocks, led by Hyundai Motor India and Siemens, which have cleared significant resistance levels and bullish RSI crossovers. Hyundai Motor India (HYUNDAI) Hyundai Motor India emerged as a top gainer, surging **5.16%** to close at **2,293.40**. The stock successfully crossed its **200-day Moving Average (DMA)** of **2,246.15**, signaling a potential shift into a long-term uptrend. Trading volume saw a significant spike, reaching over **942,000** shares, nearly double the **20-day average**. Technical indicators show a weekly stochastic crossover, which historically precedes an average price gain of **7.5%** over the subsequent seven weeks. Despite recent revenue contraction of **1.74%**, the company maintains a healthy **Return on Equity (ROE)** of **34.83%**. Siemens Ltd (SIEMENS) Siemens demonstrated robust strength, gaining **3.41%** to end at **3,206.20**. The stock cleared its **200-DMA** of **3,151.76** and is currently trading above all major moving averages, including the **5, 20, 50, and 100-day** marks. In the last month, Siemens has outpaced the broader market with a **13.21%** return, compared to the Sensex's **0.90%** rise. While momentum oscillators like the RSI have crossed above the **50** mark, indicating strengthening price action, the stock is approaching a neutral-to-overbought zone on monthly charts. Momentum Trends in Nifty 500 Several other constituents have mirrored this bullish behavior, crossing above their **50-day Simple Moving Average (SMA)**: * **JSW Energy**: Gained **2.9%** to reach **494.00**, trading **2.8%** above its 50-day average. * **Granules India**: Rose **3.6%** to **599.10**, clearing its 50-day resistance by **2.7%**. * **Canara Bank**: Increased **3.2%** to **154.20**, maintaining a **2.6%** cushion above its SMA. The collective RSI crossover above **50** for these five stocks suggests that the prevailing sentiment is shifting from consolidation to active accumulation. Traders are currently monitoring the **2,345** target for Hyundai and the **3,250** resistance zone for Siemens as immediate benchmarks for short-term momentum continuation.

Gaudium IVF IPO: Current GMP, Subscription Data, and Analyst Reviews
Gaudium IVF and Women Health Limited has extended its momentum into Day 2 of its initial public offering, fueled by robust participation from retail investors. As of February 23, 2026, the issue has seen a significant uptick in demand, building on a strong opening day that recorded an 88% overall subscription rate. The IPO, which aims to raise 165 crore, is priced in a band of 75 to 79 per share. Market sentiment remains positive, with the Grey Market Premium (GMP) holding steady at approximately 8.5 to 11 per share. This indicates a potential listing gain of nearly 11% over the upper price band. Retail interest has been the primary driver of the offering, with this segment already oversubscribed at 1.37 times on the first day. The company is offering a mix of a fresh issue worth 90 crore and an offer for sale (OFS) totaling 75 crore. Financially, Gaudium IVF has demonstrated a consistent growth trajectory. Revenue from operations climbed to 70.72 crore in FY25, up from 47.89 crore the previous year. Profitability remains a core strength, with the company reporting a net profit of 19.13 crore for FY25 and maintaining healthy EBITDA margins of approximately 40%. The proceeds from the fresh issue are earmarked for an aggressive expansion strategy. The company plans to allocate 50 crore to establish 19 new IVF centers across India, aiming to solidify its presence in a fragmented but rapidly growing market. An additional 20 crore will be utilized for the repayment of outstanding borrowings. India’s fertility services sector is currently valued at approximately 1.54 billion USD and is projected to grow at a compound annual growth rate of 12.7% to 17.5% over the next decade. Key drivers include rising infertility awareness, delayed parenthood trends, and increasing disposable income among urban populations. Brokerages have largely issued "Subscribe" ratings, pointing to the company’s high return on equity (ROE) of 41.31% and its first-mover advantage as a pure-play listed fertility specialist. However, analysts also highlight a premium valuation of 28 to 30 times FY25 earnings and a pending 31 crore tax dispute as factors for cautious monitoring. The subscription window closes on February 24, 2026, with the basis of allotment expected to be finalized by February 25. Shares are scheduled to debut on the BSE and NSE on February 27, 2026.

Gold Prices Increase Amid Uncertainty Regarding US Trade Policy and Tariffs
Market Brief: Gold and Global Trade Reset **Gold prices** are maintaining a powerful recovery as of **February 23, 2026**, with bullion trading near **$5,144 per ounce**. This follows a recent surge that saw prices climb as much as **1.3%** to touch levels above **$5,170**. In domestic markets, **24K gold** is holding steady at approximately **₹15,942 per gram**, consolidating after a significant four-day rally. Legal Shift in Trade Policy The primary driver of this market movement is the landmark **6-3 decision** by the **U.S. Supreme Court** on **February 20, 2026**. The court ruled that the administration exceeded its authority by using emergency powers to impose broad global tariffs. This decision invalidated the **10% baseline** and various reciprocal duties that had been in place since early **2025**. In immediate response, a new **10% global tariff** was announced under different legal provisions, while a proposal for a **15% blanket tariff** remains on the table. This legal "reset" has created a wave of uncertainty across international trade corridors. Currency and Trade Impact The **U.S. Dollar Index** dropped **0.3%** following the ruling, as investors priced in a higher risk premium for American assets. This weakening of the greenback has made gold more affordable for international buyers, accelerating its momentum. Global trade deals are currently in a state of flux: * **European Union:** Trade officials have proposed delaying the ratification of new agreements with Washington until legal clarity is restored. * **India:** Officials have postponed high-level trade missions to the U.S. as they reassess the impact of the new **10% global levy**. * **Japan:** Market sentiment remains volatile as lawmakers describe the sudden shift in tariff authority as a significant disruption to established negotiations. Outlook for Bullion Gold is increasingly viewed as a critical hedge against this systemic instability. Analysts point to a combination of disappointing **Q4 GDP** data (growing at just **1.4%**) and persistent geopolitical tensions as secondary supports for the metal. While the market is currently in a consolidation phase near recent highs, the structural demand from central banks and the shift away from dollar-denominated assets suggest the recovery has significant underlying strength. The metal remains within striking distance of its **February high** of **$5,600**, supported by a broader "debasement trade" as global debt levels continue to climb.

Nine Sensex stocks with up to 40% projected upside potential
The BSE Sensex remains a focal point for institutional conviction as it navigates a volatile February **2026**. Following a sharp recovery from the February **1** Budget Day plunge, the index closed the most recent session at **82,814.71**, marking a modest weekly gain of **0.20%**. Market sentiment is currently shaped by a "buy-on-dips" strategy. While the bull case scenario from major brokerages suggests the Sensex could reach **107,000** by year-end, the immediate environment is defined by sectoral rotation and reaction to global trade shifts. **Financials and Infrastructure Leaders** State Bank of India (SBI) has emerged as a top analyst pick with a target price of **1,146**. The lender is viewed as a primary engine for credit growth, supported by a clean balance sheet and a massive retail portfolio. Larsen & Toubro (L&T) continues to dominate the engineering space with a target of **4,380**. It remains a core beneficiary of the "Make in India" manufacturing push and a robust national infrastructure order book. **Digital and Consumption Heavyweights** Bharti Airtel is frequently cited as a significant wealth creator for **2026**. Driven by exploding data usage and a shift toward 5G enterprise solutions, analysts have set aggressive target prices near **2,365**. In the consumer segment, Britannia Industries has shown resilience with **9.5%** revenue growth. Analysts maintain a constructive long-term view with targets reaching **7,150**, citing stable commodity prices and expanding profit margins. **Sector Performance and Risks** The metal sector, led by Tata Steel, recently surged by **2.8%** following potential easing of international trade tariffs. Similarly, PSU banks added over **3%** in recent rallies, outperforming the broader market. However, the technology sector faces headwinds. Heavyweights like Infosys and Wipro have lagged, declining between **1.2%** and **1.6%** in recent sessions. This underperformance is attributed to uncertainty in global tech demand and a shift in capital toward cyclical stocks. **Economic Indicators to Watch** The Indian Rupee has stabilized near **90.66** against the US Dollar. Investors are closely monitoring the Reserve Bank of India’s stance on interest rates, as any future cuts would lower borrowing costs and further stimulate the auto and banking sectors. Flash PMI data for February indicates private sector activity has reached a three-month high. This industrial momentum, combined with steady SIP inflows of **31,000 crore**, provides a structural floor for the market despite geopolitical tensions.

Shree Ram Twistex IPO: Key Details on GMP, Price Band, and Subscription Period
Shree Ram Twistex Limited has officially launched its Initial Public Offering (IPO) today, Monday, February 23, 2026. The Rajkot-based cotton yarn manufacturer seeks to raise approximately 110.24 crore through a fresh issue of 1.06 crore equity shares. The price band for the issue is set between 95 and 104 per share. Investors can participate with a minimum lot size of 144 shares, requiring a retail investment of 14,976 at the upper price limit. The subscription window remains open until Wednesday, February 25, 2026. Current market sentiment shows a modest start for the IPO. While earlier grey market premiums suggested moderate gains, the latest data indicates the Grey Market Premium (GMP) is hovering around 5 per share, representing a 4.81% upside. This places the estimated listing price at approximately 109 per share. The company plans to strategically deploy the net proceeds to enhance operational efficiency. Approximately 39 crore is earmarked for setting up captive solar and wind power plants (6.1 MW and 4.2 MW respectively) in Gujarat. Additionally, 14.89 crore will be used for debt repayment, while 44 crore is allocated for working capital. Financial performance has shown steady growth leading up to the listing. Revenue from operations increased from 213.10 crore in FY23 to 255.04 crore in FY25. More notably, net profit surged from 2.05 crore to 8.00 crore in the same period, reflecting a compound annual growth rate (CAGR) of 97.46%. Efficiency metrics have also improved, with EBITDA margins expanding to 12.90% for the six months ending September 2025. This improvement is largely attributed to a shift toward higher-margin products, such as organic and Eli Twist yarns, which now account for a significant portion of the revenue mix. Despite the growth, the company faces high customer concentration, with the top 10 clients contributing nearly 80% of total revenue. Welspun Living alone accounted for over 28% of sales in the first half of FY26. The broader Indian cotton yarn market is projected to grow from 10.92 billion USD in 2025 to over 22 billion USD by 2035. This long-term outlook is supported by "China plus one" sourcing strategies and a rising global demand for sustainable and organic textiles. Share allotment is expected to be finalized on February 26, 2026, with the official listing scheduled for Monday, March 2, 2026, on both the BSE and NSE.

Kiaasa Retail IPO: Key Details and GMP Overview
Kiaasa Retail Limited has launched its initial public offering (IPO) today, **February 23, 2026**, seeking to raise **Rs 69.72 crore**. The company, a prominent player in the women's ethnic and fusion wear segment, is offering **54.90 lakh** fresh equity shares. The price band is fixed between **Rs 121 and Rs 127** per share. Investors must bid for a minimum lot of **1,000 shares**, though retail participants are required to bid for at least **2 lots**, bringing the minimum investment to **Rs 2,54,000**. Grey market activity suggests a muted debut, with the Grey Market Premium (GMP) currently holding at **Rs 0**. This indicates that the unofficial market is not factoring in immediate listing gains. The company's expansion strategy is the primary driver of this capital raise. Of the total proceeds, **Rs 46.45 crore** is earmarked for opening new stores. Kiaasa currently operates **124 outlets** across **70 cities**, with plans to add **41 more** in the current cycle and **20 additional** stores in FY27. Financial performance for FY25 showed strong momentum. Total income reached **Rs 121 crore**, up from **Rs 85 crore** in FY24. Profit after tax (PAT) rose to **Rs 8.38 crore**, representing significant year-on-year growth compared to the **Rs 5.74 crore** reported previously. The brand utilizes a diverse operational framework including **FOFO** (Franchise Owned Franchise Operated), **COCO** (Company Owned Company Operated), and **FICO** (Franchise Invested Company Operated) models. While it has a growing national footprint, revenue remains concentrated in northern regions, with Uttar Pradesh alone contributing roughly **28.8%** of total earnings. The subscription window remains open until **Wednesday, February 25, 2026**. Allotment is expected to be finalized on **February 26**, with the official listing on the **BSE SME** platform scheduled for **March 2, 2026**. This offering comes amid a broader shift in the Indian ethnic wear market toward "wearable luxury" and fusion styles, a sector projected to maintain steady growth through 2026 as consumer preferences lean toward affordable, high-quality fashion in Tier-II and Tier-III cities.

Clean Max Enviro IPO: Brokerage Reviews, GMP, and Subscription Status
**Market Brief: CleanMax Enviro Energy IPO** **IPO Launch and Market Sentiment** The subscription window for CleanMax Enviro Energy Solutions opens today, Monday, February 23, and will remain available until Wednesday, February 25. This **₹3,100 crore** public issue is a major test for the renewable energy sector in a cautious primary market. The current Grey Market Premium (GMP) is sitting at a marginal **₹3 to ₹7**, indicating a potential listing gain of less than **1%** over the upper price band of **₹1,053**. **Pricing and Participation** The price band is fixed between **₹1,000 and ₹1,053** per equity share. Retail investors can participate with a minimum investment of **₹14,742** for a lot of 14 shares. The issue is structured with a fresh equity component of **₹1,200 crore** and an Offer for Sale (OFS) of **₹1,900 crore** from existing promoters and investors, including Brookfield-backed entities. **Strategic Deleveraging** A primary objective of the fresh capital is the repayment of debt. Approximately **₹1,123 crore** of the proceeds is earmarked to reduce the company's significant borrowing, which stood at roughly **₹10,121 crore** as of late 2025. This move is intended to lower interest expenses and improve net margins, which have only recently turned positive. **Operational Footprint** CleanMax is India’s largest renewable energy provider in the commercial and industrial (C&I) sector. As of late 2025, it maintained an operational, owned, and managed capacity of **2.80 GW**, with a massive pipeline of **3.17 GW** under contract. The business model relies on long-term Power Purchase Agreements (PPAs) with a weighted average tenure of nearly **23 years**, providing significant revenue visibility. **Financial Performance** The company reported a total income of **₹1,610 crore** for FY25, achieving a slim profit of **₹19.43 crore** after consecutive years of losses. While EBITDA margins have shown strong growth—climbing to over **60%**—the valuation remains a point of contention. At the upper price band, the IPO is priced at a trailing price-to-earnings (P/E) multiple exceeding **380x**, significantly higher than several established peers. **Investor Outlook** Analysts are maintaining a neutral to cautious stance. While the structural shift toward green energy and a blue-chip corporate client base offer long-term appeal, the aggressive valuation and heavy debt levels may cap short-term upside. Market participants are closely watching subscription levels in the institutional and retail segments to gauge whether the "green theme" can overcome the current trend of muted listing debuts.

9 Stocks Cross Above 200-Day Moving Average
Market Technical Brief: February 23, 2026 The global equity landscape remains defined by a critical technical threshold: the **200-day Simple Moving Average (SMA)**. As of late February 2026, major indices continue to use this level as the primary barometer for long-term health. As long as a stock or index maintains its price above this daily timeframe line, the structural uptrend is considered intact. The **S&P 500** currently reflects this resilience, trading at approximately **6,874**. Despite a "confused sea" of sector rotation, the index has remained above its **200-day SMA** since mid-May of last year. This sustained position confirms a bullish primary trend, even as the index sits roughly **0.99%** below its January all-time highs. Sector Performance and Deviations Market bifurcation is extreme, with several sectors showing significant extension above their moving averages: * **Energy and Materials** have surged, with some constituents trading **3 standard deviations** above their mean. * **Industrials** have gained **12%** year-to-date, maintaining a steep elevation over the rising **200-day SMA**. * **Technology** remains a primary focus, acting as a support floor at the **135** level for key sector ETFs. While the broad trend is positive, the risk of "extension risk" is rising in overextended sectors. Conversely, **Financials** recently faced pressure, briefly breaking below their long-term average before attempting to recover the trend line. Global Indices and Indicators In international markets, the **Nifty 50** closed recently at **25,571**, with technical scans showing a cluster of large-cap stocks successfully crossing back above their **200-day SMA** to reclaim bullish status. Momentum remains sensitive to macroeconomic data, specifically the **Core PCE Price Index**, which recently showed a **3.0%** year-over-year acceleration. Volatility, measured by the **VIX**, has ticked up to **13.29**, signaling increased nervousness. However, as long as the price action does not breach the November lows—specifically the **6,521** level for the S&P 500—the long-term diagonal advance is expected to persist. Traders are currently using the **200-day SMA** not just as a trend indicator, but as a hard "stop-loss" level to protect capital during this period of high dispersion. The market surface appears calm with a realized volatility of only **3%**, yet the underlying rotation suggests active shifts between value and growth narratives.

Global Markets Mixed as Asian Equities Stabilize and Dollar Eases Amid Tariff Uncertainty
As of late February 2026, global financial markets are navigating a complex landscape of legal shifts and high-stakes corporate reporting. Regional indices in Asia have recently traded mostly lower, with Japan’s Nikkei 225 sliding **1.3%** and Australia’s S&P/ASX 200 dipping **0.15%**. The U.S. dollar index remains firm near recent highs, though it faces long-term pressure from shifting trade policies. Investor sentiment is currently caught between cooling domestic growth—with the flash U.S. Composite PMI falling to **52.3**—and a significant judicial pivot regarding international trade. The Tariff Reset A landmark Supreme Court ruling on February 20, 2026, invalidated the use of the International Emergency Economic Powers Act for broad tariff imposition. This decision effectively struck down several 2025 trade barriers that had increased the average tax burden per U.S. household by roughly **$1,000**. The administration has quickly pivoted, proposing new **10%** to **15%** tariffs under Section 122. While this creates a temporary reprieve for Asian exporters, the weighted average applied tariff rate is still projected to sit at **6.7%** for the year, the highest since the 1970s. Tech and Energy Volatility The technology sector is braced for Nvidia’s fiscal fourth-quarter earnings report on February 25. Analysts expect revenue to hit **$65.6 billion**, a **65%** year-over-year increase. Despite recent "underwhelming" price action, the stock remains the primary anchor for the Nasdaq, which recently gained **0.8%** on the back of new AI infrastructure partnerships. In the commodities space, energy markets are balancing geopolitical risk with diplomatic efforts. Brent crude futures are hovering near **$67.50**, while WTI crude remains around **$62.38**. Prices have eased slightly as negotiators in Geneva move forward with U.S.-Iran talks. However, the market remains sensitive to "war premiums"; estimates suggest that a total disruption of Iranian exports could spike Brent prices to an average of **$91** per barrel by the end of 2026. Economic Outlook The U.S. economy continues to show resilience but is signaling a transition phase. While the Federal Reserve has held interest rates steady at a target range of **3.25%–3.50%**, market participants are pricing in an additional **50 to 75 basis point** cut by the end of the year. The labor market is cooling as intended, with payroll growth decelerating. This is expected to push the unemployment rate toward the **mid-4%** range in early 2026, even as consumer spending remains stable due to high asset prices and recent tax adjustments.

Clean Max IPO: Long-Term Growth Potential and Risk Profile
Clean Max Enviro Energy Solutions (CleanMax), India’s leading renewable energy provider for the commercial and industrial (C&I) sector, is launching its Initial Public Offering (IPO) today, **February 23, 2026**. The company has set a price band of **₹1,000 to ₹1,053** per equity share. The total issue size is valued at **₹3,100 crore**, a reduction from the initially planned **₹5,200 crore**. IPO Structure and Timeline The public offer consists of: * **₹1,200 crore** in fresh equity issuance. * **₹1,900 crore** through an Offer for Sale (OFS) by existing promoters and investors. The subscription window closes on **February 25, 2026**. Shares are expected to be allotted on **February 26**, with a tentative listing on the BSE and NSE scheduled for **March 2, 2026**. Retail investors can participate with a minimum lot size of **14 shares**, requiring an investment of **₹14,742** at the upper price band. Financial Performance and Capital Usage CleanMax has demonstrated a significant financial turnaround. After reporting losses in previous years, the company achieved a profit of **₹19.43 crore** in FY25. For the first half of the current fiscal year (ending September 30, 2025), it recorded a profit of **₹19.00 crore** on a total income of **₹969.35 crore**. The company intends to use approximately **₹1,122.67 crore** of the fresh proceeds to repay or prepay existing borrowings. This move aims to deleverage a balance sheet that carried over **₹10,121 crore** in total debt as of late 2025. Market Position and Operations CleanMax maintains the largest market share in India's C&I renewable segment. As of October 2025, its portfolio reached: * **2.80 GW** of operational owned and managed capacity. * **3.17 GW** of contracted capacity currently under execution. The company serves a blue-chip client base of over **555 corporate customers**, including global tech giants like Google, Apple, and Amazon. Its revenue model is secured by long-term Power Purchase Agreements (PPAs) with an average duration of **22.85 years**. Sector Trends and Outlook The C&I segment has emerged as a primary growth driver for Indian renewables in 2026. This shift is fueled by rising grid tariffs and corporate "Net Zero" commitments. Open access solar and wind projects now account for **34%** of new capacity additions, up significantly from just **5%** in 2019. While CleanMax faces competition from peers like Adani Green and NTPC Green, its focus on the high-margin corporate "behind-the-meter" and open access markets provides a specialized niche. Investors are monitoring the high debt-to-equity ratio of **2.53** and geographic concentration, as nearly **79%** of power sales revenue currently originates from Karnataka and Gujarat.

RBI projected to provide ₹5 trillion liquidity in FY27
The Reserve Bank of India is expected to maintain its proactive liquidity management strategy by injecting approximately ₹5 lakh crore into the financial system during the upcoming fiscal year. This massive capital infusion is designed to address a persistent supply-demand imbalance in the bond market while ensuring the efficient transmission of previous interest rate cuts. As of February 2026, the central bank has held the benchmark repo rate steady at 5.25% following a cumulative reduction of 125 basis points over the past year. To complement these rate actions, the RBI has already deployed record-breaking tools, including buying bonds worth ₹6.5 lakh crore and executing ₹4.7 lakh crore in currency swaps throughout 2025. The upcoming liquidity operations focus on absorbing the heavy supply of government securities. With the fiscal deficit for FY26 budgeted at 4.4% of GDP and gross market borrowings projected at ₹14.8 lakh crore, the influx of bonds threatens to push yields higher. The RBI’s planned infusion aims to stabilize these borrowing costs and provide "durable liquidity" to a banking system that has seen surpluses fluctuate between ₹1.5 lakh crore and ₹3.4 lakh crore. Economic growth remains a key driver for these interventions. India’s GDP growth forecast for FY26 has been revised upward to 7.4%, supported by resilient domestic demand and robust services activity. Meanwhile, headline inflation has remained benign, projected at approximately 2.1% for the full year. This "Goldilocks" environment—characterized by high growth and low inflation—provides the central bank with the necessary room to focus on market liquidity without fueling price pressures. Market participants are particularly focused on the yield of the 10-year benchmark bond, which recently saw significant volatility. Yields dropped sharply to around 6.53% following the announcement of localized liquidity measures, but analysts anticipate they could range between 6.6% and 6.75% as the new auction calendar commences. By utilizing a combination of Open Market Operations (OMOs) and long-term US dollar-rupee swaps, the RBI intends to keep the overnight call money rate aligned with the repo rate. These operations are vital for non-banking financial companies (NBFCs) and small businesses, as they lower the overall cost of capital and encourage credit flow into productive sectors of the economy.

Global Capital Inflows Drive Latin American Equities Concluding the Rally
Latin American Markets Reach Multi-Year Highs Latin American equity markets are currently experiencing their most significant investor inflows in over a decade. This surge in liquidity has propelled major indices in **Brazil, Colombia, and Mexico** to multi-year peaks, as global capital reallocates toward emerging markets offering high real yields. The **MSCI EM Latin America Index** has climbed over **20%** in 2026, recently touching an 11-year high. This performance outpaces the broader MSCI Emerging Markets Index, which has seen an **11%** rise over the same period. Brazil: Record Breaking Performance The **Ibovespa** has achieved a historic milestone, reaching the **190,000-point** mark for the first time. The index has gained **15%** in local currency and an impressive **21%** in dollar terms since the start of the year. Foreign investors are the primary drivers of this rally, injecting **R$ 34.67 billion** into the Brazilian stock exchange as of mid-February. Markets are pricing in an aggressive easing cycle, with expectations that the central bank will cut interest rates by **250 basis points** to reach **12.5%** by year-end. Colombia: All-Time Highs Colombia’s **MSCI COLCAP** index has surged to an all-time high of **2,424 points**. Over the last 12 months, the Colombian market has delivered a staggering return of **74.1%**, significantly outperforming regional peers. Growth in the Andean nation is bolstered by record highs in commodity prices, specifically gold and copper. Investors are also monitoring the upcoming election cycle, though current momentum remains driven by a **57.3%** concentration in the financial sector, which has benefited from robust local earnings. Mexico: Stability and Nearshoring Gains The **S&P/BMV IPC** index in Mexico has accumulated a gain of nearly **18%** this year, currently trading around the **71,436** level. The market is benefiting from the "nearshoring" trend and the stabilization of trade rhetoric within the USMCA framework. While IPO activity remains cautious, the inclusion of **BMV IPC futures** on global exchanges has increased international visibility. Analysts project a modest GDP recovery of **1.3%** for 2026, supported by strong consumption and manufacturing exports. Regional Economic Indicators The "LA7" economies—comprising Brazil, Mexico, Argentina, Chile, Colombia, Peru, and Ecuador—are projected to grow at an average rate of **1.9%** in 2026. Inflation across the region is expected to hover around **4.3%**. Despite some fiscal concerns in an election-heavy year, the combination of high commodity prices and shifting monetary policies continues to make the region a "stable spot" for global portfolios.

Market Spotlight: IDFC First Bank, Vedanta, Ola Electric, Bharti Airtel, and Adani Power in Focus
Indian benchmark indices concluded the recent trading session with a resilient recovery, regaining ground after previous sessions of steep losses. The S&P BSE Sensex settled higher by 316.57 points, or 0.38%, to close at 82,814.71. Simultaneously, the Nifty 50 advanced 116.90 points, or 0.46%, finishing above the psychological 25,550 level at 25,571.25. Market sentiment remains cautious as participants eye the monthly Futures & Options (F&O) expiry scheduled for February 24, 2026. Volatility is anticipated to stay elevated due to shifting global trade dynamics, particularly following a series of U.S. tariff adjustments that have seen rates fluctuate between 10% and 15%. IDFC First Bank has entered the spotlight following the disclosure of a ₹590 crore fraud at its Chandigarh branch involving Haryana Government accounts. The bank has formally appointed KPMG to conduct an independent forensic audit and has suspended four employees. A management conference call held on February 23 aimed to address stakeholder concerns regarding internal controls. Vedanta continues to see active interest, with its share price rising approximately 0.94% to settle at ₹682.45. The company recently mobilized $350 million in fresh borrowing and has scheduled a board meeting for February 25. Strong return on equity (ROE) figures of 36.36% are providing a fundamental floor despite a quarterly revenue dip. Bharti Airtel remains a high-value turnover stock, even as it faces short-term technical resistance. The telecom major reported a robust Q3 performance with consolidated revenue rising 19.6% year-on-year to ₹53,982 crore. While the stock traded near ₹1,991.9 with marginal daily losses, its long-term bias remains positive supported by a 60.4% EBITDA margin in its India business. Broader economic indicators show a mixed landscape. The HSBC India Composite PMI rose to 59.3 in February, signaling strong factory output. However, GDP growth projections for Q3 FY26 suggest a moderation to 7.2% due to a contraction in government capital spending and a slowdown in the services sector. The India VIX, a measure of market fear, rose by 6.59% to 14.35, reflecting the uncertainty surrounding geopolitical tensions and crude oil prices. Brent futures currently hover near $66 to $72 per barrel, influenced by ongoing standoffs in West Asia. These factors are expected to dictate the near-term direction of the indices.