Bullish News
Collection
Market Outlook: Resistance Near 26,000 and Support at 25,200
Market dynamics for the week of February 23, 2026, indicate a consolidation phase for the Nifty 50. The index recently closed at **25,571.25**, marking a modest weekly gain of **0.44%**. Technical structures suggest the index is navigating a tight corridor. Immediate support is established at **25,400**, with a deeper structural floor near **25,200** aligned with the 200-day exponential moving average. On the upside, **25,650** remains the primary hurdle, followed by a stronger resistance zone between **25,850** and **25,900**. Trading sentiment is influenced by a mix of domestic and global triggers. The India-US interim trade deal has provided a tailwind for export-oriented sectors, particularly electronics and textiles. However, global caution persists due to geopolitical tensions in the Middle East and a rotation out of financial stocks in international markets. **Bajaj Finance** has shown resilience, trading near **1,001** despite a recent dip in quarterly net profit. Analysts maintain a constructive view on the stock due to its compelling entry valuation. **Dixon Technologies** is currently priced around **11,072**. While it faces short-term headwinds from rising component costs, it remains a key beneficiary of the shifting trade dynamics in the electronics manufacturing space. **Bharat Electronics (BEL)** continues to draw interest at **441.15**, supported by a robust order book exceeding **700 crore** in recent contracts. This provides high revenue visibility for the current fiscal year. **Tata Steel** is trading near **208**, with price targets set by some brokerages at **240**. The outlook is supported by domestic demand and the implementation of safeguard duties that protect local pricing. **Colgate-Palmolive** and **Navin Fluorine** remain on the radar for defensive and specialty chemical plays respectively. These stocks are being monitored for stability as the broader market seeks a decisive breakout. Sectoral performance shows **Bank Nifty** outperforming the broader market with a **1.64%** weekly gain, closing near **61,000**. In contrast, the IT sector remains under pressure due to ongoing shifts in software demand and global tech sentiment. The market enters the current expiry week with a neutral to cautiously positive bias. Traders are focused on the **25,400** level as the "line in the sand." A sustained move above **25,900** is required to trigger a fresh rally toward the **26,100** milestone.
Mixed Market Outlook: Short Covering Tempered by Tariff Volatility
Indian markets open today, Monday, February 23, 2026, with a complex mix of relief and renewed geopolitical anxiety. The primary catalyst is a landmark US Supreme Court ruling that struck down President Trump’s sweeping reciprocal tariffs. This decision invalidates 18% duties previously facing 55% of Indian exports, including critical engineering goods and auto components. However, the relief was short-lived. Following the ruling, the US administration immediately proposed a new 10% global import surcharge, which was increased to 15% over the weekend. This temporary levy is expected to last 150 days, keeping trade uncertainty high for Indian exporters. Geopolitical tensions between the US and Iran have emerged as a significant headwind. Reports of a US military buildup in the Middle East have pushed Brent crude prices toward $71.48 per barrel. As India imports nearly 80% of its oil, and with 40% of energy supplies transiting through the Strait of Hormuz, these tensions pose a direct threat to domestic inflation and fiscal stability. Domestic indices entered the session following a volatile week where the Nifty 50 held near 25,571 and the Sensex hovered around 82,814. While PSU banks and energy stocks gained over 2.4% last week, the IT sector remains under pressure due to global tech spending concerns. Investors are closely monitoring the Indian rupee, which has found some support from recent foreign inflows but remains sensitive to the strengthening US dollar and rising oil prices. Market sentiment is currently defined by a "narrow range" outlook. While the removal of the 18% tariff provides a competitive boost for manufacturers, the looming 15% universal surcharge and the risk of conflict in the Middle East are expected to cap major gains. Trading today is likely to focus on stock-specific movements. Upstream oil companies like ONGC and Oil India may see interest due to higher crude realizations, while export-heavy sectors wait for clearer legal signals from Washington regarding the new 15% tariff implementation.

Investor Sentiment Toward Local IT Stocks Declines Amid AI Concerns
The Indian IT sector is navigating a period of intense volatility as of late February 2026. While broader indices like the Nifty 50 have shown resilience, the Nifty IT index has faced a significant correction, dropping approximately **16%** over the past month. This downturn has pushed the index nearly **30%** below its all-time highs recorded in late 2024. Market sentiment is currently dominated by bearish positioning. Traders have significantly increased short bets, evidenced by a surge in open interest in IT stock futures. This trend is largely driven by fears that rapid advancements in generative and agentic AI tools could disrupt traditional service delivery models. In the first half of February 2026 alone, Foreign Institutional Investors (FIIs) offloaded over **₹10,950 crore** from the sector, reallocating capital toward pure-play AI firms listed in the US. Despite the immediate price pressure, a shift in revenue structure is becoming visible. AI-centric engagements now account for nearly **74%** of all new contracts signed over the last six quarters. Major players like TCS and Infosys are reporting significant traction, with TCS reaching an annualized AI services revenue of **$1.8 billion**. HCLTech also recently crossed the **$15 billion** annual revenue milestone, bolstered by AI-led engineering innovations. Valuations have become a focal point for long-term investors. The sector's Price-to-Earnings (P/E) ratio has moderated to **22.1x**, falling slightly below its 10-year historical average of **21.6x**. Analysts suggest this correction may be nearing a cyclical bottom. While revenue growth for large-cap firms is projected at a modest **4.5% to 6%** for the upcoming fiscal year, the transition from labor-intensive "effort" to value-based "outcomes" is expected to support margins in the long run. Domestic IT spending in India remains a bright spot, projected to reach **₹15.14 lakh crore** (approximately **$176 billion**) by the end of 2026. This growth is fueled by massive investments in data center expansion and local AI infrastructure. Additionally, the government has allocated **₹2,000 crore** in the latest budget to further accelerate national AI adoption. Looking ahead, the market is closely monitoring upcoming contract expiries for signs of short covering. While the immediate outlook remains cautious due to global macroeconomic uncertainty and the evolving AI landscape, the robust deal pipeline—with median year-on-year growth of **26%**—indicates that demand for digital transformation remains intact. The sector is increasingly viewed as undergoing a structural evolution rather than a terminal decline.

US Supreme Court Tariff Ruling: India's Market Positioning and Economic Outlook
In a landmark 6-3 decision on February 20, 2026, the US Supreme Court struck down the administration’s sweeping reciprocal tariffs. The court ruled that the use of the International Emergency Economic Powers Act (IEEPA) to bypass Congress was an overreach of presidential authority. The ruling effectively nullifies the aggressive 50% duties previously imposed on major trading partners, including India. This legal shift has immediately removed roughly $133 billion in annual duties from the global trade balance, creating a temporary vacuum in US trade policy. The White House responded within 24 hours by invoking Section 122 of the 1974 Trade Act. This move establishes a new 15% global tariff aimed at addressing the national balance-of-payments deficit. Unlike the previous regime, this emergency measure is legally capped at 15% and is valid for only 150 days without explicit congressional approval. Markets view this as a significant reduction from the prior 50% peak, offering a period of relative relief for global exporters. For India, the impact is notably positive. While the 15% global surcharge applies, recent bilateral negotiations have further cushioned the blow. Following a fresh trade framework, many Indian exports now face an effective rate of approximately 18%, down sharply from the previous 50% level. Emkay Global estimates that when accounting for sector-specific exemptions in pharmaceuticals, gems, and high-tech components, India’s aggregate effective tariff burden sits between 11% and 13%. Key Indian export sectors, particularly textiles, leather, and engineering goods, are expected to see an immediate recovery in competitiveness. The removal of the 25% "punitive" surcharge—previously tied to geopolitical oil purchases—is seen as a major diplomatic win for New Delhi. Analysts have observed a sharp rally in Indian export-oriented stocks, with benchmark indices like the Nifty and Sensex showing strong gains as trade predictability returns. Global trade remains in a state of high-speed recalibration. While the 15% surcharge is currently active, the administration is simultaneously launching Section 301 and Section 232 investigations. These alternative legal paths could lead to more durable, sector-specific tariffs on automobiles, steel, and semiconductors by late 2026. For now, the 150-day window under Section 122 provides a critical breather for global supply chains to reorganize. Investors and corporate trade departments are pivoting toward "trade diversion" strategies to mitigate future volatility. The focus is shifting toward reinforcing bilateral agreements and securing product-level exemptions. Although the immediate "tariff shock" has eased, the transition from emergency executive orders to congressional-dependent trade law suggests a more litigious and complex environment for the remainder of the year.

Ten Key Factors Likely to Influence Indian Stock Market Performance on Monday
Market Brief: Equity and Economic Pulse Indian benchmark indices demonstrated resilience during the final trading session of the week, overcoming initial morning slumps to finish in positive territory. The **Nifty 50** climbed **116.90 points** to settle at **25,571.25**, while the **BSE Sensex** rose **316.57 points** to end at **82,814.71**. This recovery followed a significant mid-week correction where the Sensex had plummeted over **1,200 points** in a single day. Market volatility remains a primary concern for traders, as evidenced by the **India VIX** jumping **6.7%** to hover near the **14.36** mark. This spike reflects heightened anxiety regarding geopolitical tensions in the Middle East and uncertainty surrounding global trade policies. Analysts currently expect the Nifty to oscillate within a support-resistance range of **25,300 to 25,800** in the immediate term. Sectoral Performance and Global Triggers Sectoral trends showed a clear rotation toward domestic cyclicals and industrials. **Nifty Metal** and **PSU Bank** indices led the gains, with the metal sector buoyed by news of potential easing in U.S. steel tariffs. **Tata Steel** surged **2.9%**, while **Hindustan Unilever** gained **1.8%** to support the FMCG segment. Conversely, the **IT sector** lagged as investors booked profits, with **Infosys** and **HCL Tech** seeing declines of over **1%**. Global markets provided a mixed but ultimately supportive backdrop. U.S. and European indices closed higher, largely boosted by a landmark **Supreme Court ruling** that struck down certain administrative tariffs, easing fears of immediate trade wars. However, escalating tensions between the **U.S. and Iran** have kept crude oil prices near **$70 per barrel**, maintaining pressure on India’s trade deficit and rupee, which is trading around **90.98** per dollar. Macro-Economic Indicators India continues to hold its position as the fastest-growing major economy, with real **GDP growth estimated at 8.2%** for the most recent quarter. Manufacturing and services remain the primary engines, growing at **9.1%** and **9.2%** respectively. Inflation has shown cooling trends, with **CPI easing toward 1.7%** in early 2026, though food prices remain a variable that the RBI is monitoring closely. Investment-led growth is a central theme following the **Union Budget 2026**, which earmarked **₹10 lakh crore** for infrastructure and green energy. While the initial market reaction to new derivative taxes was negative, the focus has shifted to long-term capital expenditure and the landmark **India-U.S. trade agreement**, which is expected to boost textile and electronic exports. Liquidity and Investor Sentiment The market structure has seen a notable shift in participation. While **Foreign Institutional Investors (FIIs)** have remained cautious due to a strong dollar, **Domestic Institutional Investors (DIIs)** continue to provide a floor to the market through consistent SIP inflows. The total market capitalization of BSE-listed firms now stands at approximately **₹467 lakh crore**, reflecting a surge of **₹2 lakh crore** in investor wealth during the last session alone. Upcoming triggers for the week ahead include **RBI policy commentary**, **Nvidia’s earnings** globally, and high-frequency data such as vehicle sales and GST collections. Analysts suggest a "buy-on-dips" strategy as the broader structural narrative remains intact despite short-term global headwinds.

Monday Stock Outlook: Two Trading Ideas with Target Returns Up to 16%
Market Brief: Nifty Technical Outlook The Nifty 50 is currently navigating a pivotal consolidation phase. After experiencing significant volatility earlier in February, the index has established a reliable base around its previous swing lows. As of February 22, 2026, the index remains in a rebuilding phase, attempting to reclaim momentum. Key Price Levels and Technicals The Nifty closed its most recent active session at **25,571.25**, marking a gain of **0.46%**. This recovery followed a brief dip where the index tested intraday lows near **25,379.75**. On the technical front, the **21-period Exponential Moving Average (EMA)** is acting as a formidable immediate resistance. This level is currently hovering near the **25,671** mark. A decisive close above this EMA is essential for the bulls to shift the short-term bias from "sell-on-rise" to a more sustainable uptrend. Immediate support is firmly placed in the **25,400 – 25,300** zone. Market participants are watching this range closely; a breakdown here could expose the index to the **200-day EMA** near **25,100**, which serves as a critical long-term structural floor. Volatility and Sentiment Indicators Market sentiment is characterized by "volatility compression." The **India VIX** recently cooled by over **1.70%** to settle around **13.10**, suggesting that the aggressive swings seen post-budget are beginning to subside. The **Put-Call Ratio (PCR)** stands at **1.22**, indicating a slightly overbought but generally stable derivative structure. Traders are observing maximum Call Open Interest at the **26,000** strike, which is expected to be the next major psychological hurdle if the **21-EMA** is breached. Economic Catalysts and Sector Trends Macroeconomic data remains supportive of the underlying domestic strength. The **HSBC India Composite PMI** rose to **59.3** in February, the highest level since November, driven by robust factory output and new orders. Sectoral performance shows a clear rotation: * **Metals & PSU Banks:** Leading the recovery with gains exceeding **1.3%**. * **FMCG:** Showing resilience with heavyweights like **Hindustan Unilever** rising **1.83%**. * **IT Sector:** Currently the primary laggard, facing persistent selling pressure and dragging on the broader index. External factors, including the potential easing of U.S. steel tariffs and the influx of foreign investments, are providing a tailwind to the metal and financial sectors, helping the Nifty maintain its ground above key support levels.

Nvidia and Software Earnings to Test AI-Driven Market Stability
Market sentiment remains fragile as investors shift their focus to the upcoming financial results of artificial intelligence bellwether Nvidia Corp, scheduled for February 25. The semiconductor leader is widely seen as the primary anchor for a U.S. stock market recently unsettled by AI-related growth concerns and political volatility. Nvidia is expected to report earnings-per-share of $1.51 on revenue of $65 billion. This follows a record-breaking performance in late 2025, where the company saw revenue surge 62% year-on-year to $57 billion. Despite these massive figures, the stock has traded sideways in early 2026, currently hovering near $189. Analysts remain bullish, with average 12-month price targets sitting at $255, implying an upside of nearly 39%. The broader market is currently digesting a major legal reversal from the U.S. Supreme Court. On February 20, the Court overturned President Donald Trump’s sweeping trade tariffs imposed under the International Emergency Economic Powers Act. The 6-3 ruling declared that the President lacks the statutory authority to unilaterally impose such taxes, a power reserved for Congress. The judicial decision provided an immediate boost to global trade sentiment, yet market reaction remains mixed. While the ruling removes a major tool for executive trade action, the administration quickly responded by signing a new 10% global duty under different legislative authorities, set to take effect on February 24. Current economic indicators add further pressure to the trading environment. January's Consumer Price Index rose 0.2%, while core PCE inflation reached 3% annually, slightly above the Federal Reserve’s targets. Furthermore, fourth-quarter GDP growth for 2025 slowed to 1.4%—nearly half of the expected rate—largely due to the impact of the recent government shutdown. Volatility in the tech sector has been fueled by new AI tool releases from competitors like Anthropic, which have sparked fears of disruption in knowledge-based industries like finance and software. The Nasdaq Composite recently saw a weekly decline of 0.2% as investors reassessed the sustainability of massive AI capital expenditures, which are projected to reach $200 billion for Amazon and up to $185 billion for Alphabet this year. Investors are looking to Nvidia’s guidance on its new Blackwell chip demand to determine if the AI narrative can regain its momentum. A strong double beat on earnings and revenue is considered essential to restore confidence in high-growth tech valuations and steady the broader indices.

Radhavi Deshpande: REITs and InvITs to Increasingly Drive Portfolio Returns
Market dynamics for 2026 reflect a strategic transition toward yield-bearing assets and earnings-driven equity growth. Real Estate Investment Trusts (REITs) and Infrastructure Investment Trusts (InvITs) have emerged as cornerstone instruments, significantly outperforming broader indices in 2025 with total returns of 25.48%. These hybrid vehicles are increasingly favored for their ability to provide stable cash flows and an inherent inflation hedge. Regulatory reforms effective January 1, 2026, which reclassified REITs as equity-related instruments, are expected to catalyze deeper institutional participation and improve market liquidity throughout the year. The fixed income landscape remains anchored by a calibrated pause from the Reserve Bank of India. Following a cumulative reduction of 125 basis points in 2025, the repo rate has stabilized at 5.25% as of February 2026. Investors are currently navigating a neutral policy stance where the 10-year G-sec yield is hovering near 6.67%. The focus has shifted toward asset-liability matching and locking in yields before the next potential phase of the rate cycle. Corporate bond markets are also gaining depth through new frameworks for market-making and bond-index derivatives introduced in the latest budget. Equity markets for FY27 are characterized by a "quality over momentum" approach. Earnings growth is projected to be the primary engine of returns, with aggregate profits for top companies forecast to accelerate to 27.4% in FY27. Large-cap financials remain a dominant pillar, contributing nearly 40% of index earnings while benefiting from credit growth and healthy balance sheets. Industrials and the consumption sector are also poised for a rebound. Industrials are supported by a massive infrastructure capex pipeline of ₹15–25 trillion, while consumption is seeing a revival led by rural demand growth of 8.4%, outpacing urban centers. Strategic allocation now prioritizes capital efficiency and risk-adjusted returns. Market participants are moving away from liquidity-driven rallies toward selective opportunities in companies with high cash flow visibility and resilient operating margins. This fundamental-driven environment rewards execution and earnings delivery over speculative trends. [Understanding Indian REITs](https://www.youtube.com/watch?v=qS0_Lh3fHvI) This video provides an overview of how REITs and InvITs have performed compared to traditional indices and why they are becoming a preferred choice for stable income in India. http://googleusercontent.com/youtube_content/0

US Market | Seth Klarman’s Strategies for Navigating Market Volatility
Market dynamics are undergoing a structural shift as the era of easy liquidity gives way to trade volatility and geopolitical realignment. For the thoughtful investor, the core tenets of value investing—capital preservation and a strict margin of safety—have moved from the background to the center of portfolio strategy. **The Seth Klarman Blueprint** In an environment characterized by erratic policy shifts, Seth Klarman’s approach at Baupost Group offers a stabilizing framework. Klarman continues to emphasize that risk is not just a number, but the potential for permanent capital loss. Recent filings show a disciplined rotation into resilient sectors. His top holdings now include **Restaurant Brands International (10.4%)**, **Amazon (9.3%)**, and **Willis Towers Watson (8.5%)**. Notably, Klarman has significantly reduced exposure to high-flying tech, cutting his Alphabet stake by over **41%**. This move underscores a pivot toward businesses with tangible assets and reliable cash flows, typically holding cash reserves as high as **30% to 50%** to wait for "the perfect pitch." **The US-India Trade Reset** A major breakthrough in bilateral relations has significantly altered the trade landscape. US tariffs on Indian goods, which had spiked to punitive levels of **50%** in late 2025 due to disputes over oil sourcing and reciprocal duties, have been slashed to an effective rate of **18%** as of February 2026. This de-escalation follows a high-level agreement where India committed to purchasing **$500 billion** in US goods over five years, focusing on energy, technology, and agriculture. This policy pivot has immediately boosted export-heavy sectors that were previously bracing for a **70%** collapse in US-bound volumes. **Sectoral Impact and Market Reactions** The reduction in tariffs has triggered a relief rally across the Indian markets. The **Nifty Pharma Index** jumped over **4.5%**, led by gains in Aurobindo Pharma (**+5.7%**) and Divi’s Labs (**+4.2%**). While pharma was largely exempt from the harshest duties, the new 18% framework provides the long-term pricing clarity needed for generic drug manufacturers to maintain their **11%** share of the total US trade basket. The **Nifty IT Index** also surged by **5.5%**, reflecting optimism that stabilized trade relations will support discretionary spending from US clients, who provide over **60%** of the sector's revenue. In contrast, labor-intensive sectors like textiles, gems, and jewelry are in a recovery phase. These industries, which faced the highest exposure under the previous **50%** regime, are now regaining competitiveness against Asian peers like Vietnam and Bangladesh. **Strategic Takeaway** The current market demands a blend of opportunistic growth and defensive caution. While the tariff reduction to **18%** removes a massive overhang on Indian equities, the broader lesson remains one of discipline. By prioritizing a margin of safety and maintaining liquidity, investors can navigate the "unpredictable art" of valuation in a world where trade policy can shift overnight.
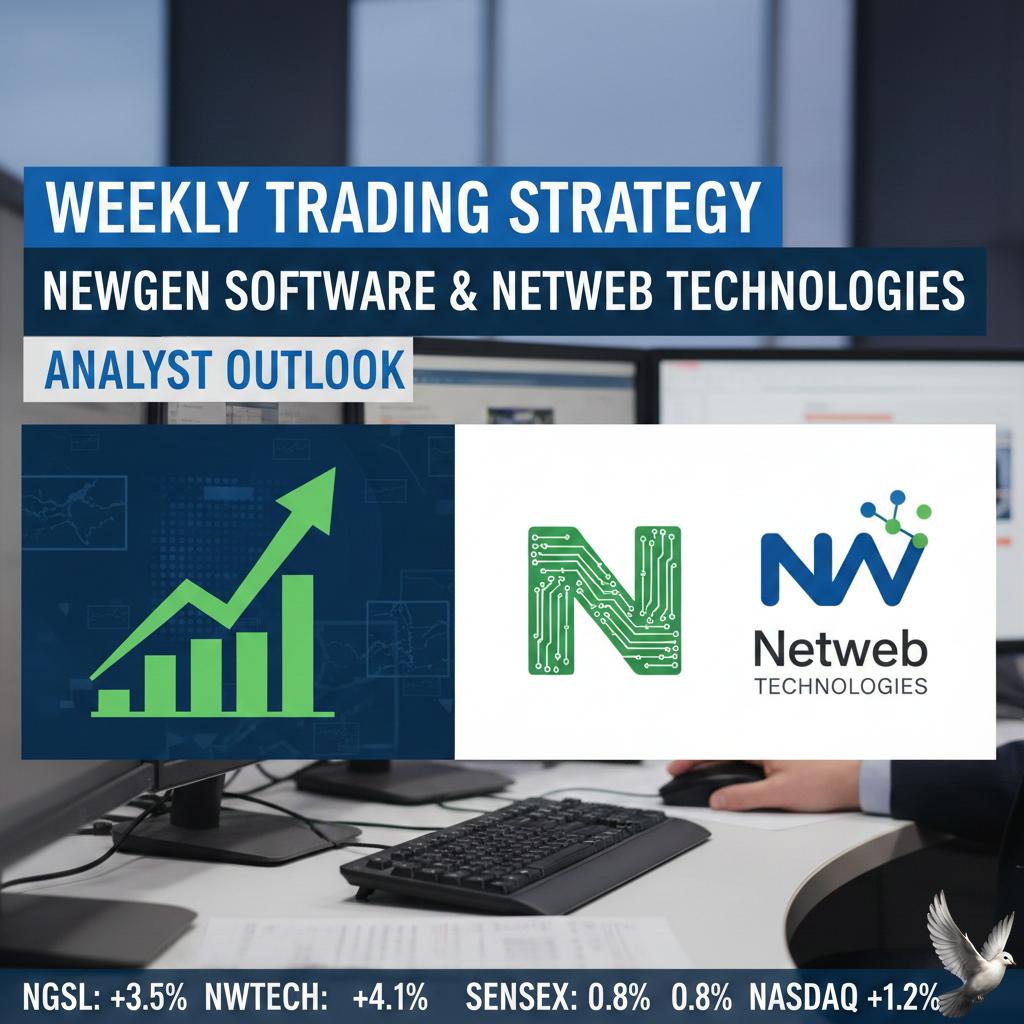
Weekly Trading Strategy for Newgen Software and Netweb Technologies: Analyst Outlook
Market performance across the Indian equity landscape has shown distinct divergence as of late February 2026. While the primary indices grapple with range-bound volatility, high-growth mid-cap and tech stocks continue to demonstrate localized strength. Newgen Software and Netweb Technologies emerged as notable outperformers in the Nifty 500 universe. Netweb Technologies recently surged over 17% across three trading sessions, reaching a high near 3,751.00 on February 20. This momentum is attributed to surging delivery volumes and the launch of new AI infrastructure solutions. Newgen Software also witnessed a sharp weekly rally of 16%, though it faced profit-booking on the final trading day of the week, closing at 556.90. The Nifty 50 is currently navigating a period of consolidation. After slipping from highs earlier in the month, the index closed near 25,571. Immediate structural support is established at the 25,400–25,380 zone. A breach below this floor could expose the 25,250 level, while resistance is firmly placed at 25,700 and 25,850. BankNifty displays relative technical resilience, maintaining a position above the 60,500 demand zone. The index settled the most recent session at 61,172.00, marking a 0.71% recovery. Key resistance for the banking sector remains in the 61,400–61,700 cluster, which aligns with recent all-time high supply zones. Market volatility, measured by the India VIX, has signaled elevated nervousness. The index spiked 6.69% to settle at 14.36, indicating that traders are pricing in higher premiums for risk protection in the near term. This shift suggests a cautious approach is prevailing despite the underlying bullish structure of the broader markets. Individual stock setups remain a core focus for market participants. KEI Industries showed strong movement, with its stock futures surging over 4% to trade near 4,782.60. Triveni Turbine continues to hold a constructive technical posture, trading at 490.20 with an RSI near 45, following a year of healthy order bookings. Global factors, including divided opinions within the US Federal Reserve regarding interest rate paths and fluctuating crude prices near $71.90, have contributed to inconsistent FII flows. Conversely, domestic institutional support remains a critical cushion for local benchmarks.

Aswath Damodaran Expresses Investment Preference for Anthropic Over OpenAI
Market Brief: AI Titans and the Great Software Reset The competitive landscape between OpenAI and Anthropic has reached a historic fever pitch in early 2026. Private market valuations for the two leaders now exceed a combined **$1.2 trillion**, reflecting a decoupling of AI ventures from broader SaaS market trends. The Valuation Divergence OpenAI is currently pursuing a massive **$100 billion** funding round, targeting a staggering valuation between **$750 billion** and **$830 billion**. This follows a cumulative capital burn projected to reach **$44 billion** by 2029. Secondary market data as of late February 2026 lists OpenAI’s implied share price at approximately **$723.12**. Anthropic recently closed its own **$30 billion** Series G round, catapulting its valuation to **$380 billion**. Despite the gap in scale, Anthropic is demonstrating superior monetization efficiency. The company hit a **$14 billion** revenue run rate in February 2026, scaling from just **$1 billion** only 14 months ago. The "SaaSpocalypse" and Global Sell-offs A structural shift occurred in late January 2026 with the release of the Claude Cowork platform and 11 specialized enterprise plugins. These tools, designed to autonomously handle legal, financial, and coding tasks, triggered a sharp global market correction. * **$285 billion** in market value was erased from software and services stocks in a single session. * India’s Nifty IT index plunged **6%** on February 4, 2026, its steepest drop since 2020. * Giants like Infosys and TCS saw single-day declines of **7.4%** and **7%** respectively. * Legal tech leaders like Thomson Reuters and RELX fell as much as **15%**. Strategic Sentiment and Leadership Valuation authority Aswath Damodaran has expressed a tactical preference for Anthropic over OpenAI for potential public inclusion. His thesis centers on leadership dynamics rather than raw technical metrics. Damodaran suggests that Anthropic’s management demonstrates a higher capacity for adaptive learning compared to the "ego-driven" leadership at OpenAI. While both firms carry heavy premiums, investors are increasingly weighing corporate governance and "outcome-based" models against the traditional "headcount-based" models of legacy software providers. Productivity and Job Market Impact The rapid transition to agentic AI—systems that execute work rather than just assisting—has moved from theory to market reality. Anthropic's CEO recently noted that advanced AI could fundamentally disrupt white-collar professional services within the next few years. This sentiment is driving a "valuation reset" across the global IT sector. Investors are no longer valuing software firms on stable outsourcing contracts, but on their ability to integrate or survive the shift to autonomous AI agents.

Market Outlook: Potential Volatility and Reactions to Shift in U.S. Tariff Policy
Indian markets enter the final week of February 2026 facing a major shift in the global trade landscape. Following a landmark U.S. Supreme Court ruling on February 20 that struck down high reciprocal tariffs, the U.S. administration has swiftly moved to a new 10% global baseline tariff. Domestic indices ended the previous session on a positive note, but investors are now recalibrating for Monday's opening. The Nifty 50 closed near 25,571 while the Sensex settled at 82,814. Despite the underlying strength in financials and PSU banks, the export-oriented IT and pharmaceutical sectors are expected to see heightened volatility as the legal and fiscal implications of the new U.S. trade regime become clearer. The effective average tariff on Indian exports is now estimated at approximately 13.4%. While this is a significant reduction from the earlier proposed 18% to 25% range, the new 10% surcharge remains a hurdle for high-volume sectors. The textiles and apparel industries remain particularly wary. The U.S. is the largest destination for Indian garment exports, and although the recent court ruling provides some legal relief, the 10% surcharge under Section 122 of the Trade Act of 1974 is set to begin on February 24. This temporary measure is slated for 150 days, creating a short-term window of uncertainty for order pricing and profit margins. The pharmaceutical and electronics sectors may find themselves more competitive under the reduced 10% rate compared to previous reciprocal threats. However, specific duties on steel and aluminum remain high at roughly 50% under national security provisions, which were not affected by the recent court decision. Currency markets are also under pressure, with the Rupee trading near the 90.98 level against the Dollar. A weaker currency may provide a cushion for exporters, but it also adds to the cost of imported raw materials and energy. Brent crude prices have recently spiked toward $72, further complicating the inflation outlook. The Indian government is currently studying the legal details of the U.S. court verdict. Discussions regarding the Interim Trade Deal—originally based on an 18% reciprocal rate—may now require a full realignment. Market participants are watching for official statements from the Commerce Ministry to gauge if India will modify its own commitments on U.S. agricultural and industrial goods in response to these changes. Short-term market sentiment will likely be driven by sector-specific reactions. While the broader indices show resilience, the "wait-and-watch" mode prevailing in New Delhi and Washington suggests that a period of consolidation is probable before a new trend emerges.

Six of Top 10 Firms Gain Rs 63,000 Crore in Market Capitalization, Led by L&T and SBI
Market Brief: Top Indian Firms Valuation Update The combined market valuation of six of India’s top-10 most valued companies rose by **Rs 63,478.46 crore** last week. This growth occurred as the 30-share BSE Sensex edged higher by **187.95 points**, or **0.22%**, to close at **82,814.71**. Infrastructure and Banking Lead Gains **Larsen & Toubro (L&T)** emerged as the week's top performer. Its market capitalisation surged by **Rs 28,523.31 crore**, bringing its total valuation to **Rs 6,02,552.24 crore**. The stock recently hit an all-time high, supported by new infrastructure projects in the UAE and strategic expansions into data centers. **State Bank of India (SBI)** also secured significant gains, adding **Rs 16,015.12 crore**. The lender's total market value now stands at **Rs 11,22,581.56 crore**. Investor sentiment was bolstered by the bank's robust quarterly performance and the announcement of a **$1.5 billion IPO** for its funds management arm scheduled for March. Other Notable Gainers * **HDFC Bank:** Valuation increased by **Rs 9,617.56 crore** to **Rs 14,03,239.48 crore**. * **LIC:** Market cap rose by **Rs 5,977.12 crore** to reach **Rs 5,52,203.92 crore**. * **Bajaj Finance:** Added **Rs 3,142.36 crore**, taking its valuation to **Rs 6,40,387 crore**. * **Reliance Industries:** Saw a marginal increase of **Rs 202.99 crore**, maintaining its lead at **Rs 19,21,678.78 crore**. Tech and Telecom Facing Pressure In contrast, four major firms saw their market values decline. **Bharti Airtel** experienced the sharpest drop, with its valuation tumbling by **Rs 15,338.66 crore** to **Rs 11,27,705.37 crore**. **ICICI Bank** followed with a loss of **Rs 14,632.10 crore**, bringing its market cap down to **Rs 9,97,346.67 crore**. The IT sector also remained under pressure due to global tech volatility. **Infosys** saw its valuation decline by **Rs 6,791.58 crore**, while **Tata Consultancy Services (TCS)** also recorded a dip in its total market worth. Macro Outlook and Currency The Indian Rupee showed slight appreciation, closing at **90.66** against the US Dollar. While domestic indices showed resilience, market participants remain cautious due to global geopolitical tensions and upcoming Q3 GDP data. Analysts currently note a "buy-on-dips" sentiment as the Nifty 50 maintains its position above the **25,500** level.

Nine IPOs Launch This Week with Projected Grey Market Returns Up to 36%
The Indian primary market is entering a high-velocity phase as **nine IPOs** prepare to launch this week, covering both the mainboard and SME segments. This surge comes as part of a projected **₹24,000 crore** fundraising pipeline for February 2026, signaling a strategic attempt by corporations to capture liquidity despite a cautious start to the year. The mainboard is led by the **₹3,100 crore** Clean Max Enviro Energy Solutions issue, opening February 23 with a price band of **₹1,000 to ₹1,053**. Other key entrants include Shree Ram Twistex (**₹110.24 crore**), PNGS Reva Diamond Jewellery (**₹380 crore**), and Omnitech Engineering (**₹583 crore**). These offerings span critical sectors from renewable energy and textiles to luxury retail and specialized engineering. Investor sentiment remains measured following a 2025 cycle where over half of the **103 mainboard listings** eventually traded below their issue price. Currently, the Nifty 50 and Sensex are navigating a minor correction, down approximately **1.2%** and **1.7%** respectively for the year. This macro backdrop has shifted the focus toward "reasonable pricing," as aggressive valuations in previous months led to muted listing gains. Grey Market Premiums (GMP) are currently reflecting this selective appetite. While Clean Max Enviro shows a marginal premium of **0.28%**, other counters like PNGS Reva Diamond Jewellery are seeing stronger unofficial interest at roughly **5.4%**. In contrast, the SME segment continues to produce standout outliers; Accretion Nutraveda recently delivered a significant **48.06%** listing gain, highlighting a clear divergence in risk appetite between small-cap speculators and mainboard institutional players. Secondary market volatility is also influencing subscription trends. While recent issues like Bharat Coking Coal saw a massive **147x** subscription, others like Aye Finance and Fractal Analytics have faced a "flat" reception, listing at or near their issue price. Investors are closely monitoring the **₹10.7 lakh crore** total resource mobilization target for the fiscal year. With high-profile names like Reliance Jio and Zepto in the 2026 pipeline, the success of this week’s nine-issue cluster will serve as a vital litmus test for the market's capacity to absorb large-scale equity dilutions in a range-bound environment.

Top 10 Penny Stock Performers of FY26 Including Four Multibaggers
Market Brief: FY26 Penny Stock Performance The Indian equity landscape in **FY26** has witnessed a sharp divergence between benchmark stability and micro-cap volatility. While the **Nifty 50** remains positioned near the **25,800** mark and the **SENSEX** hovers around **83,700**, the penny stock segment has delivered outsized returns for risk-tolerant participants. Recent market data confirms that **10** specific penny stocks have surged between **50% and 205%** during this fiscal year. Among these high-momentum plays, **four** have officially attained **multibagger** status, more than doubling investor capital in less than twelve months. Top Performers and Multibagger Gains The rally is led by a mix of infrastructure, textile, and technology-focused small caps. **Garment Mantra Lifestyle** has emerged as a standout performer with an **88%** gain in **FY26**, while **Silverline Technologies** followed closely with a **73%** climb. Other notable movers include **Shish Industries** and **Pro Fin Capital Services**, both recording gains of approximately **66%**. The surge in these low-priced equities is largely attributed to localized triggers such as debt reduction, capacity expansion, and a broader shift in retail interest toward undervalued segments. For instance, **Excel Realty N Infra** has posted a **51%** return, driven by renewed sentiment in the affordable housing and infrastructure ancillary space. High-Volume Turnaround Candidates Beyond the top percentage gainers, heavyweights in the sub-**₹100** category continue to dominate trading volumes. **Yes Bank** (trading near **₹22.70**) and **Vodafone Idea** (around **₹9.00**) remain central to retail portfolios. These stocks have seen significant price action, with **Vodafone Idea** delivering over **22%** returns in the last six months as capital restructuring efforts progress. **Suzlon Energy** and **IDBI Bank** have also maintained their positions as high-value "penny-to-mid" transitions. **Suzlon**, currently priced around **₹53**, has benefited from the massive domestic push for renewable energy, while **IDBI Bank** (trading at **₹93.90**) is being tracked for its potential privatization and improving asset quality. Sectoral Trends and Market Breadth The current market breath remains mixed but constructive. While the broader indices faced a sharp **1.4%** correction on **February 19, 2026**, due to geopolitical tensions, the recovery in PSU banks and metals has provided a cushion for smaller stocks. **Nifty PSU Bank** has seen gains of **2.1%**, aiding low-priced banking stocks like **South Indian Bank** and **Central Bank of India**. Investors are increasingly focusing on "fundamentally strong" penny stocks. Companies such as **Trident Ltd** and **Nandan Denim** are gaining traction due to improved operational margins and lower debt-to-equity ratios. **Trident**, in particular, remains a favorite for its consistent dividend yield of **2.73%**, a rarity in the penny segment. Risk and Liquidity Observations Despite the triple-digit gains seen in the top **10** picks, liquidity remains a primary concern. Many stocks surging over **100%** operate on low daily volumes, which can lead to rapid price reversals or difficulty in exiting large positions. The **India VIX** has moved higher recently, signaling increased near-term volatility that typically impacts the penny segment more aggressively than large-cap benchmarks.

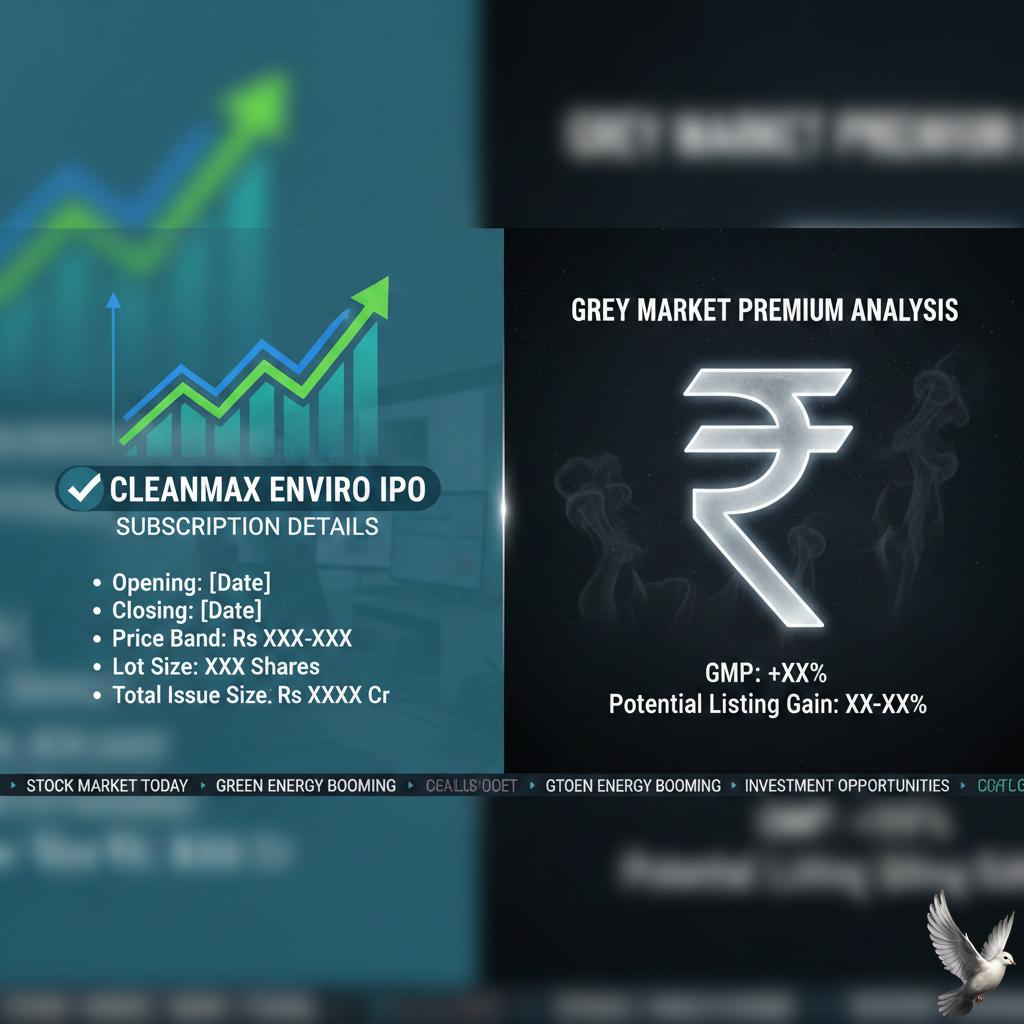
CleanMax Enviro IPO: Subscription Details and Grey Market Premium Analysis
Clean Max Enviro Energy Solutions is set to launch its ₹3,100 crore Initial Public Offering on February 23, 2026. The issue arrives during a pivotal week for the Indian primary market, with nine public offers hitting the exchanges. Despite the scale of the company as India’s largest commercial and industrial renewable provider, early sentiment remains cautious. The price band for the issue is fixed between ₹1,000 and ₹1,053 per share. Investors must apply for a minimum lot of 14 shares, requiring an entry-level investment of ₹14,742. The offering is a mix of a ₹1,200 crore fresh issue and a ₹1,900 crore offer for sale by existing shareholders. Grey market activity suggests a conservative debut. The current Grey Market Premium (GMP) is approximately ₹7 to ₹9 per share, indicating a potential listing gain of less than 1%. This muted response follows a recent dip in premium from ₹14, reflecting a "wait-and-watch" approach from market participants. The company’s financial profile shows a significant recovery, having turned profitable in FY25 with a net profit of ₹19.43 crore. This is a sharp reversal from the ₹59 crore loss recorded in FY23. Revenue also climbed to ₹1,610 crore in the same period, supported by a massive operational and managed capacity of 2.80 GW. Debt management is the central theme of this IPO. As of September 2025, total borrowings stood at ₹10,121 crore. The company plans to deploy roughly ₹1,123 crore—over 93% of the fresh issue proceeds—specifically to repay or prepay existing debt. This deleveraging strategy is critical to reducing interest costs and improving future margins. Strong institutional support provides a cushion to the retail caution. Clean Max successfully raised ₹921 crore from anchor investors on February 20, 2026. High-profile names including Temasek, Abu Dhabi Investment Authority (ADIA), and Tata Investment Corporation participated, signaling long-term confidence from global and domestic funds. Broad market trends are also playing a role. The renewable sector recently gained momentum following a landmark US-India trade deal that slashed solar export tariffs from 50% to 18%. Additionally, domestic demand for green energy in the industrial sector is surging, with rooftop solar additions rising 72% over the past year. Subscription for the IPO closes on February 25, 2026. Allotment is expected by February 26, with the shares tentatively scheduled to list on the BSE and NSE on March 2, 2026. While the high debt and premium P/E valuation are points of scrutiny, the company’s 22-year average contract tenure with blue-chip clients like Google and Amazon offers long-term revenue visibility.
CleanMax Enviro IPO: Subscription Details and Grey Market Premium Analysis
Clean Max Enviro Energy Solutions is set to launch its 3,100 crore IPO on Monday, February 23, 2026. The price band is established between 1,000 and 1,053 per share. This public offering arrives during a pivotal structural shift in India’s energy landscape, where renewable sources are projected to reach 26% of total electricity generation by the end of this fiscal year. The issue structure is split into two primary components. A fresh issue of 1,200 crore will be used to infuse new capital into the company, while an offer for sale (OFS) of 1,900 crore allows existing promoters and investors, including Brookfield-backed entities, to partially exit. Investors must bid for a minimum of 14 shares, requiring a retail investment of 14,742 at the upper price limit. Market sentiment ahead of the opening remains cautious. The Grey Market Premium (GMP) is currently hovering around 7 to 9 per share, representing a modest 0.4% to 0.8% premium. These figures suggest expectations for a flat listing. Market analysts attribute the muted premium to the company's aggressive valuation, which sits at a price-to-earnings (P/E) multiple exceeding 360x based on recent annual figures. Financial performance shows a significant turnaround. The company reported a net profit of 19.43 crore in FY25 after previous years of losses. Revenue from operations grew to 1,610 crore in the same period, supported by a 63% EBITDA margin. However, debt remains a critical focal point. Total borrowings have surged nearly threefold in three years, reaching 10,121 crore as of September 2025. Deleveraging is a core objective of this IPO. Approximately 1,125 crore from the fresh issue proceeds is earmarked for the repayment or prepayment of outstanding debt. While this move is expected to improve interest coverage and future profit margins, the remaining debt load will stay high as the company manages its 2.54 GW operational capacity and a massive 3.17 GW pipeline under contract. The company operates in the high-growth Commercial and Industrial (C&I) segment, providing green power to blue-chip clients like Google, Apple, and Amazon. Long-term power purchase agreements (PPAs) provide strong revenue visibility, with nearly 96% of contracted capacity tied to investment-grade customers. Despite these strengths, risks such as customer concentration and geographic reliance on Karnataka and Gujarat—which contribute 79% of power sales—persist. The IPO serves as a test for investor appetite in capital-intensive renewable platforms that prioritize long-term structural growth over immediate listing gains. Subscription closes on February 25, with a tentative listing date of March 2 on the BSE and NSE.

Eight Key Factors Set to Influence Indian Markets This Week
Nifty 50 concluded the trading week on a positive note, securing a modest gain of 0.46% to settle at 25,571. The index added approximately 117 points during the final session of the week, largely supported by resilience in the banking and metal sectors. The Nifty Bank index outperformed the broader market, rising 0.71% to close at 61,172. Despite the headline gains, the IT sector faced selling pressure, with the Nifty IT index sliding nearly 1% to end at 32,004. Technical indicators suggest a period of consolidation. The index is currently navigating a tight range between 25,372 and 25,885. While it remains positioned above long-term support levels like the 50-week and 100-week moving averages, immediate resistance is pegged at 25,600 and 26,000. A decisive breakout above the 26,250 mark is required to confirm a fresh upward trend. Conversely, a sustained drop below the 25,000 psychological level could invite further bearish momentum. Institutional activity showed a clear divide at the end of the week. Domestic Institutional Investors (DIIs) provided significant support with a net purchase of 2,637 crore. In contrast, Foreign Institutional Investors (FIIs) remained net sellers in the cash market, offloading 934 crore. Volatility has edged higher as the India VIX rose 6.7% to reach 14.36. This uptick indicates increased hedging activity among participants and an expectation of sharper intraday swings in the upcoming sessions. Global cues and domestic economic triggers will dictate the direction for the week ahead. Market sentiment is currently balancing a neutral Relative Strength Index (RSI) of 51.50 against a cautious derivative setup where call writing is concentrated at the 26,000 level. Key support zones to watch for are 25,400 and 25,000, while the 20-week moving average at 25,761 continues to act as a pivot for short-term price action. Investors are closely monitoring sectoral rotation, as financials and metals move into leading quadrants while infrastructure and auto show signs of weakening relative strength.
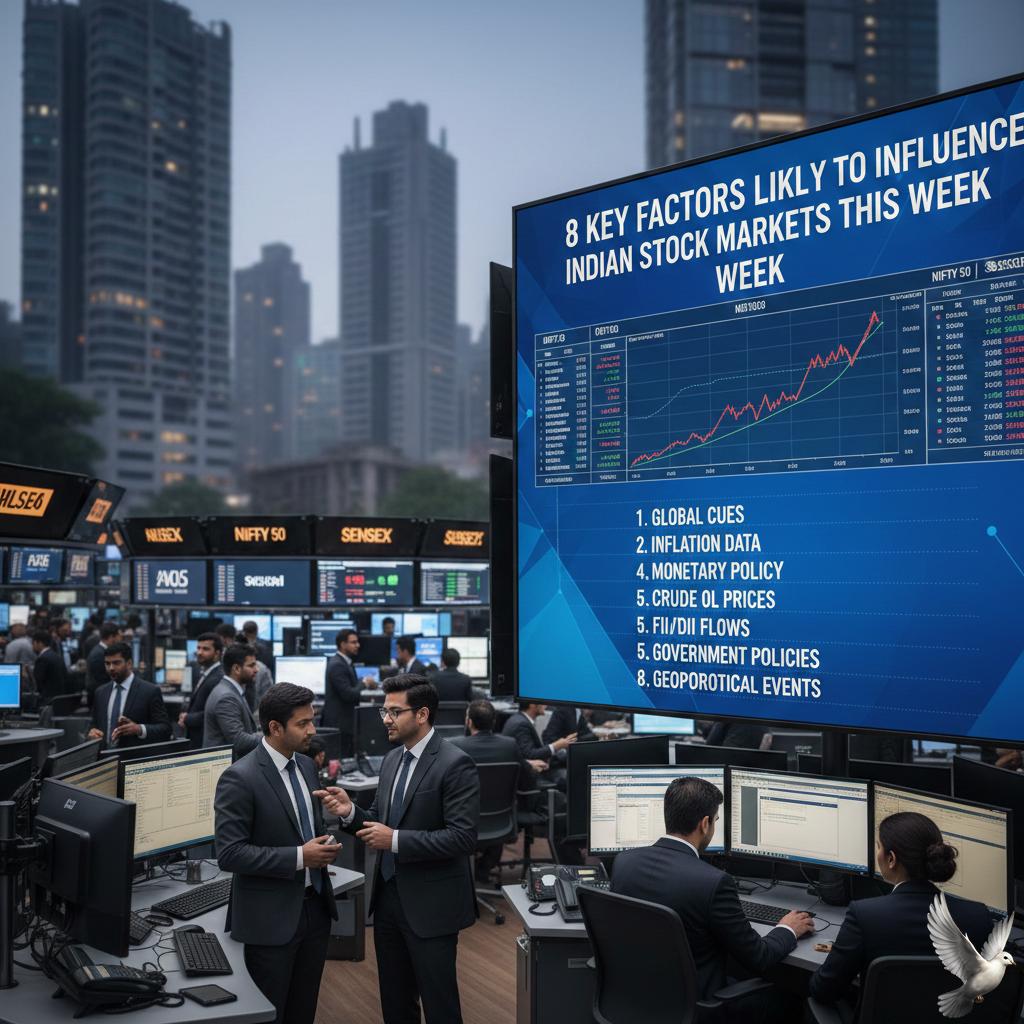
8 Key Factors Likely to Influence Indian Stock Markets This Week
Market Brief: Nifty 50 Performance & Outlook The Indian equity market demonstrated resilience as the Nifty 50 concluded the trading week on February 20, 2026, at **25,571.25**. This represents a gain of **116.90 points**, or **0.46%**, effectively reclaiming levels above the crucial **25,550** psychological mark. The recovery follows a period of sharp volatility where the index briefly dipped below **25,500** earlier in the week. Sectoral Trends and Capital Flows Financials and metals acted as the primary engines of growth. Sector-specific strength was prominent in **Nifty Metals** and **PSU Banks**, with heavyweights like Hindalco rising **3.21%** and NTPC gaining **2.64%**. Conversely, the IT sector remains a significant laggard, continuing to face pressure from global technology shifts and concerns regarding AI-related service disruptions. Foreign Institutional Investors (FIIs) have shown a notable shift in sentiment, turning net buyers in February with total equity inflows reaching **16,911.55 crore**. This reversal comes after substantial outflows in January and is supported by steady domestic institutional buying, which added over **11,400 crore** to the market this month. Technical Indicators The technical landscape remains a blend of long-term stability and short-term caution. The Nifty continues to hold above its **200-day Exponential Moving Average (EMA)**, maintaining a constructive primary trend. However, immediate hurdles are visible at the **25,600** and **25,900** zones. The Relative Strength Index (RSI) is currently hovering between **45 and 46**, signaling a lack of aggressive upward momentum. A bearish crossover in momentum indicators suggests that while the floor is well-supported near **25,300**, the index may enter a consolidative phase before attempting a fresh breakout toward the **26,100** level. Macro Triggers Market participants are shifting focus toward upcoming domestic data points, specifically the **India Q3 GDP** release. Global sentiment is being shaped by geopolitical developments and progress regarding the **India-US trade agreement**, which has already contributed to a strengthening rupee, recently quoted at **90.66** against the US dollar. Volatility as measured by the India VIX remains elevated near **13.46**, suggesting that while the broader outlook is cautiously optimistic, intraday swings are likely to persist. Investors are monitoring the **25,100–25,200** range as the primary support zone for the coming sessions.
Nifty Market Outlook: Weekly Trend and Impact of US Supreme Court Ruling
The Nifty 50 concluded the trading week ending February 20, 2026, on a resilient note, finishing at **25,571.25** with a daily gain of **116.90 points** or **0.46%**. Despite a volatile start to the week, the index reclaimed stability as buying interest returned in the final sessions. Market participants are currently digesting a landmark US Supreme Court ruling issued on Friday. The court rejected President Trump’s authority to impose certain sudden global tariffs. In response, a new **10%** temporary import surcharge was announced, set to take effect on February 24. This development has introduced a layer of caution as traders assess the long-term impact on global trade and Indian exports. Sectoral performance remained mixed but largely positive. The Power sector emerged as a leader, surging over **2%**, while the Metals index also showed strength, gaining roughly **1.3%**. Financial services and FMCG counters provided additional support. In contrast, the IT sector faced headwinds, declining nearly **1%** as investors shifted toward domestic-focused themes. Technical indicators suggest the Nifty is navigating a critical consolidation phase. Immediate support is firmly established in the **25,300 – 25,400** zone. On the upside, the index faces significant resistance at **25,800**, with a major psychological barrier at **26,000**. Analysts note that a sustained move above **25,600** is required to shift the short-term bias from neutral to decisively bullish. Institutional activity showed a notable divergence. Domestic Institutional Investors (DIIs) remained strong pillars of support, with month-to-date inflows exceeding **₹11,400 crore**. Conversely, Foreign Institutional Investors (FIIs) maintained a cautious stance, recording net sales of approximately **₹1,076 crore** so far in February. Volatility remains a key factor as the market enters the final week of the February F&O contract expiry. The India VIX is hovering around **13.33**, indicating moderate but present anxiety. Global cues, particularly fluctuating crude oil prices and the fallout from the US trade policy shifts, will likely dictate the opening momentum for the coming Monday. The broader market breadth turned positive during the final session, with over **2,200** stocks advancing on the BSE against **1,900** declines. While large-cap blue chips led the recovery, mid-cap and small-cap indices showed relative underperformance, dropping **1.22%** and **3.21%** respectively, highlighting a "flight to quality" among retail and institutional participants.