Bullish News
Collection
FIIs record Rs 16,912 crore equity inflows in February
Foreign institutional investors (FIIs) have staged a notable return to the Indian equity market in February 2026, marking a decisive shift in sentiment after a volatile start to the year. Following a massive outflow of **₹35,962 crore** in January, foreign portfolio investors (FPIs) pumped in **₹33,487 crore** during the first half of February alone. This influx represents the strongest fortnightly buying recorded since April 2025. The reversal is largely attributed to a robust Q3 corporate earnings season and a stabilizing macroeconomic environment, which has bolstered the Nifty 50 toward the **25,570** level and kept the Sensex trading near the **82,800** mark. A sharp rotation is visible as foreign capital pivots away from the technology sector and toward the real economy. Capital goods emerged as the primary beneficiary, attracting **₹8,032 crore** in the first fifteen days of the month. This surge was further supported by the government’s **₹4,470 crore** stake sale in BHEL and a positive outlook on the domestic capex cycle. Financial services have also seen a significant turnaround. After enduring selling pressure of **₹8,592 crore** in January, the sector recorded fresh inflows of **₹6,175 crore** in early February. Strong balance sheets and steady credit growth in the banking pack have revived institutional interest despite elevated valuation concerns. In contrast, the Information Technology sector remains under heavy pressure. Global investors offloaded more than **₹10,000 crore** in IT stocks during the same period, driven by fears of AI-led disruption to traditional outsourcing models. The Nifty IT index has underperformed significantly, falling nearly **15%** year-to-date. Domestic Institutional Investors (DIIs) continue to provide a vital cushion to market volatility. In January, DIIs purchased a staggering **₹69,220 crore**, and they maintained this momentum with approximately **₹9,776 crore** in February. This domestic liquidity, fueled by consistent retail SIP flows, has ensured that market corrections remain shallow. Economic indicators remain supportive of the long-term India narrative. The HSBC India Composite PMI rose to **59.3** in February, the highest level since last November, signaling accelerated growth in manufacturing and services. Additionally, retail inflation is projected to remain stable at around **2.0% to 2.1%** for the fiscal year. Market analysts anticipate this trend of selective FPI buying to persist through FY26. While global risks such as US-Iran tensions and fluctuating crude prices remain, the focus has shifted toward an earnings-led market. As corporate performance shows clearer signs of recovery, India continues to be a preferred destination for patient, long-term global capital.

**US New Home Sales and Inventory Decreased in December**
US housing market dynamics are shifting as builders aggressively clear inventory to make room for a new construction cycle. New single-family home sales for December 2025 retreated by 1.7% to a seasonally adjusted annual rate of 745,000 units. Despite this slight cooling from recent four-year highs, the figures exceeded market expectations of 730,000, signaling resilient demand. Builders have successfully reduced the backlog of unsold homes, with total inventory falling 2.7% to 472,000 units. The supply of single-family homes under construction has reached a critical 5-year low of 587,000 units. This destocking process is viewed as a strategic pivot, allowing developers to break ground on fresh projects as market conditions improve. Early February 2026 data shows a significant rebound in construction activity. Housing starts for January surged nearly 4% to an annualized rate of 1.48 million units, far outpacing the 1.34 million projected by analysts. Simultaneously, building permits—a key indicator of future growth—climbed to 1.52 million units, the highest level of permitting activity since early 2024. Mortgage rates are providing much-needed tailwinds for affordability. The average 30-year fixed-rate mortgage fell to 6.01% as of late February, the lowest level since September 2022. This represents a significant drop from the 6.85% seen during the same period last year. While the national average APR sits at 6.14%, the downward trend is reviving buyer interest and fueling a 132% year-over-year surge in refinance applications. Pricing remains a point of contention for buyers. The median sales price for a new home stood at $414,400 in December, a 4.2% increase from the previous month. While 36% of builders reported cutting prices by an average of 6% to lure buyers, high land and labor costs continue to keep floor prices elevated. Regional performance varies sharply. The Midwest and West saw sales growth of 31.7% and 9% respectively, while the Northeast suffered a 37.3% plunge. Builder sentiment remains cautious, with the NAHB Housing Market Index dipping to 36 in February. However, the surge in permits suggests that the industry is preparing for a robust spring season as borrowing costs hover near the psychological 6% threshold.

Markets Brace for Impact of Potential 10% Global Tariffs Following Policy Shift
GIFT Nifty signals a bullish start for domestic markets as it trades up by 1.91% at 25,886. The index reached an intraday high of 25,897, reflecting strong global sentiment after a landmark US Supreme Court ruling. The US Supreme Court has struck down a series of sweeping tariffs previously imposed under national emergency laws. In a 6-3 verdict, the court ruled that the power to levy such taxes rests with Congress rather than the President. This decision effectively nullifies the previous punitive tariff structure that had seen rates on some goods climb as high as 50%. While this provides immediate legal relief, President Trump has responded by signing a new executive order for a 10% global baseline tariff under the Trade Act of 1974. The new 10% tariff is slated to take effect on February 24 for a duration of 150 days. This shift is seen as a strategic pivot, as the administration seeks alternative legal avenues to maintain its trade agenda. For India, the trade landscape is undergoing a rapid transition. Following a bilateral deal earlier this month, the effective tariff on most Indian goods had already been reduced to 18%. The latest court ruling and the subsequent 10% global order may further lower these costs. The Nifty Pharma index is a key beneficiary, having gained over 4.5% in recent sessions. Critical sectors such as pharmaceuticals, semiconductors, and energy remain largely exempt from the harshest duties to protect US supply chains. The metals and chemicals sectors are also in focus. These industries faced significant pressure under the previous 50% tariff regime and stand to recover as trade barriers are lowered. Investors are now tracking the potential for tariff refunds. Over 1,800 lawsuits have been filed by companies seeking to reclaim billions in duties paid since 2025. While the court ruled the previous tariffs illegal, the mechanism for processing these refunds remains unclear. Global indices show a mixed reaction. While US and European markets rallied on the news, the Nikkei 225 fell by 1.19% and the Hang Seng dipped 1.10% as Asian markets weigh the impact of the new 10% baseline. The domestic focus remains on export-oriented themes and policy responses from New Delhi. With GIFT Nifty holding strong support at 25,455, the market setup remains positive despite the ongoing shifts in international trade policy. [Trump's 10% tariff announcement](https://www.google.com/search?q=https://www.youtube.com/watch%3Fv%3DN_8VfJ-G0z8) This video provides a direct record of the President's response to the Supreme Court ruling and his immediate introduction of the new 10% global tariff policy.

**Capital Markets Face Rs 200 Lakh Crore Opportunity in AI Sector Growth**
India’s shift toward a high-performance economy is now moving beyond software code to a massive physical buildout. As of February 2026, the nation is entering an "Intelligence Supercycle" that demands a physical backbone of power, fibre, liquid cooling, and semiconductor chips. Market projections now peg the AI-linked infrastructure opportunity at ₹200 lakh crore. This capital-intensive transition is backed by a maturing financial ecosystem where REITs and InvITs have emerged as top-tier assets. In 2025, the Nifty REITs and InvITs index delivered returns of 25.48%, significantly outperforming the broader Nifty 50. The data center segment is the primary engine of this growth. Capacity has surged to 1.3 GW in early 2026 and is on a trajectory to hit 4.5–6.5 GW by 2030. High-density AI workloads now require 8–10 kW per rack—nearly five times the power of traditional setups—triggering a pivot toward advanced liquid cooling and captive renewable energy sources. Global capital is responding with scale. Major tech leaders have committed over $100 billion in cumulative investments for localized hubs. The Union Budget 2026–27 has further incentivized this by granting data centers "infrastructure status" and introducing a long-term tax holiday extending to 2047 for strategic facilities. Domestic semiconductor ambitions are also scaling via India Semiconductor Mission (ISM) 2.0. With an initial ₹8,000 crore outlay for the current fiscal year, the mission aims to move toward 3nm and 2nm technology nodes. The local chip market is expected to exceed $100 billion by 2030, reducing reliance on imported hardware for AI compute. The IndiaAI Mission has already deployed over 38,000 GPUs, with another 20,000 units expected within the next six months. This subsidized compute pool is designed to fuel a domestic ecosystem of deep-tech startups and indigenous foundation models. Financing this ₹200 lakh crore expansion relies on asset monetization. The government’s Asset Monetization Plan 2025–30 is leveraging roads, power, and telecom assets to recycle capital into new digital builds. With SEBI’s recent reclassification of REITs as equity-related instruments, institutional and retail participation is set to deepen, providing the long-term liquidity required for India's AI-led industrialization. [India's AI Mission 2.0 and GPU expansion details](https://www.google.com/search?q=https://www.youtube.com/watch%3Fv%3DS0169R_V-E4) This video provides specific details on the expansion of India's AI compute capacity and the strategic goals of the IndiaAI Mission 2.0 mentioned in the brief.

Analysis of Peter Lynch’s Investment Strategy Amid US Market Volatility
In today’s high-stakes environment, the stock-picking framework of Peter Lynch remains a vital anchor for navigating market volatility. By categorizing companies into six distinct groups—slow growers, stalwarts, fast growers, cyclicals, turnarounds, and asset plays—investors can better decipher earnings strength and true valuation amid global noise. The current market is defined by a shift toward fundamental profit growth. Global benchmarks are projected to return roughly 11% throughout 2026, yet indices face immediate resistance. As of late February, the Nifty 50 trades near 25,571, while the BSE Sensex holds around 82,814. US markets, led by the S&P 500 at 6,838 and the Nasdaq at 22,553, show high concentration in tech, though a broader diversification into value sectors is underway. Stalwarts and slow growers are regaining favor as defensive plays. Companies like HDFC Bank and ITC represent the steady-growth profile Lynch advocated for, providing stability as India’s retail inflation hovers around 2.75%. These large-cap leaders offer a buffer against geopolitical tensions, such as the recent US-Iran frictions that briefly spiked Brent Crude to 67.72 per barrel. Fast growers are now largely identified within the AI and renewable energy sectors. While tech giants like Nvidia and Microsoft continue to dominate the narrative, smaller high-growth entities are emerging. These companies are delivering revenue growth rates exceeding 20% to 50%, though they remain sensitive to interest rate trajectories, with the Federal Reserve eyeing a terminal rate between 3.0% and 3.25%. Cyclical stocks are currently responding to the manufacturing and infrastructure push. Sectors like steel and automobiles—represented by players such as Tata Steel and Eicher Motors—see their fortunes tied closely to the 6.4% GDP growth projected for the next fiscal year. Lynch’s advice to time these based on economic expansion is critical now, as metal prices stabilize and domestic consumption remains a primary growth engine. Turnarounds and asset plays require the most scrutiny in 2026. Opportunities are appearing in the IT sector, which has faced recent "AI-disruption" fears, and in public sector banks with cleaned-up balance sheets. Identifying deep value in these areas involves looking past short-term corrections, such as the recent 1,200-point Sensex dip, to find companies with misunderstood assets or significant recovery potential. Success in this landscape depends on maintaining a balanced portfolio that cuts through daily fluctuations. By applying this six-part lens, investors can distinguish between speculative bubbles and sustainable long-term opportunities in an increasingly polarized global economy.

Upcoming Record Dates for Angel One, NBCC, and 4 Other Stocks involving Splits and Dividends
Copper markets are navigating a period of high volatility in February 2026, characterized by a strategic retreat from record highs established in late January. While long-term fundamentals remain anchored by the energy transition, short-term pricing is reacting to shifting inventory levels and specific geopolitical maneuvers. The London Metal Exchange (LME) copper price currently fluctuates between **$12,700** and **$13,000** per tonne. This follows a historic peak of **$14,527** per tonne reached on January 29, 2026. The market is currently testing support levels near **$12,600**, with technical resistance noted at the **$13,200** mark. A primary driver of recent price action is the aggressive stockpiling in the United States. Domestic inventories surged to over **590,000** tonnes in early February, roughly five times the volume recorded a year prior. This accumulation is largely attributed to anticipated trade policy shifts and the implementation of "Project Vault," a **$12 billion** strategic raw-material reserve initiative. Global supply remains technically in a surplus of approximately **300,000** tonnes for 2026. However, this figure is misleading when viewed against the structural deficit in copper concentrates. Smelting and refining bottlenecks persist, particularly as US processing capacity only meets a fraction of its domestic demand, forcing heavy reliance on foreign refined metal. In China, the world's largest consumer, demand has shown a seasonal cooling following the Lunar New Year. Despite this, the State Grid has signaled a massive investment of **4 trillion yuan** for the 2026–2030 period, a **40%** increase over previous estimates. This infrastructure push is expected to absorb significant volumes of refined copper for ultra-high-voltage power lines. The technology sector is emerging as a critical demand pillar. Artificial Intelligence infrastructure and data center expansion now account for a rising share of high-grade copper plate consumption. Data centers alone are projected to require over **2.6 million** tons of refined copper annually by the next decade to support power distribution and cooling systems. Electric vehicle (EV) manufacturing continues to multiply copper intensity. A standard battery-electric vehicle in 2026 utilizes between **50 kg** and **80 kg** of copper, compared to just **20 kg** in traditional internal combustion engines. This represents a **3x** to **4x** increase in metal usage per unit, insulating the sector from broader industrial cooling. Market analysts maintain a constructive medium-term outlook despite the current price correction. Forecasts suggest an average price of **$12,125** per metric tonne for the remainder of 2026. While speculative net-long positions have been trimmed recently, the ongoing imbalance between aging mine supply and surging electrification needs continues to provide a firm floor for the market.
FII Long-Short Ratio Trends and Weekly Analysis of Ola, Newgen, and Other Major Movers
Market Pulse: Resilience Amidst Geopolitical Fog Indian benchmarks concluded the trading week on a positive note, successfully navigating a landscape of high volatility. The **Nifty 50** advanced **116.90 points** to settle at **25,571.25**, while the **S&P BSE Sensex** climbed **316.57 points** to finish at **82,814.71**. This recovery reflects a market attempting to find its footing after recent sharp corrections. Despite the gains, the indices remain within a consolidation phase as investors weigh domestic strength against mounting global risks. Institutional Flux and Global Pressures The institutional landscape remains characterized by a cautious "wait-and-watch" approach. Recent data shows **Foreign Institutional Investors (FIIs)** as net sellers, offloading approximately **880.49 crore** in the latest sessions. However, **Domestic Institutional Investors (DIIs)** continue to act as a significant buffer, absorbing selling pressure despite minor profit-booking of **596.28 crore** on Friday. The primary global overhang is the escalating tension in the Middle East. With **Brent crude** hovering near **$71–$72 per barrel**, fears regarding disruptions in the **Strait of Hormuz** are keeping the energy market on edge. Additionally, a new **10% U.S. import surcharge** announced on February 20 has added a layer of complexity for export-oriented sectors, although it represents a reduction from previous 18% tariff expectations. Sectoral Divergence Performance across sectors shows a clear divide between domestic-driven growth and global-facing headwinds. **Banking and PSU Strengths** The **Nifty PSU Bank index** has been the standout performer, surging **5.5%** over the week to reach fresh all-time highs. This rally is underpinned by robust **Q3 FY26** earnings, with the sector projected to surpass the **2 lakh crore** profit milestone this fiscal year. **State Bank of India (SBI)** and **NTPC** (up **2.62%**) led the large-cap charge. **IT and Technology Pressure** Conversely, the **IT sector** remains the primary laggard, declining nearly **2.5%** this week. High-profile names like **Tech Mahindra** and **Infosys** faced downward pressure. The sector is struggling with dual concerns: potential margin compression from new U.S. trade policies and ongoing uncertainty surrounding AI-driven shifts in the software service model. Technical Outlook for the Week Ahead The **Nifty 50** is currently battling a cluster of short-term moving averages between **25,580** and **25,680**. **Support Levels** Immediate support is established in the **25,400–25,300** zone. A breach below this could trigger a slide toward the **25,100** mark, where the **200-day EMA** provides a long-term safety net. **Resistance Levels** On the upside, **25,675** acts as the first major hurdle. A sustained close above **25,900** is required to shift the neutral bias back to a definitive bullish trend. **Safe Haven Assets** Reflecting the broader uncertainty, **Gold** has surged to **1.57 lakh per 10g** on the MCX. This three-day rally indicates a flight to safety as participants hedge against geopolitical instability and currency fluctuations.

DSP MF’s Aparna Karnik on the Role of Multi-Asset Funds in Portfolio Balancing
Multi-asset allocation has emerged as a cornerstone of disciplined investing in early 2026. As market volatility persists, the focus remains on balanced growth rather than chasing isolated rallies in any single asset class. The Indian equity market continues to demonstrate resilience despite global uncertainty. The Nifty 50 recently stabilized near the 25,820 mark, while the BSE Sensex has hovered around 83,735. Financial and metal sectors have provided significant support to the benchmarks, though information technology remains sensitive to global shifts. Gold remains a vital hedge within multi-asset portfolios. As of February 21, 2026, 24K gold is priced at approximately 156,899 INR per 10 grams. While the metal has seen sharp rallies over the past year, current trends show a period of consolidation following a climb toward the 160,000 INR resistance level. Silver has experienced a more volatile trajectory. After peaking at 350,000 INR per kg earlier in the month, it corrected sharply to around 269,900 INR. This 22% monthly correction underscores the importance of a calibrated approach to commodities, where systematic rebalancing can help capture gains and mitigate downside risks. The alternative asset landscape is also evolving. REITs and InvITs are gaining traction as reliable income generators. Effective January 1, 2026, SEBI reclassified REITs as equity-related instruments for mutual funds, enhancing their appeal for institutional and retail investors. Office-focused REITs are benefiting from strong Grade A leasing demand, which reached approximately 70 million square feet in the preceding year. Multi-asset funds aim for smoother, risk-adjusted returns by maintaining a diversified spread. Typical allocations include 40% to 60% in equities, 20% to 40% in debt, and 10% to 20% in commodities and alternatives. This structural diversity has allowed the category to deliver average annual returns of 16% to 21% in recent years, significantly outperforming many pure equity strategies during periods of heightened uncertainty. Disciplined diversification ensures that a portfolio is not overly dependent on a single market cycle. By integrating REITs for rental yields and commodities for inflation protection, investors can navigate the complexities of 2026 with a focus on long-term stability and smoother capital appreciation. [Smart REIT Investing](https://www.youtube.com/watch?v=X8wfp5HAZcI) This video provides an expert breakdown of how REITs function as income-generating assets within a 2026 investment portfolio. http://googleusercontent.com/youtube_content/0

Bitcoin’s Increasing Institutional Integration Leads to Market Correlation and Volatility
Market Brief: Bitcoin Structural Evolution Bitcoin’s deeper integration into the American financial system has fundamentally altered its behavior. While institutional participation was expected to provide a "digital gold" hedge, recent market data shows the asset now tracks more closely with high-risk equity markets. This shift has replaced retail-driven cycles with a complex institutional structure that reacts sharply to global economic shifts. Current Market Performance As of late February 2026, Bitcoin is trading in the mid **$67,000** range. This follows a significant correction from its October 2025 highs, representing a nearly **50%** drawdown over the last few months. Despite a brief attempt to break the **$100,000** milestone in January, the price was rejected, leading to a period of consolidation. Support levels are currently identified around **$65,100**. If this floor fails, analysts point to a psychological support zone at **$60,000**. On the upside, a daily close above **$73,750** is required to signal a return to bullish momentum. Institutional Flow and Demand The market is currently experiencing a period of institutional fatigue. Spot Bitcoin ETFs, which were primary drivers of the 2024-2025 growth, have seen nearly **$4 billion** in total outflows over the last five weeks. * Daily outflows recently hit **$165.7 million**. * Total ETF assets under management hover near **$130 billion**. * BlackRock’s IBIT remains the dominant vehicle with **$67 billion** in assets. These outflows act as an amplifier for market weakness. Unlike previous years where "whales" aggressively bought every dip, current data suggests a more tactical, cautious approach from large allocators. Macroeconomic and Structural Factors The Federal Reserve's recent decision to keep interest rates in a "neutral range" has created a pause in aggressive tightening, but inflation remains sticky. This has caused a notable divergence: while gold has rallied to record highs above **$5,000**, Bitcoin has struggled to maintain its status as a debasement hedge. New legislative developments, specifically the Digital Asset Market Structure Clarity Act (the CLARITY Act), are expected to reach a conclusion by April 2026. This bill aims to bridge the gap between crypto institutions and traditional banks, potentially serving as a long-term catalyst for stability. Volatility and Outlook Market structure has shifted toward a "balance-sheet asset" model. Major entities like MicroStrategy now hold approximately **714,644 BTC**, signaling that Bitcoin is increasingly treated as a treasury reserve rather than a speculative trade. However, this concentration of holdings, combined with high-leverage derivative zones, has led to episodic spikes in volatility. Traders are currently monitoring liquidity "squeezes" rather than news headlines, as market mechanics now drive price action more than retail sentiment.

CleanMax Raises Rs 921 Crore in Anchor Round Featuring Temasek and Tata Investment
Clean Max Enviro Energy Solutions has finalized its anchor investment round, raising **Rs 921 crore** just days before its public debut. The anchor portion saw heavy participation from top-tier global and domestic entities, including Temasek Holdings, SBI Life Insurance, and the Abu Dhabi Investment Authority (ADIA). Domestic institutional investors dominated the anchor book with a **68%** share, while foreign institutional investors accounted for the remaining **32%**. A total of **87,46,437** shares were allotted to these participants at the upper price band of **Rs 1,053** per share. The **Rs 3,100 crore** IPO is scheduled to open for public subscription from **February 23 to February 25, 2026**. The price band has been established between **Rs 1,000 and Rs 1,053** per equity share. The offering is structured as a fresh issue of **Rs 1,200 crore** alongside an offer-for-sale (OFS) of **Rs 1,900 crore**. Notable sellers in the OFS include founder Kuldeep Jain and Brookfield-backed BGTF One Holdings. A primary objective of the fresh capital is debt reduction. The company plans to deploy **Rs 1,122.67 crore**—nearly **94%** of the fresh proceeds—to repay or prepay existing borrowings. Total debt for the company stood at approximately **Rs 10,121 crore** as of late **2025**, marking a significant increase from previous years. This deleveraging strategy aims to improve interest coverage and overall financial stability. CleanMax currently operates as India's largest renewable energy provider for the commercial and industrial (C&I) sector. As of October **2025**, the company manages **2.80 GW** of operational capacity, with another **3.17 GW** under contract for execution. Financial performance has shown a recent turnaround. For the first half of fiscal year **2026**, the company reported a net profit of **Rs 19 crore** on revenues of **Rs 939.53 crore**, maintaining the profitability trend established in fiscal year **2025**. Market conditions for renewable energy remain robust. India’s C&I solar installations are projected to reach between **30 GW and 35 GW** by the end of **2026**, driven by falling technology costs and rising corporate sustainability mandates. The stock is expected to list on the BSE and NSE on **March 2, 2026**. At the upper price band, the company’s market capitalization is estimated at **Rs 12,325 crore**.

**JSW Steel and Tata Steel Expected to See Margin Recovery Amid Steady Domestic Demand**
India Steel Sector: Market Update February 2026 India has solidified its position as the primary engine of global steel growth. While international markets face flat or declining production, the Indian domestic sector is experiencing a significant upward trajectory. Core Performance Metrics As of February 2026, the **BigMint India Steel Composite Index** has risen **1.7%** week-on-week, following a bullish trend throughout January. Steel prices have strengthened, with primary mills increasing blast furnace rebar prices by up to **₹3,000 per tonne**. Inventory levels at primary mills have sharply declined by nearly **40%** month-on-month, signaling rapid absorption of supply by the market. Finished steel consumption is maintaining a robust growth rate, with projections holding steady at an **8-10%** volume CAGR through **FY28**. Demand Drivers and Infrastructure Structural demand is being propelled by the **$1.4 trillion National Infrastructure Pipeline** and large-scale projects under the Gati Shakti and Bharatmala initiatives. Real estate remains a critical pillar, with residential property sales expected to reach **₹6.65 lakh crore** in **FY26**, a **19%** year-on-year increase in value. Furthermore, the energy transition and defense sectors are emerging as high-growth segments for specialty steel products. Supply and Capacity Expansion India’s current installed crude steel capacity has reached approximately **180 million tonnes (MT)**. Major producers are on a path to scale this to **300 MT** by **2030**. Domestic manufacturers are currently shielded by a **12% safeguard duty** on select imports, ensuring that local demand is primarily met by domestic players. This protectionist environment, combined with rising realizations, is facilitating a recovery in operating margins. Leading Producer Highlights **Tata Steel** and **JSW Steel** continue to lead the market expansion. Tata Steel recently hit new price highs of **₹211.35**, supported by a **6%** year-on-year increase in operating income. **JSW Steel** is seeing similar momentum, with standalone EBITDA per tonne projected to rise to **₹10,750** by **FY27**. Both entities are aggressively ramping up capacity, with JSW targeting a domestic capacity of **30 MTPA** in the immediate term. Raw Material and Cost Dynamics While the outlook is positive, the industry manages sticky input costs. Iron ore production remains strong at **280 million tonnes**, yet the sector faces a growing reliance on imported coking coal, with nearly **70%** sourced from international markets. The industry is also initiating a structural shift toward "green steel," with the goal for specialty steel production to reach **42 million tonnes** by the end of **FY27**.

US Dollar Outlook: Potential for Market Recovery
The U.S. dollar is currently navigating a period of sharp volatility as it attempts to reverse a long-standing downtrend. While the currency hit five-year lows in January near 95.50, the Greenback has staged a meaningful recovery in February. The U.S. Dollar Index (DXY) is now trading near the 97.89 mark, its strongest weekly performance in four months. This rebound is driven by the nomination of a potentially more hawkish Federal Reserve Chair and a series of resilient economic data points. Economic fundamentals remain a primary pillar of support. Real GDP for 2026 is forecast to expand between 2.3% and 2.4%, reflecting a solid growth trajectory. Additionally, the labor market continues to show strength, with unemployment holding steady at 4.4%. Geopolitical factors are also playing a critical role in the dollar's safe-haven appeal. Tensions between the U.S. and Iran have intensified, leading to a 6% surge in oil prices recently, with Brent crude trading around $71.77. These risks, combined with shifts in trade policy following recent Supreme Court rulings on tariffs, have kept investors cautious. The Indian Rupee is facing significant downward pressure amidst this global shift. The USD/INR exchange rate has climbed to approximately 90.95, a sharp move from levels near 83.77 seen last year. Domestic factors in India are adding to the rupee's challenges. While manufacturing activity is strong—with the PMI rising to 57.5 in February—a selling rush in local equities and rising crude oil prices have weighed on the currency. The Reserve Bank of India has been active in the 90.70 to 90.80 zone to prevent even steeper depreciation. Looking ahead, the market is focused on whether the Dollar Index can sustain its position above the 97 level. If technical momentum continues, analysts see the index testing resistance at 98.80 or moving further toward the 100 to 102 range. For the rupee, the combination of a stronger dollar and high energy costs suggests a testing period. Markets are closely watching upcoming U.S. inflation data and the Federal Reserve's January meeting minutes to gauge if this dollar recovery has the stamina to reach new yearly highs.

12 Small-cap Stocks Decline for Five Consecutive Sessions
Market Brief: Broader Market Fragility Amid Benchmark Recovery The Indian equity market concluded the week ending **February 20, 2026**, with a stark contrast between headline indices and the broader small-cap universe. While the **BSE Sensex** managed a marginal five-day gain of **0.23%** (roughly **188 points**) to settle at **82,814.71**, underlying sentiment remains heavy. A sharp **1,236-point** plunge during the Thursday session erased much of the week’s early progress, driven by escalating geopolitical tensions in the Middle East and rising crude oil prices. Although the **Nifty 50** recovered to close above the **25,550** mark on Friday, the recovery was highly selective, favoring large-cap defensives over smaller entities. Small-Cap Segment Under Pressure The broader market continues to exhibit significant weakness. Data from the **BSE Smallcap** segment reveals that **63 stocks** declined consistently across all five trading sessions this week. Selling pressure was particularly aggressive in specific pockets, with **12 small-cap companies** recording cumulative losses exceeding **15%**. This sustained sell-off highlights a "risk-off" mood among retail and HNIs, even as institutional buying stabilized the larger benchmarks. Sectoral Winners and Laggards Market leadership shifted toward domestic-facing sectors. **Power**, **Metals**, and **Capital Goods** indices saw gains of **1% to 2%** in the final session, led by stocks like **Hindalco** and **NTPC**. In contrast, the **IT sector** faced a challenging week. Despite a strategic AI partnership between **TCS** and **OpenAI**, the Nifty IT index remained under pressure due to global growth concerns. Furthermore, the **BSE 250 SmallCap Index** slipped **0.46%** even as the Sensex rose, emphasizing a deepening "breadth imbalance." Critical Indicators to Watch Market volatility, measured by the **India VIX**, climbed to **14.35**, a **6.5%** jump that signals rising nervousness among traders. Economic data provided a mixed backdrop; while the **HSBC India Composite PMI** hit a multi-month high of **59.3**, input costs reached a **15-month peak**, threatening corporate margins. Technical support for the Nifty is currently pegged at **25,400–25,500**, while the Sensex faces immediate resistance at the **83,200** level. Investors are closely monitoring foreign institutional flows, which have turned cautious amid the holiday season in key Asian markets.
US Stocks Rise Following Supreme Court Ruling on Trade Tariffs
Indian equity markets staged a resilient recovery on Friday, February 20, 2026, recouping losses from a sharp previous-session correction. The BSE Sensex climbed 316.57 points to settle at 82,814.71, while the NSE Nifty 50 advanced 116.90 points to close at 25,571.25. Buying was concentrated in large-cap banking and metal stocks, while the IT sector lagged behind. Optimism was driven by India's entry into Pax Silica, a move expected to secure supply chains for semiconductors and AI minerals. Domestic economic indicators remained solid, with the Manufacturing PMI rising to 57.5 and the Composite PMI hitting a multi-month high of 59.3. Despite these gains, market breadth was slightly negative with 2,511 declining stocks against 2,043 advancing ones. Wall Street witnessed a dramatic intraday reversal following a landmark 6-3 ruling by the U.S. Supreme Court. The court struck down President Trump’s global tariffs, ruling that the administration had exceeded its authority under the 1977 International Emergency Economic Powers Act. This decision sparked a relief rally, as it opened the door for companies to recoup an estimated 175 billion dollars in previously paid levies. The tech-heavy Nasdaq Composite surged 1.11% to 22,935.19, led by e-commerce and technology giants. Alphabet jumped over 4%, and Amazon moved higher as the removal of tariff uncertainty outweighed concerns regarding their massive 380 billion dollar combined AI capital expenditure plans for 2026. The S&P 500 rose 0.66% to 6,907.34, while the Dow Jones Industrial Average added 130.43 points to close at 49,525.59. The afternoon rally in the U.S. overshadowed discouraging morning data, which showed Q4 GDP growth slowing to 1.4% and inflation remaining higher than expected. While President Trump responded to the ruling by announcing a new 10% tariff on all countries using alternative trade laws, he confirmed that the specific U.S.-India trade agreement parameters remain unchanged. Oil prices rose approximately 2% during the session due to intensifying geopolitical tensions between the U.S. and Iran. Gold prices also trended higher, trading at 156,530 rupees per 10 grams on the MCX. Market volatility, as measured by the VIX, remains elevated but saw a 5% drop immediately following the court's tariff decision. Global growth projections for 2026 are currently being revised upward for both the U.S. and India, reflecting a "tenuous resilience" in the face of shifting trade policies. Investors are now pivoting focus toward upcoming corporate earnings and the long-term returns on significant AI infrastructure investments.

SBI Explores M&A Financing Through Discussions With Japanese Lenders
State Bank of India (SBI) is signaling a major shift in its corporate lending strategy by aggressively targeting the domestic merger and acquisition (M&A) landscape. The country’s largest lender has identified a massive "war chest" of 94,000 crore INR to fund upcoming deals, marking a turning point for Indian banking. This move follows final guidelines issued by the Reserve Bank of India on February 13, 2026. The new regulations permit banks to fund up to 75% of an acquisition’s cost, a significant jump from previous restrictions. To manage risk, the regulator has capped a bank’s total exposure to M&A financing at 20% of its Tier-1 capital. SBI Chairman CS Setty has confirmed that the bank is in advanced discussions with Japanese lenders to form strategic partnerships. These collaborations are aimed at leveraging the deep experience Japanese banks have in global deal structuring. While SBI is open to various partners, Japanese institutions are currently lead candidates due to their active presence in the sector. The lender intends to adopt a "plain vanilla" approach for its initial domestic deals. This means focusing on straightforward debt-for-equity structures rather than complex instruments like mezzanine financing. The primary focus will be on listed companies with a minimum net worth of 500 crore INR and a consistent profit record over the last three years. Market data shows that India’s M&A activity reached 50 billion USD in the first half of 2025, with a growing trend toward billion-dollar "mega-deals." SBI’s entry into this space, which was historically dominated by private credit funds and offshore lenders, is expected to provide much-needed liquidity for domestic consolidation. The bank is currently awaiting final board approval for its internal M&A financing policy, which will outline specific pricing and risk appetite benchmarks. These new credit facilities are scheduled to be available to corporate borrowers starting April 1, 2026, coinciding with the new financial year. Under the new norms, the post-acquisition debt-to-equity ratio must remain within a 3:1 limit. This safeguard ensures that while banks take on larger roles in corporate buyouts, the financial health of the acquiring entities remains stable on a continuous basis.
Indian stocks recover amid escalating US-Iran geopolitical tensions
Market Brief: Indian Equities Recover Amid Geopolitical Volatility Indian benchmark indices staged a resilient recovery during the final session of the week, successfully reclaiming a significant portion of the losses incurred in previous days. The market sentiment shifted positively as broad-based buying in heavyweights offset earlier concerns regarding global instability. Benchmark Performance The S&P BSE Sensex gained **316.57 points**, representing a **0.38%** increase, to settle at **82,814.71**. This recovery followed a volatile start where the index initially dipped by nearly **292 points**. At its intraday peak, the Sensex surged by over **633 points**, reaching a high of **83,132.08**. The NSE Nifty 50 followed a similar trajectory, climbing **116.90 points** or **0.46%** to close at **25,571.25**. Out of the 50 constituent stocks, **36** ended the day in positive territory, signaling a healthy recovery across various sectors. On a weekly basis, the Sensex added **0.22%**, while the Nifty saw a marginal gain of **0.39%**. Sectoral Highlights The banking and metal sectors were the primary drivers of the Friday rebound. Notable gainers included NTPC, which rose **2.64%**, and Larsen & Toubro, which advanced **2.33%**. Other top performers featured Hindalco, up **3.21%**, alongside Bharat Electronics and Tata Steel. In contrast, the IT sector remained a laggard throughout the day, experiencing continued selling pressure. Major technology stocks like Tech Mahindra, Infosys, and HCL Technologies featured among the session's top losers, reflecting a more cautious outlook on global tech spending. Energy and Geopolitical Impact Crude oil prices remained elevated near a six-month high, driven by intensifying tensions between the United States and Iran. Brent crude futures hovered around **$71.99 per barrel**, while U.S. West Texas Intermediate (WTI) traded near **$67.05**. These levels represent a weekly gain of approximately **6%** for Brent and over **5%** for WTI. The military buildup in the Middle East and the potential for supply disruptions in the Strait of Hormuz—a conduit for **20%** of global oil supply—have injected a significant risk premium into energy markets. This surge in input costs has placed visible pressure on domestic oil marketing companies like BPCL and HPCL. Economic Indicators Internal economic data provided some structural support to the indices. The HSBC India Composite PMI rose to **59.3** in February 2026, marking its highest level since last November. This growth was fueled by strong factory output and improved hiring, even as input costs reached a 15-month peak. While the domestic manufacturing and services sectors remain in expansion territory, the overall market breadth remained slightly negative, with **2,265** shares declining against **1,917** advances on the BSE. This suggests that while large-cap heavyweights are stabilizing, the broader market continues to exercise caution.

Nine IPOs worth Rs 4,300 crore to launch next week, including Clean Max and PNGS Reva
India’s primary market is entering an exceptionally busy phase, with nine initial public offerings scheduled to open in the final week of February. A total of four mainboard IPOs and five SME issues are looking to collectively raise approximately 4,300 crore. The headline act for the week is Clean Max Enviro Energy Solutions. The renewable energy major has set a price band of 1,000 to 1,053 per share for its 3,100 crore issue. The subscription window for this offering opens on February 23 and closes on February 25. Clean Max intends to use 1,122 crore of the fresh proceeds to repay debt, a move aimed at strengthening a balance sheet that currently carries over 10,121 crore in borrowings. The company recently turned profitable in the 2025 fiscal year, reporting a profit of 19.43 crore on revenues of 1,610 crore. Joining the mainboard fray on February 23 is Shree Ram Twistex, a textile player aiming to raise 110.24 crore. Its price band is fixed at 95 to 104 per share. Following closely, PNGS Reva Diamond Jewellery will open its 380 crore IPO on February 24 with a price band of 367 to 386 per share. The final mainboard entry, Omnitech Engineering, opens on February 25. The precision engineering firm is targeting 583 crore with a price band of 216 to 227 per share. These diverse offerings come as secondary markets show signs of recovery. On the latest trading day, the BSE Sensex rose 316 points to settle at 82,814, while the NSE Nifty 50 advanced 116 points to close at 25,571. Market sentiment has stabilized following recent volatility, supported by buying in banking and metal sectors. The SME segment remains equally vibrant with five issues opening during the week. Notable names include Kiaasa Retail, looking to raise 69.72 crore, and Mobilise App Lab, targeting 20.10 crore. These smaller issues often attract aggressive retail interest despite the higher risk profile. Investors are closely watching grey market premiums, which currently remain subdued for the larger issues. Clean Max is trading at a marginal premium of approximately 5 to 9 per share in the unofficial market, reflecting a cautious but selective approach from participants. Gold prices in the domestic market have reached 1,56,940 per 10 grams, while the rupee has softened to 90.98 against the US dollar. These broader economic indicators are providing a complex backdrop for the upcoming listings, as the primary market tests deep liquidity reserves in the renewable, retail, and engineering sectors.
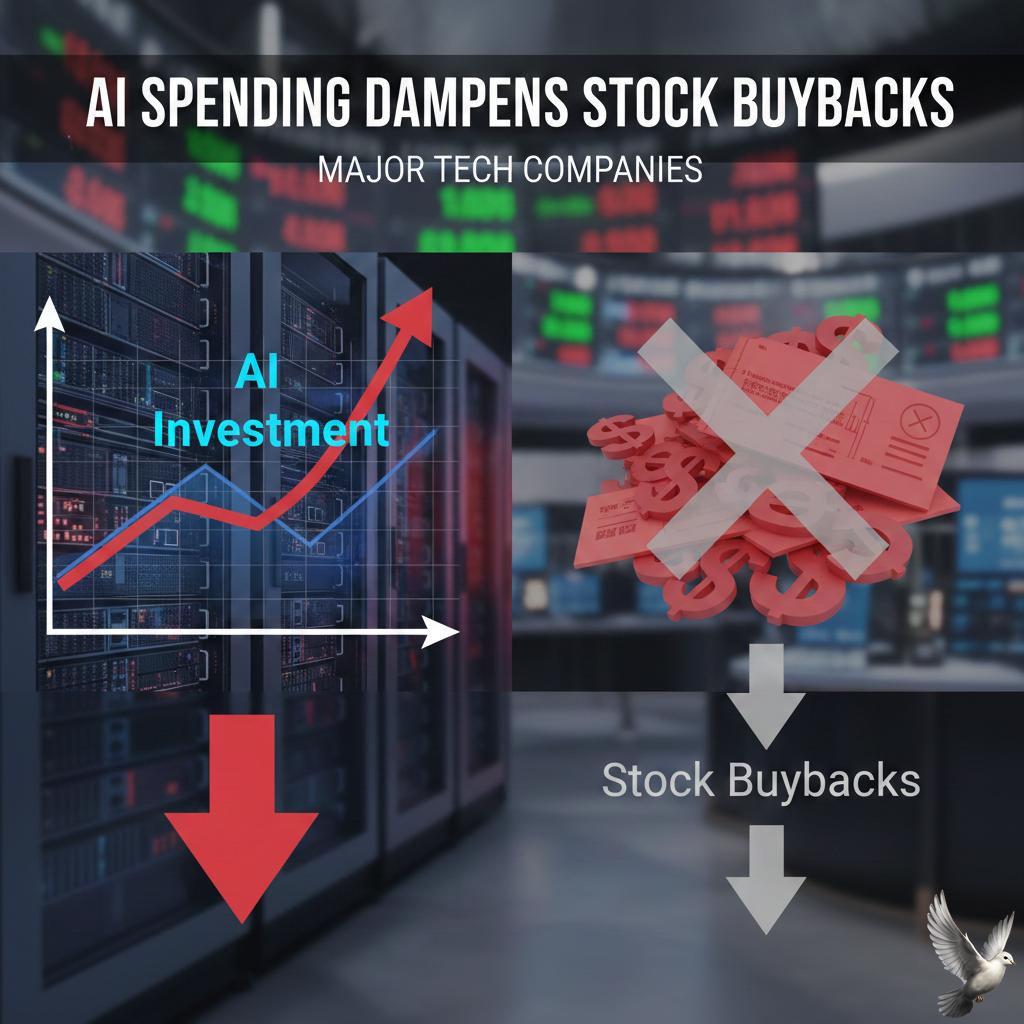
**AI Spending Dampens Stock Buybacks for Major Tech Companies**
Major technology corporations are undergoing a structural shift in capital allocation, prioritizing massive infrastructure investments over traditional shareholder returns. As of February 2026, the industry's four largest hyperscalers—Alphabet, Amazon, Meta, and Microsoft—have signaled a collective capital expenditure (CapEx) package of approximately **$650 billion** for the current year. This surge represents a **60% increase** from the **$410 billion** spent in 2025. This pivot is largely funded by a significant retreat from stock buybacks. Combined share repurchases for the top tech firms fell to **$12.6 billion** in the final quarter of 2025, marking a **74% decline** from the peak of **$48 billion** seen in 2021. Strategic Infrastructure Spending The primary driver of this expenditure is the race to build AI data centers, procure advanced chips, and secure power-hungry computing clusters. Amazon has disclosed plans to spend nearly **$200 billion** this year, with a heavy focus on its cloud unit, AWS. Alphabet’s projected spend is expected to exceed **$50 billion** to support its Gemini ecosystem, while Microsoft is on pace to surpass **$140 billion** in annual spending to double its data center footprint. * **Hyperscaler Total:** **$650 billion** (Projected 2026) * **Sector Growth:** **165%** increase in CapEx since 2024 * **Market Sentiment:** **$900 billion** in collective market cap lost following recent earnings reports as investors weigh spending against immediate returns. Market Volatility and Divergence While the broader market remains cautious, a clear divergence has emerged between companies providing the infrastructure and those developing consumer software. Nvidia remains a primary beneficiary, with analysts expecting quarterly revenues of roughly **$65.5 billion** due to its **80% market share** in AI accelerators. In contrast, software-heavy firms face increased scrutiny. The S&P 500 software and services index recently saw a **10% decline** in a single week, as investors voiced concerns over the timeline for AI monetization. Despite the "AI headache" for some, Meta has found a silver lining, reporting growth in AI-driven advertising revenue that helped its stock initially resist the broader sector sell-off. The Long-Term Outlook This transition suggests that Big Tech is evolving from a high-margin software business into a capital-heavy "AI utility." While reduced buybacks have removed a historical stabilizing force for stock prices—leading to higher volatility—tech leaders maintain that these investments are essential. The current build-out is being compared to the industrial revolution, with infrastructure spending now equating to roughly **0.8% of global GDP**.

Brent Crude Prices Rise Weekly Amid Iran-US Tensions
Market Brief: Global Oil Surge **Brent crude** prices have hit a six-month high, surpassing the **$71** mark as geopolitical friction intensifies. The global benchmark reached **$71.99** per barrel, marking a sharp **6%** gain for the week. **WTI** futures followed a similar trajectory, rising above **$67** per barrel with a weekly increase of over **5%**. This rally is primarily driven by escalating tensions between the **U.S.** and **Iran** regarding nuclear developments. Washington has issued a **10-to-15 day** ultimatum for a new nuclear agreement. In response, the U.S. has significantly increased its military presence in the Middle East, deploying two aircraft carriers and strike groups to the region. Market anxiety is centered on the **Strait of Hormuz**. This narrow passage facilitates the transit of nearly **20%** of global oil consumption. Iran recently conducted joint naval drills with Russia and issued notices of rocket launches, briefly closing parts of the strait. Supply fundamentals remain tight. Global oil inventories in the **U.S.** and **China** are shrinking. Meanwhile, **OPEC+** members have reaffirmed plans to keep production levels flat through the first quarter of **2026**. Technical indicators show **WTI** has recovered strongly from the **$55** zone. Analysts suggest a decisive breakout above **$72** for Brent could signal a new leg higher in the current commodity cycle. Secondary factors contributing to price support include the breakdown of peace talks between **Russia** and **Ukraine**. This has reignited fears of extended sanctions and further supply disruptions in European energy markets. Global demand for **2026** is forecast to rise by **850,000** barrels per day. Non-OECD economies, specifically **China** and **India**, are expected to account for the entirety of this consumption growth. Market participants are now pricing in a significant risk premium. Any physical disruption to shipping lanes could trigger an immediate supply shock, potentially pushing prices toward triple digits. Investment sentiment remains bullish despite short-term volatility. Traders are closely monitoring the **10-day** diplomatic window as the primary trigger for the next major price movement.

Gold Rises Over 1% Following US Economic Data and New Tariff Announcements
Market Brief: Gold and Global Trade Volatility **February 21, 2026** Gold markets are experiencing a sharp resurgence as a collision of weak economic data and renewed trade friction resets investor expectations. Spot gold is currently trading near **$5,025 per ounce**, maintaining a hold above the critical **$5,000** psychological threshold. In domestic markets, prices have climbed to approximately **₹1,57,520 per 10 grams**, reflecting a gain of over **₹800** from the previous session. This rally follows a volatile week where the metal recovered nearly **₹300 per gram** from recent lows. GDP Stagnation and Inflationary Pressure Fresh data shows U.S. economic growth slowed significantly to an annualized rate of **1.4%** in the final quarter of last year. This figure fell sharply below the **3%** growth projected by economists. A record **43-day government shutdown** and a notable cooling in consumer spending are cited as primary drivers of this deceleration. Despite the slowdown, the Federal Reserve's preferred inflation gauge, the PCE index, rose **0.4%** in December. This combination of sluggish growth and persistent price increases has intensified "stagflation" concerns, historically a strong environment for precious metals. The Tariff Tug-of-War Trade policy has emerged as a primary source of market turbulence. While the U.S. Supreme Court recently struck down a broad set of global tariffs—ruling that the administration exceeded its executive authority—the reprieve for markets was short-lived. Immediately following the ruling, the administration announced a new **10% global tariff** on all imports, leveraging alternative statutory powers. While the court decision provided a temporary boost to equities, the swift pivot to new protectionist measures has fueled a "safe-haven" rotation back into gold. Technical Outlook and Silver Performance Analysts note that gold has formed a potential "double-bottom" technical pattern, with strong support holding at the **$4,880** level. Immediate resistance is now pegged between **$5,100 and $5,120**. The broader metals complex is following gold's lead: * **Silver** surged **3.4%** to reach **$81.02 per ounce**. * **Platinum** gained **2.8%**, currently trading at **$2,127**. * **Palladium** rose **2%** to reach **$1,718**. Geopolitical tensions and a steady trend of central bank diversification continue to provide a structural floor for prices. Market participants are now pricing in a high probability of at least two interest rate cuts this year, with the first anticipated in **June 2026**.