Bullish News
Collection
Indian Benchmarks Trade Lower Amid Weakness in Metal and Broader Market Indices
Market Outlook: February 16, 2026 The Indian equity benchmarks, **Nifty 50** and **Sensex**, entered their fourth consecutive session of decline on Monday morning. Following a heavy sell-off on Friday, the markets opened in the red, with the **Nifty 50** dropping approximately **37 points** to trade around the **25,434** level. The **BSE Sensex** mirrored this weakness, slipping over **100 points** to hover near **82,520**. Volatility remains high as the **India VIX** surged over **13%** during the recent downturn, reflecting heightened investor anxiety. Market breadth is currently skewed toward sellers, with roughly **90%** of Nifty constituents trading in negative territory during early hours. Tech and Metal Drag The **IT sector** continues to face severe valuation pressure. The **Nifty IT index** plunged nearly **9%** in the past week, marking its sharpest weekly decline since mid-2025. Fears of structural disruption from **Agentic AI**—specifically the launch of advanced AI worker suites—have triggered a massive repricing of traditional outsourcing firms. **Metals** also weighed heavily on the indices. The **Nifty Metal index** dropped toward **11,850**, led by a **6%** slide in **Hindalco** and significant cuts in **Tata Steel**. New regulatory notices and weak global commodity cues have stalled the recent momentum in industrial stocks. Sectoral Rotation and Resilience Amid the broader decline, institutional funds are actively shifting capital into sectors with clearer earnings visibility. While the **Nifty Bank** fell roughly **550 points** to **60,186**, select heavyweights like **SBI** and **ICICI Bank** have shown relative resilience, trading near their one-year highs. The **Auto sector** remains a bright spot. **Eicher Motors** surged **12%** over the last week on strong quarterly performance, while **Bajaj Auto** and **Maruti Suzuki** continue to attract value buying. Analysts expect this "flight to quality" to favor **Financials, Automobiles, and Capital Goods** in the near term. Critical Levels to Watch Technical indicators suggest the **Nifty 50** is testing immediate support at **25,300**. A decisive break below this could pull the index toward the **25,100** floor. On the upside, **25,700** acts as a stiff resistance zone that the market must reclaim to signal a trend reversal. For the **Sensex**, the **81,250** level is viewed as a critical psychological support. Investors are closely monitoring the **India AI Impact Summit** and global crude prices, with **Brent** currently balanced near **$68**, as these factors will dictate the trajectory for the remainder of the week.

Sandeep Nayak on Avoiding High P/E Stocks Without Earnings Growth
Market dynamics are transitioning into a highly discerning phase, shifting the focus from speculative narratives to concrete performance. As of February 16, 2026, the Indian benchmark indices are navigating significant volatility, with the Nifty 50 trading near **25,471** and the Sensex at **82,626**. Profit booking remains a dominant theme, particularly in the IT and FMCG sectors, as investors reassess high-valuation stories. The current market environment cautions against chasing small and mid-cap stocks with Price-to-Earnings (P/E) ratios exceeding **40x** to **50x** without clear earnings visibility. Institutional activity reflects a complex tug-of-war. While Foreign Institutional Investors (FPIs) recorded net sales of over **₹7,395 crore** in the most recent session, they have remained net buyers for February so far, accumulating shares worth approximately **₹18,129 crore**. Domestic Institutional Investors (DIIs) continue to act as a stabilizing force, absorbing selling pressure with net purchases of **₹5,553 crore**. India's medium-term outlook remains constructive, underpinned by robust macroeconomic indicators. Real GDP growth for FY2025-26 is projected at **7.4%**, with some estimates suggesting a surge as high as **9.2%** in the final quarter. Retail inflation is being managed within the **4%** to **4.6%** range, providing the Reserve Bank of India (RBI) room to maintain a neutral stance with the repo rate at **5.25%**. Fiscal consolidation is also on track, with the government targeting a deficit of **4.4%** of GDP for the current fiscal year. Sectoral performance is increasingly polarized. While industrials and financials are seeing strategic interest and cross-border M&A activity—accounting for **60%** of total deal value—sectors like IT face headwinds from global disruption fears. Investors are prioritizing quality over momentum, focusing on companies with sustainable earnings delivery. The broadening of the domestic manufacturing ecosystem, supported by **₹11.21 lakh crore** in capital expenditure, continues to provide a long-term cushion against global liquidity shifts. Strategic allocation is now shifting toward "fair value" opportunities in large-caps and defensive sectors, as the market prepares for a potential period of multiple compression in overextended segments.

GE Power India among 5 stocks showing bullish momentum and potential uptrend
A White Marubozu is a robust bullish candlestick pattern that signals absolute buyer dominance throughout a trading session. Visually, it appears as a long green or white body with no upper or lower shadows. This structure indicates that the asset opened at its lowest price and closed at its highest, leaving no room for seller intervention. In the current market environment of February 2026, these patterns are increasingly vital for navigating high-volatility zones. For instance, while the S&P 500 recently faced pressure from AI-related capital expenditure concerns, it managed to sustain levels near **6,848.50**. Traders watching for a White Marubozu in such a climate look for the "shaved" candle to confirm that bulls have successfully absorbed supply at key support levels. The psychological weight of this pattern is significant. It reflects a state of relentless buying pressure where participants are willing to buy at any price throughout the period. In a mature bull cycle, such as the one observed in early 2026, a White Marubozu appearing after a brief consolidation can signal a trend continuation, often leading to rallies of **5% to 15%** in large-cap equities. Recent data from the Indian markets highlights the stakes of identifying these signals. On February 13, 2026, the Sensex dropped **1.25%** to **82,626.76**, while the Nifty 50 fell to **25,471.10**. In such corrective phases, the appearance of a White Marubozu at the bottom of a downtrend is viewed as a high-conviction reversal signal. Historical performance suggests these reversals can trigger rebounds of **10% to 25%** in mid-cap sectors. Volume remains the primary validator for this pattern. A true Marubozu should be accompanied by a spike in trading activity to prove the move isn't a low-liquidity anomaly. In 2026, algorithmic trading systems often trigger long positions when prices break above the high of a Marubozu, typically setting a stop-loss just below the candle's base to manage a risk-to-reward ratio of **1:2** or **1:3**. While powerful, the pattern is not infallible. In range-bound or "choppy" markets, it can occasionally lead to whipsaws or false breakouts. Technical analysts recommend using it alongside other tools, such as the Relative Strength Index (RSI). If a White Marubozu forms while the RSI is below **70**, the move is generally considered more sustainable than one occurring in overbought territory. The White Marubozu remains a definitive declaration of market sentiment. Whether it marks the start of a new rally or the continuation of a long-term trend, its absence of wicks leaves no doubt about who controlled the session. For investors in 2026, spotting this "bald" candle is often the first step in identifying high-momentum entry points.

Bharat Electronics and Safran Electronics Form Joint Venture
Bharat Electronics Limited (BEL) is witnessing a significant strategic expansion following its board's approval on **February 15, 2026**, for a new joint venture with France's Safran Electronics and Defence. This **50:50 partnership** is centered on Project HAMMER, establishing a dedicated "Center of Excellence" likely to be based in Pune. The entity will focus on the manufacturing, supply, and maintenance of Guidance Kits for the HAMMER Weapon System, a high-precision air-to-ground munition. The Indian Air Force and Navy remain the primary beneficiaries of this collaboration, which directly supports the nation's indigenization mandates under the latest Defense Acquisition Procedure guidelines. Market Performance and Valuation BEL shares have maintained a strong trajectory despite recent intraday volatility. As of **February 16, 2026**, the stock is trading near **₹435.55**, having recently touched a 52-week high of **₹461.65**. The company currently commands a market capitalization of approximately **₹3.18 lakh crore**. Investor sentiment is bolstered by a **66.5%** return over the past year, reflecting the sector’s robust growth. While the current Price-to-Earnings (P/E) ratio sits around **53x**, the stock remains technically positioned above its long-term moving averages. Financial Health and Order Visibility The company’s most recent financial disclosures for the third quarter of the fiscal year 2025-26 reveal high operational efficiency: * **Net Profit:** Surged **20.8%** year-on-year to reach **₹1,590 crore**. * **Revenue:** Grew by **23.7%**, hitting **₹7,122 crore** for the quarter. * **EBITDA Margin:** Expanded to **29.7%**, defying market expectations of a contraction. BEL’s revenue visibility is exceptionally strong, with a total order book valued at **₹73,015 crore** as of **January 1, 2026**. This backlog is further supported by a steady stream of smaller contracts, including recently secured orders worth **₹581 crore** for communication equipment and radar systems. Strategic Outlook The Safran partnership marks a shift toward high-tech weapon system integration, moving beyond traditional electronics. This alignment with the **₹7.85 lakh crore** defense budget allocation for 2026-27 positions BEL to capture a larger share of the domestic procurement pie. The joint venture will operate as a private limited company with an initial authorized capital of **₹1,00,000**, scalable up to **₹10 crore** as operational needs for Project HAMMER intensify. Management indicates that the venture will serve as a technology-cum-teaming partner, ensuring long-term maintenance and repair capabilities are localized.

4 Stocks Showing Bullish RSI Upswing Including Engineers India
February 16, 2026 **Engineers India Leads Nifty 500 Bullish Crossovers** Four prominent stocks within the Nifty 500 index have signaled a significant shift in price momentum. Technical scans on February 13 confirmed that Engineers India, Aditya Birla Fashion, TBO Tek, and K.P.R. Mill crossed above the 50-mark on the Relative Strength Index (RSI). This "RSI Trending Up" signal indicates that price strength is moving from a neutral or bearish zone into bullish territory. Traders often use this crossover as a leading indicator for short-term buying opportunities and potential price appreciation. **Engineers India: Triple Surge in Profitability** Engineers India Limited (EIL) emerged as the primary standout, with its RSI jumping to **65.34** from a previous **49.29**. The stock price reacted sharply to stellar Q3 FY26 financial results, surging **11.49%** in a single session to close at **₹201.67**. The company's consolidated net profit for the December quarter skyrocketed by **219.3%**, reaching **₹347.17 crore** compared to **₹109 crore** in the previous year. Operational revenue also climbed **58.3%** to hit **₹1,210 crore**, supported by a massive expansion in EBITDA margins, which rose to **29.1%**. **Strategic Wins and Order Book Strength** The bullish sentiment is further backed by a record-high order book of **₹15,670 crore** as of January 2026. A key driver of this growth is the **$350 million** contract for the Dangote refinery expansion in Nigeria, EIL's largest overseas win to date. International operations now represent roughly **65%** of fresh order inflows. Domestically, the consultancy segment remains a core contributor, adding **₹296 crore** in new business during the last quarter. **Other Notable RSI Breakouts** The technical upswing was not limited to the engineering sector. Three other Nifty 500 constituents joined the momentum shift: * **Aditya Birla Fashion & Retail**: RSI climbed to **56.84** from **49.89**, with the stock priced at **₹73.80**. * **TBO Tek**: RSI moved to **52.18** from **46.30**, ending at **₹1,520.50**. * **K.P.R. Mill**: RSI reached **51.64** from **46.54**, closing the session at **₹930.50**. **Market Context and Trend Outlook** These breakouts occurred despite broader market volatility. On February 16, the Nifty 50 traded at **25,471.10**, down **336 points**, while the Sensex faced a **1,048-point** drop to **82,626.76**. While the wider market shows signs of cooling momentum with the Nifty RSI slipping below 50, these specific stocks are diverging from the trend. Analysts maintain a positive outlook on Engineers India, with some firms setting price targets as high as **₹295**, citing its zero-debt status and surging project margins.

Gold and Silver Prices Subside Amid Strengthening Dollar and Evolving Fed Rate Expectations
Market Brief: Gold Sector Outlook The gold market entered **February 2026** showing remarkable resilience after a historic rally that dominated the previous year. Following a surge of nearly **70%** in **2025**, the metal continues to navigate a landscape of high valuations and shifting macroeconomic triggers. While the pace of growth is expected to normalize, the structural foundation for bullion remains firmly intact. Current Price Action As of **February 16, 2026**, domestic gold prices in India have stabilized after a volatile start to the month. 24K gold is currently trading near **₹15,774 per gram**, translating to approximately **₹1.57 lakh per 10 grams**. This follows a brief dip from the **February 1** high of **₹16,073 per gram**. In the international arena, spot gold is holding steady above the psychological barrier of **$5,000 per ounce**. Despite a corrective phase that saw prices retreat from a January peak of **$5,626 per ounce**, global markets remain constructive. Investors are closely monitoring support levels near **$4,900**, with many analysts forecasting a push toward **$5,200** or higher by the final quarter of the year. Core Market Drivers The current price floor is reinforced by three primary pillars of demand: * **Central Bank Accumulation:** Emerging market central banks continue to diversify away from the dollar. Net purchases are projected to average **190 tonnes per quarter** throughout **2026**, maintaining gold's status as the second-largest reserve asset globally. * **Monetary Policy Easing:** Anticipation of further interest rate cuts by the U.S. Federal Reserve—estimated at **75 basis points** for the year—is reducing the opportunity cost of holding non-yielding bullion. * **Retail and ETF Inflows:** Physical demand remains robust, particularly in India where the ongoing wedding season supports local premiums. Simultaneously, gold ETFs are seeing consistent inflows as investors seek hedges against record-high global debt levels. Strategic Outlook The technical structure for the remainder of **Q1 2026** suggests a period of consolidation. While the broader trend is bullish, the market is currently working through a "sell on rise" sentiment in the short term. Key resistance is identified at the **₹1,58,000** zone for domestic futures; a decisive break above this level would likely signal the resumption of the primary uptrend. Market participants are advised to watch for upcoming U.S. inflation data and GDP readings, which will serve as the next major catalysts for price direction. For now, the transition of gold from a passive reserve to an active financial engine is accelerating, with high valuations significantly enhancing the collateral value for physical holders and institutional investors alike.

Indian IT Stocks Under Analysis by JPMorgan Following Eight-Session Decline
The Indian IT sector is navigating a period of intense volatility as of February 2026. Heavyweights Wipro and Infosys have faced significant selling pressure, with both stocks recently hitting new 52-week lows. This downturn follows a massive wipeout that saw the Nifty IT index plunge approximately 19% over just eight trading sessions earlier this month. Wipro is currently trading near 214.10, marking a sharp decline of 19% within the last 30 days. Similarly, Infosys has retraced to roughly 1,369.50, down 14% over the same period. This sector-wide correction has been fueled by a combination of global macroeconomic headwinds and resurfacing anxieties regarding artificial intelligence disruption. The primary concern among investors is "revenue deflation." There are growing fears that AI tools, which can now automate complex legal, coding, and maintenance tasks, will erode the traditional labor-linked billing models that have long sustained Indian IT firms. Analysts have warned that automation could lead to pricing pressure, particularly in application services which account for up to 70% of industry revenue. Despite the recent sell-off, a recovery narrative is beginning to take shape. Industry body Nasscom and major analysts suggest that while AI disrupts old models, it simultaneously creates a new standard for "AI-led development." Firms are transitioning from time-based billing to outcome-based pricing, where clients pay for measurable efficiency gains. Wipro’s latest Q3 FY26 results highlight this operational stabilization. The company reported a 1.4% sequential growth in constant currency terms, with IT services operating margins improving to a multi-quarter high of 17.6%. Although reported net profit dipped to 31.2 billion due to one-time labor code expenses, underlying cash flows remain robust at 42.6 billion. Infosys has similarly shown resilience by raising its full-year revenue growth guidance to a range of 3% to 3.5%. While its Q3 net profit saw a minor year-on-year dip to 66.66 billion, its core revenues jumped nearly 9% to 45,479 crore. These figures suggest that while the market is reacting to long-term AI threats, the current demand for enterprise transformation remains steady. Valuations for these giants have become increasingly attractive following the correction. Infosys now trades at a price-to-earnings (P/E) ratio of approximately 19.2, while Wipro is positioned even lower at 16.9. These multiples are significantly more affordable than mid-cap peers, leading some analysts to view the recent price drop as a value-buying opportunity rather than a structural collapse. The sector's focus has shifted toward "applied AI" and modernization. Rather than building foundational products, Indian IT firms are excelling at integrating AI into existing enterprise systems. Early estimates suggest that AI-driven automation could eventually boost operating margins by 200 to 400 basis points, helping the sector adapt to the changing technological landscape. [Infosys Stock Market Analysis](https://www.youtube.com/watch?v=J2QL5UL2nMs) This video provides a deep dive into the most recent earnings report and the strategic reasons why the company raised its growth guidance despite market volatility. http://googleusercontent.com/youtube_content/0

Manappuram Finance Shares Under Review Following RBI Approval of Bain Capital’s 41.66% Stake Acquisition
Manappuram Finance is currently a primary focal point for investors following the Reserve Bank of India’s final approval for Bain Capital to acquire a significant stake in the company. The central bank’s clearance, granted on February 13, 2026, paves the way for a massive capital infusion and a shift in the firm’s controlling structure. Bain Capital is set to invest approximately **Rs 4,385 crore** through its affiliates. The multi-stage transaction begins with an initial **18% stake** acquisition via preferential allotment of equity and warrants. This move has triggered a mandatory open offer to public shareholders for an additional **26%**, potentially bringing Bain’s total ownership to **41.66%**. The investment is priced at **Rs 236 per share**. Upon completion, Bain Capital will be reclassified as a promoter, exercising joint control alongside the existing founding team. This partnership is designed to modernize the lender's infrastructure, with a specific focus on scaling technology and enhancing risk management protocols. In the markets, Manappuram’s stock reflected high volatility and heavy trading volume following the news. As of February 16, 2026, the share price was trading around **Rs 302.70**, showing a slight intraday dip of **1.94%** as the market priced in the regulatory developments. Despite recent fluctuations, the stock has delivered a robust **56.32%** return over the past year. The company's financial health remains steady but faces margin pressures. For the quarter ending December 2025, Manappuram reported a consolidated net profit of **Rs 381 crore**, a year-on-year decline of **15.9%**. However, revenue from operations grew by **6.5%** to reach **Rs 1,915.35 crore**, indicating sustained demand for credit products. The broader gold loan sector is currently benefiting from historic highs in bullion prices. Domestic gold recently surged to a milestone of **Rs 1,60,540 per 10 grams**. This appreciation has significantly boosted the Loan-to-Value (LTV) output, allowing borrowers to access higher capital amounts against the same quantity of gold assets. Industry analysts project the gold loan market to grow at a compound annual rate of over **4%** through 2033. Demand is increasingly shifting toward digital platforms, with urban professionals and small business owners adopting gold loans as a strategic liquidity tool rather than just an emergency resource. For Manappuram, the entry of a global private equity giant like Bain Capital is expected to accelerate its "Lakshya 2026" roadmap. The goal is to transform the traditional gold loan provider into a diversified, tech-heavy financial services entity with an expanded pan-India branch network.

SEBI Approves BSE Focused Midcap Index Launch
BSE shares are positioned for significant volatility as the exchange introduces derivative contracts for its **Focused Midcap Index**. This move follows a formal approval from the Securities and Exchange Board of India (SEBI). The new derivatives strategy is designed to comply with recent regulatory shifts, specifically the **single weekly expiry rule** that limits exchanges to one benchmark for weekly contracts. Focused Index Mechanics The **BSE Focused Midcap Index** is a concentrated benchmark tracking the performance of the **top 20 companies** in the mid-sized segment. Selection is strictly based on free-float market capitalization. Unlike broader gauges, this index offers a targeted approach for institutional and retail traders. The exchange will facilitate: * **Monthly Index Futures** * **Monthly Index Options** * **Cash-settled** contracts expiring on the last Thursday of every month. Strategic Context and Performance The launch comes as the BSE stock demonstrates robust momentum. On **February 10, 2026**, the stock hit an all-time high of **3,154.10**, reflecting a single-session surge of **6.11%**. The exchange reported a massive **174% jump** in consolidated net profit for the December quarter, reaching **602 crore**. Revenue from operations surged **62%** year-on-year to **1,244 crore**. Market Outlook The introduction of midcap derivatives aims to capture a larger share of the futures and options (F&O) market. This is particularly relevant as the **BSE Midcap Index** has shown resilience, rising **2.07%** in early February 2026 despite broader market fluctuations. Key institutional holdings in BSE have increased to **41.27%**, signaling high conviction in the exchange's expanding product suite. With standard weekly expiries now limited to the Sensex, the Focused Midcap derivatives provide a necessary alternative for hedging and directional strategies. Currently, the BSE stock trades near the **3,025** level, maintaining a **72% return** over the past year. Analysts note that the shift toward monthly contracts on concentrated indices may reduce speculative frenzy while providing higher-quality liquidity for mid-cap exposure.

Ola Electric Q3 Net Loss Narrows to Rs 487 Crore
Ola Electric Mobility has reported a significant narrowing of its consolidated net loss to **487 crore** for Q3 FY26, down from **564 crore** in the same period last year. This improvement comes despite a challenging environment where revenue from operations plummeted **55%** year-on-year to **470 crore**. The company is currently undergoing a strategic structural reset, moving away from chasing short-term sales volumes to focus on long-term fundamental health. Total deliveries for the quarter stood at **32,680 units**, a sharp decline from the **84,029 units** recorded in the previous year. This volume drop has been attributed to a slowdown in EV penetration and the need to address service execution issues. A standout metric in the latest report is the record consolidated gross margin of **34.3%**, reflecting a substantial jump of **15.7 percentage points** compared to last year. This margin expansion is driven by the company’s vertically integrated manufacturing model and the improved unit economics of its Gen 3 platform. Operating efficiency has become a central focus. Quarterly operating expenses were slashed to **484 crore** from a previous peak of **840 crore**. Management aims to further reduce these costs to between **250 crore and 300 crore** in the coming quarters. This cost discipline has effectively lowered the EBITDA breakeven point to approximately **15,000 units** per month. On the manufacturing front, the Gigafactory continues to scale. Cell production doubled quarter-on-quarter to **72,418 cells**, with the first commercial deployment of in-house **4680 Bharat Cells** reaching customers. The facility currently operates at **2.5 GWh** capacity, with a target to reach **6 GWh** by March 2026. Operational improvements are also visible in the service department. Through the "Hyperservice" initiative, service backlogs have been reduced from a peak of 14 days to roughly **7–8 days**. Approximately **80%** of service requests are now resolved on the same day. Market sentiment remains cautious as the stock traded around **30.90** following the announcement. While the revenue contraction is stark, the company maintains a long-term target of **15,000 to 20,000 crore** in annual revenue as it leverages its completed capex cycle and leaner operating model.

Weekly Market Outlook: Trading Strategies for Nifty, IT, and Defense Stocks
Market Outlook: February 16, 2026 The Indian equity market enters the third week of February facing a complex tug-of-war between strong foreign inflows and localized sector pressures. While the benchmark **Nifty 50** recently defended structural support levels, it remains in a consolidation phase following a volatile start to the month. Traders are navigating a "bifurcated" market where broader indices show resilience, but specific heavyweights—particularly in technology—face intense headwinds. Nifty 50 Technical Landscape The **Nifty 50** currently sits near a pivotal support zone. After a sharp 1.30% decline in the previous session to close at **25,471.10**, the index is testing immediate cushions between **25,450** and **25,400**. Failure to hold these levels could expose a deeper correction toward the **25,000** psychological mark, which aligns with the 52-week Exponential Moving Average (EMA). On the upside, a decisive move above **25,750** is required to neutralize the short-term bearish bias and target the **26,000** resistance barrier. Sector Performance and Rebound Potential The **IT Sector** has emerged as the primary drag on the market. The **Nifty IT index** plummeted over **8%** in the week ending February 13, 2026, hitting a 10-month low. This rout is largely attributed to global concerns over AI-driven disruption and shifting competitive dynamics. Despite this, some strategists view the current oversold conditions as a setup for a technical rebound, provided the index stabilizes above recent lows. In contrast, **Defence Stocks** have shown signs of stabilization. After a sharp post-Budget reset earlier this month, the **Nifty Defence index** gained approximately **3%** last week. Stocks like **Bharat Electronics (BEL)** and **Hindustan Aeronautics (HAL)** are consolidating as investors digest the FY27 capital outlay of **₹2.19 lakh crore**. This represents a healthy **21.8%** year-on-year growth in capital expenditure, supporting a positive long-term outlook for the sector. Foreign Inflows vs. Internal Volatility A significant tailwind for the market is the resurgence of **Foreign Portfolio Investors (FPIs)**. In the first fortnight of February 2026, FPIs injected **₹19,675 crore** into Indian equities, a sharp reversal from the massive outflows seen in 2025. This influx is driven by the recent **US-India trade deal** and cooling global inflation data. However, internal volatility remains high. The **India VIX** recently surged toward **15** before cooling, reflecting the market's sensitivity to tax changes in the derivatives segment and shifting sector weightage. Strategic Key Levels * **Nifty Support:** 25,400 / 25,000 * **Nifty Resistance:** 25,750 / 26,000 * **Bank Nifty Range:** 59,500 – 60,800 * **IT Index Status:** Bear market territory (down 13.7% in 2026) * **Defence Trend:** Consolidation with a 3% weekly recovery The upcoming sessions will likely focus on stock-specific action. While large-caps face pressure from the IT sell-off, the mid-cap and small-cap indices have recently outperformed, suggesting that domestic liquidity remains active in non-index constituents.

$61 Billion Merger Expected to Bolster Indian Credit Market
**PFC-REC Merger Update: India’s Power Lending Consolidation** The Indian government has officially initiated the merger of its two largest state-owned power lenders, Power Finance Corp (PFC) and REC Ltd. This strategic move, confirmed in February 2026, aims to create a unified financial titan to drive the country’s energy transition. The boards of both Maharatna companies have granted in-principle approval to the restructuring, following a vision outlined in the latest Union Budget to scale up public sector NBFCs. **Combined Financial Strength and Market Impact** The merger will create a single entity with a massive consolidated loan book estimated at approximately 11.5 trillion rupees (138 billion USD). This consolidation effectively pools resources to overcome previous lending bottlenecks. By combining their capital bases, the new entity can significantly increase its per-project lending limits. Under current regulatory norms, each firm was restricted to lending 30% of its Tier-1 capital to a single counterparty. The unified balance sheet allows for larger credit disbursements to massive, complex infrastructure projects that previously faced funding caps. **Market Liquidity and Bond Reallocation** A critical shift is expected in the domestic bond market. Together, the two entities have outstanding rupee bonds totaling 5.5 trillion rupees, representing nearly 10% of the local market. Institutional investors and money managers currently holding bonds from both PFC and REC may soon face regulatory exposure limits. Many funds are restricted from holding more than 10% of their assets in a single issuer. As the two issuers become one, investors will likely be forced to reallocate a portion of these holdings. This reallocation is expected to release significant liquidity into the market, as funds seek new high-quality assets to maintain their portfolios. **Key Performance Indicators and Sectoral Shift** The financial health of both lenders remains robust as they enter the merger process. For the quarter ended December 2025: - PFC reported a net profit of 6,292 crore rupees, up 8% year-on-year. - REC recorded a net profit of 4,052 crore rupees. - Consolidated net NPA (bad loans) has reached record lows of approximately 0.31% to 0.38%. The combined entity will feature a diversified lending mix: - 40% in Transmission and Distribution - 29% in Conventional Power Generation - 14% in Renewables - 17% in other infrastructure and emerging technologies **Looking Ahead** The merger is designed to eliminate "internal competition" between the two lenders and remove the "holding company discount" that historically affected PFC's valuation as REC's parent. While the final share swap ratio is pending independent valuation, market analysts anticipate a ratio near 8 PFC shares for every 9 REC shares. The new entity is positioned to lead financing for India's 2047 energy goals, with a specific focus on green hydrogen, energy storage, and nuclear projects. This consolidation marks the largest restructuring in India's non-banking financial sector to date.
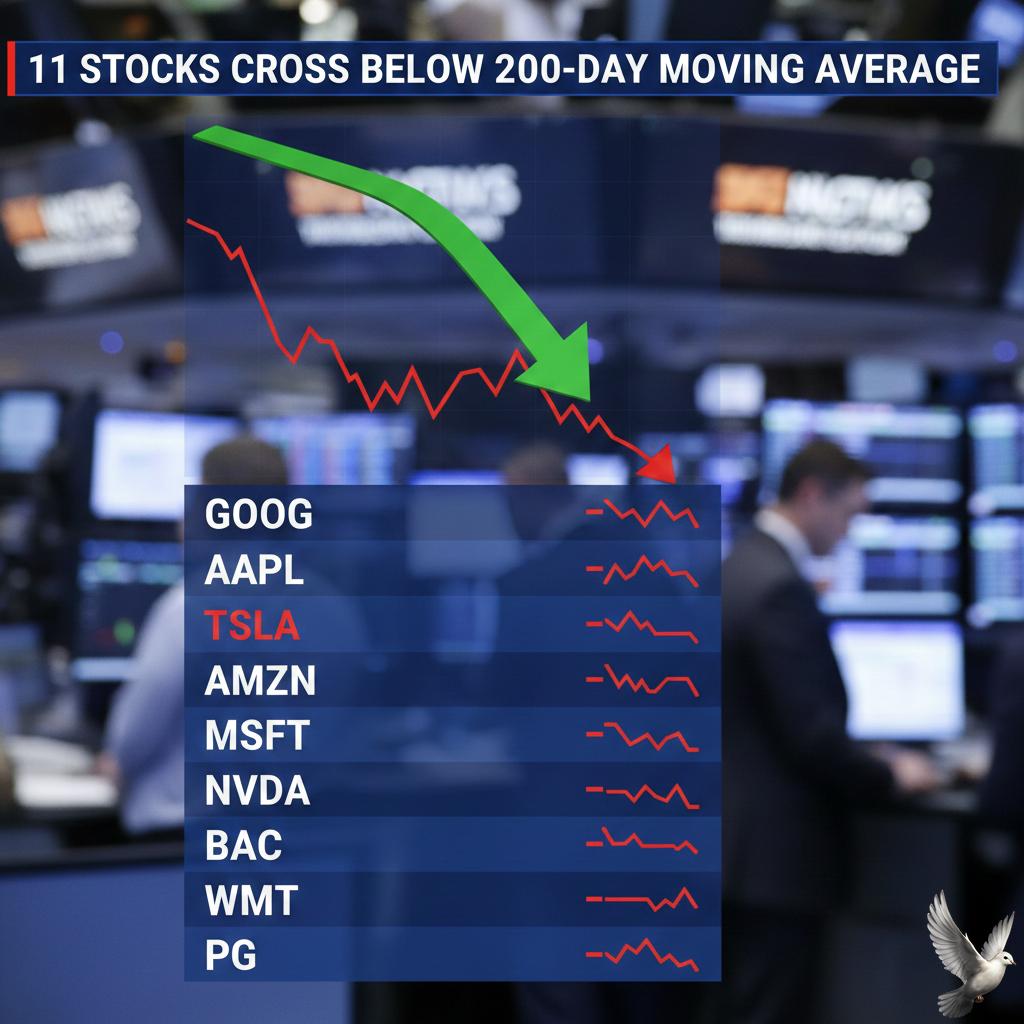
11 Stocks Cross Below 200-Day Moving Average
The Indian equity markets faced a significant technical breakdown on February 13, 2026, as the Nifty 500 index saw a notable surge in stocks slipping below their 200-day moving average (DMA). This critical long-term indicator was breached by 20 stocks within the pack, signaling a potential shift toward a bearish long-term trend. Broad-based selling pressure was evident as 11 of these stocks tumbled by more than 2% in a single session. Key names that crossed below the 200 DMA included Adani Green Energy, Bosch, Narayana Hrudayalaya, and One97 Communications (Paytm). This movement reflects a cooling of long-term momentum and growing caution among institutional and retail participants. The benchmark indices mirrored this weakness. The Nifty 50 plummeted 336 points to close at 25,471.10, while the BSE Sensex tanked 1,048 points to settle at 82,626.76. The Nifty IT index led the downward spiral with a weekly crash of 9%, marking its steepest fall since early 2025. This sell-off was largely attributed to mounting concerns over AI-driven disruptions in the technology sector. Market sentiment was further dampened by heavy selling from Foreign Institutional Investors (FIIs), who offloaded a net ₹7,395 crore. While Domestic Institutional Investors (DIIs) provided a cushion by purchasing ₹5,554 crore, the lopsided market breadth on the BSE 500—with only 66 advances against 434 declines—highlighted the depth of the risk-off mood. Volatility surged as the India VIX moved back above its 200 DMA, currently hovering around the 13.3 level. This spike indicates rising fear and uncertainty. From a technical standpoint, the Nifty 50 has slipped below its 20-day moving average for the first time in several sessions, with analysts identifying immediate support at the 25,000 to 25,060 range. Sectoral performance was almost entirely negative. The Metal sector plunged 3.3%, and the Nifty IT index fell over 5% in a single day. Only the Nifty Pharma and Media indices showed marginal resilience, managing to stay near flat or slightly positive in an otherwise bleeding market. Specific stocks under heavy pressure included Hindalco, which fell 5.7% following weak earnings, and Hindustan Unilever, which dropped 5.3%. In contrast, Bajaj Finance emerged as a top gainer, rising 2.5% on positive credit growth guidance, providing a rare bright spot in a volatile landscape. With the Nifty 500 yield currently at approximately 1.18%, the technical setup remains cautious. Investors are closely watching global cues and the impact of the US-India interim trade deal to see if the market can establish a base above the 25,000 level or if the breach of long-term moving averages will trigger further deleveraging.

Yen Softens and Dollar Stabilizes as Markets Evaluate Interest Rate Outlook
The Japanese yen is trading on the defensive today, currently hovering around **153.07** per U.S. dollar. This moderate decline of **0.2%** follows an exceptionally strong week where the yen surged nearly **3%**, marking its most significant weekly gain in over a year. Investor sentiment was recently bolstered by the removal of political uncertainty following Prime Minister Sanae Takaichi’s landslide election victory on February 8. However, fresh economic data has tempered that enthusiasm. Japan’s GDP expanded by a marginal **0.1%** in the final quarter of 2025, falling well short of the **0.4%** growth projected by analysts. On an annualized basis, the economy grew just **0.2%**, highlighting a fragile recovery that may delay aggressive rate hikes from the Bank of Japan. The U.S. dollar remains stable as market participants digest a cooling inflationary environment. Recent data shows the U.S. Consumer Price Index (CPI) rose **2.4%** year-on-year in January, the lowest level since May of last year. This figure came in below the anticipated **2.5%**, while monthly headline inflation eased to **0.2%**. Core inflation also edged down to **2.5%**, reinforcing the narrative of gradual disinflation. These soft inflation prints have intensified expectations for the Federal Reserve to shift its policy. While the Fed maintained interest rates at the **3.5% to 3.75%** range during its January meeting, the June session is now widely viewed as the primary window for a potential rate cut. Current market pricing reflects a high probability of a move in June, with some analysts forecasting up to four rate cuts by the end of 2026. This outlook is further complicated by the impending leadership change at the Federal Reserve, as Jerome Powell’s term is set to expire in May. The divergence between the two economies is clear. Japan faces high public debt and sluggish growth, while the U.S. is balancing a stabilizing labor market with cooling prices. In Tokyo, 10-year government bond yields remain elevated after hitting 27-year highs earlier this year, driven by Takaichi’s expansive fiscal plans, including a proposed **21.3 trillion yen** stimulus package. Thin liquidity is expected through the remainder of the day, as major markets in the U.S. and China remain closed for holidays. Traders are now focusing on whether the yen can maintain its recent recovery or if it will return to a weakening trend toward the **157** level seen earlier in the year.

Aye Finance Listing: GMP Trends and Market Debut Expected Today
NTPC Green Energy Limited (NGEL) is currently a focal point in the renewable energy sector following its major market debut. The company recently completed its IPO with an issue price of 108 per share. While early unlisted market signals showed a muted or even negative grey market premium (GMP), the stock has since established a significant presence on the secondary market. As of February 2026, the stock is trading around 127 on the BSE and NSE. This represents an appreciation of approximately 17.7% from its original issue price. This upward movement follows a listing day where the shares debuted at 111.50, a modest 3.2% premium that quickly gained momentum during the initial trading sessions. The company's financial performance provides a backbone for this market interest. For the third quarter of the 2026 fiscal year, NTPC Green reported a standalone profit after tax of 60.27 crore. Revenue for the same period reached 446.81 crore. These figures come as the company aggressively expands its operational footprint, recently adding 14.43 MW to its Khavda solar project in Gujarat, bringing its total installed capacity to approximately 8,827 MW. Strategic growth remains a priority for the management. The company successfully raised 1,500 crore through Non-Convertible Debentures (NCDs) to fund ongoing capital expenditure. This capital is slated for large-scale projects, including the development of Green Hydrogen Hubs and the expansion of solar and wind portfolios across India. Despite the positive price action, the market remains attentive to specific risk factors. The company carries a debt-to-equity ratio of roughly 1.91, and its revenue is highly concentrated, with a few major customers accounting for a significant portion of its earnings. Furthermore, about 60% of its current operating projects are located in Rajasthan, posing a geographical concentration risk. Investor sentiment is bolstered by the company's "Maharatna" parentage under NTPC Limited and its ambitious target to reach 60 GW of renewable capacity by 2032. Market participants continue to monitor the stock’s ability to maintain its current premium as it navigates the competitive and capital-intensive renewable energy landscape. [NTPC Green Energy IPO analysis](https://www.youtube.com/watch?v=GvZ5Yd_Qfr0) This video provides a detailed breakdown of the IPO's price band and market expectations during its initial launch period. http://googleusercontent.com/youtube_content/0

Fractal Analytics IPO: Shares to List on Stock Exchanges Today
IPO Market Intelligence: Listing Dynamics and Sentiment The initial public offering (IPO) landscape in early **2026** is defined by a shift toward valuation discipline and selective investor appetite. While the pipeline remains robust with over **190** companies aiming to raise approximately **₹2.5 lakh crore**, the immediate secondary market performance is being closely moderated by unofficial sentiment indicators. Gray Market Premium (GMP) continues to serve as a key, albeit unregulated, barometer for retail and institutional expectations. In recent sessions, a notable downward trend in premiums has been observed across several high-profile issues. For instance, **Fractal Analytics**, which initially commanded a premium of **₹180**, saw its GMP compress significantly to just **₹2.50**—a mere **0.28%** over its upper price band of **₹900**—just days before its scheduled debut on **February 16, 2026**. Listing Expectations and Risk Factors A flat or negative GMP typically signals weak demand or perceived overvaluation. **Aye Finance**, with an issue price of **₹129**, has seen its premium hit **₹0**, indicating a high probability of a par listing or a potential discount. Market experts suggest this cooling sentiment stems from a "behavioral shift" following significant losses in previous cycles. Investors are now prioritizing cash flows and business quality over speculative hype. * **Valuation Stress**: Mainboard issuers are facing intense scrutiny on Price-to-Earnings (P/E) ratios. * **Sector Divergence**: While AI and fintech remain popular, technology-heavy indices like the **Nasdaq** have seen recent volatility, shedding **2.10%** in a single week, which has dampened global sentiment for tech-led IPOs. * **Institutional Support**: Qualified Institutional Buyers (QIBs) are increasingly acting as the final anchor, often stepping in to stabilize stocks that face weak retail interest during the pre-listing phase. Broader Market Context The broader Indian market reflects this caution. As of **February 16, 2026**, the **Nifty 50** sits near the **25,471** level, following a **1.30%** drop in the previous session. The **BSE Sensex** also retracted significantly, losing over **1,000 points** to settle at **82,626**. This volatility in benchmark indices directly impacts IPO listing day performance. Even companies with strong fundamentals may struggle to achieve "pop" gains if the debut coincides with a broader market sell-off. In this environment, the transition from gray market speculation to official exchange trading is more precarious. Success is no longer guaranteed by subscription numbers alone; it now requires a convergence of sensible pricing, institutional backing, and stable macroeconomic conditions.

Fractal Industries IPO: GMP, Price Band, and Subscription Details as Offering Opens
Market Brief: De Neers Tools Performance Update De Neers Tools Limited has transitioned from its initial public offering phase into a period of significant operational growth and notable market volatility. The stock currently trades on the NSE SME platform under the ticker DENEERS, reflecting a market capitalization of approximately 128.24 crore. Current Price Dynamics The share price is currently positioned at 149.00, marking a 6.85% decline in the most recent trading session. The stock has experienced a wide trading range over the last year, reaching a 52-week high of 374.80 before retracing to a 52-week low of 132.00. This reflects a nearly 51% correction from its peak levels. Financial Performance Metrics The company reported a robust financial performance for the fiscal year ending March 2025. Total revenue climbed to 145.56 crore, representing a year-on-year increase of 30.45%. Even more significant was the growth in bottom-line profitability, with Profit After Tax (PAT) surging by 103.62% to reach 17.63 crore. Operational efficiency remains a core strength. The company maintains an Operating Profit Margin of 19.03% and an exceptional Return on Equity (ROE) of 32.65%. The Return on Capital Employed (ROCE) stands at 21.96%, supported by a manageable debt-to-equity ratio of 0.82. Key Corporate Developments Strategic expansion remains a priority for the management. In early 2026, the company secured a significant business update involving the supply of 20,000 tool kits to Polycab India Limited. Additionally, international growth is being targeted through the establishment of Deneers Tools Trading LLC in Dubai, specifically designed to drive export operations. Valuation and Shareholding The stock currently trades at a Price-to-Earnings (P/E) ratio of 8.14, which is significantly lower than the broader industry average of 45.31. The Price-to-Book (P/B) ratio is 2.11. This suggests the stock may be undervalued relative to its earnings growth potential. Promoter holding has seen a recent shift, currently standing at 47.54%, down from 62.38% in early 2025. Institutional participation includes Domestic Institutional Investors (DII) holding 8.80% and Foreign Institutional Investors (FII) with a 0.77% stake. The public and other categories hold the remaining 43.66% of the equity. Market Outlook While the stock has faced technical pressure—trading below its 100-day and 200-day moving averages of 175.44 and 207.50 respectively—the fundamental growth in revenue and net profit provides a stable baseline. Investors continue to monitor the company’s ability to leverage its new Dubai subsidiary and sustain the high margins achieved in the domestic hardware trading market.

Gold prices decline as U.S. dollar strengthens
Gold Market Brief: February 16, 2026 Gold prices experienced a marginal retreat on Monday, shifting into a consolidation phase following a volatile trading week. This minor dip follows a powerful **2.25%** surge witnessed last Friday, triggered by cooler-than-expected U.S. economic data. Recent labor and inflation figures have recalibrated market sentiment. While January non-farm payrolls showed a resilient increase of **130,000** jobs, headline consumer inflation slowed to **2.4%** year-on-year. This disinflationary trend has solidified expectations for the Federal Reserve to begin interest rate reductions, with markets now pricing in the first cut as early as July 2026. In international markets, spot gold is holding steady near the **$5,030** per ounce mark. Technical indicators suggest a neutral stance as the metal builds a base above the crucial **$5,000** psychological level. Despite the current pause, analysts maintain a bullish long-term outlook, with some institutional forecasts projecting prices to reach **$5,400** to **$5,800** by late 2026. On the domestic front, MCX Gold futures for April delivery are trading near **₹1,57,890** per 10 grams. Retail prices in major Indian cities reflect this stabilization, with 24K gold averaging **₹15,789** per gram. Market participants note that while the blistering pace of 2025 has slowed, structural support remains high. Central bank activity continues to underpin the market floor. Global reserves have seen steady inflows, with emerging economies leading a de-dollarization drive. Annual central bank purchases for 2026 are projected to reach approximately **755 tonnes**, maintaining a significantly higher demand profile than pre-2022 averages. Investment via financial products is also surging. Indian gold ETFs recorded inflows of **$2.49 billion** in January alone, nearly doubling the previous month's demand. This shift toward digital and paper gold suggests that investors are increasingly utilizing price corrections as strategic entry points. The divergence between precious metals remains a key theme. While gold shows resilience, silver has faced more pressure, trading near **₹2,70,000** per kg on the MCX. Analysts attribute this to silver's higher sensitivity to industrial cycles and recent shifts in risk appetite across the technology sector. Looking ahead, the market remains focused on upcoming Federal Reserve commentary and global trade developments. Current price levels are viewed by many as a "healthy pause," allowing the market to absorb recent gains before attempting to challenge new record highs.
GIFT Nifty Signals Muted Opening for Indian Indices Amid Mixed Asian Cues
Global markets enter mid-February 2026 facing a landscape defined by cooling inflation, shifting trade policies, and a maturation of the artificial intelligence sector. While major indices show resilience, a clear divergence has emerged between resilient emerging markets and a consolidating US tech sector. **Global Indices and Equity Performance** As of February 16, 2026, the S&P 500 has faced recent pressure, retreating **1.4%** last week. This pullback is largely attributed to investor anxiety regarding high capital expenditure in the technology sector. In contrast, international markets have shown strength; Japan’s Nikkei rose sharply by **5%** following domestic political shifts, and the Australian ASX 200 gained **2.4%** on the back of strong banking sector earnings. Market capitalization trends indicate a rotation in leadership. Large-cap stocks, which dominated 2025, have entered a consolidation phase. Mid-cap companies are currently leading performance rankings as investors seek earnings resilience over high-valuation growth names. **Inflation and Interest Rate Trajectory** Global inflation is trending downward, though the pace of decline varies by region. In the United States, a benign January inflation print has led to a **16 basis point** fall in 10-year Treasury yields. Markets are closely watching the Federal Reserve for potential rate cuts later in 2026 as labor market softness builds. India has released its first retail inflation data under a new 2024 base year series, reporting a rate of **2.75%** for January 2026. This figure remains well within the central bank’s target band of **2% to 6%**, suggesting a stable domestic environment despite rising prices in precious metals. **Energy and Commodity Trends** The energy sector is navigating a supply surplus. Brent crude oil is currently trading with a downward bias, with forecasts averaging **$58** per barrel for 2026. This decline is driven by global production outstripping demand, providing a "tax cut" effect for the broader economy. In contrast, industrial metals required for the energy transition remain in high demand. Copper prices have stabilized between **$12,500** and **$13,000** per tonne. Precious metals show high volatility; silver has entered an overbought phase after a significant rally earlier in the year. **Technology and AI Maturity** The technology sector is shifting from "AI experimentation" to "AI maturity." Spending on AI infrastructure remains robust, but the market is now prioritizing "proof of impact" over hype. Enterprise focus has moved toward agentic AI systems and domain-specific models. While mega-cap platforms still hold significant influence, leadership is broadening to include chip-equipment makers and cybersecurity firms. However, high capital intensity remains a headwind, weighing on free-cash-flow conversion for the largest players. **Macroeconomic Outlook** Global GDP growth is projected to hold steady at **3.3%** for 2026. Trade dynamics are being reshaped by new tariff structures, particularly in the US, which are altering competitive advantages for exporters in sectors like wine, rice, and industrial goods. While debt servicing costs—now reaching approximately **5%** of GDP in the US—and geopolitical tensions remain primary risks, private sector adaptability and technology investment continue to provide a floor for global growth.

Kwality Wall's to list today following demerger from HUL
Market dynamics reached a pivotal milestone on **February 16, 2026**, as Kwality Wall’s (India) Limited officially debuted on the BSE and NSE. The listing marks the formal conclusion of the demerger from Hindustan Unilever Limited (HUL), establishing the country’s first pure-play listed ice-cream entity. The standalone company enters the market with a massive base of **2,34,95,91,262** equity shares. Existing HUL shareholders received these shares at a **1:1** entitlement ratio, based on the record date of December 5, 2025. This structural split aligns with a global strategy to isolate the capital-intensive ice-cream business from core FMCG operations. Brokerage estimates placed the initial valuation of the new stock between **₹50 and ₹55** per share. This pricing reflects a valuation of approximately **5x EV/sales**, notably lower than the broader FMCG sector’s **9x** multiple. The discount is attributed to the seasonal nature of the category and a current EBITDA margin hovering near break-even for the first half of the fiscal year. The Indian ice-cream sector is currently valued at approximately **$3.07 billion** in 2026. Experts project a robust **9.84%** CAGR through 2032, driven by a structural shift in taxation. The recent GST reduction from **18% to 5%** is expected to significantly boost affordability and volume recovery, particularly for "impulse" categories like Cornetto and Magnum. Parent company HUL’s latest financials for **Q3 FY26** highlight the impact of this transition. While consolidated net profit surged **121%** to reach **₹6,607 crore**, this figure was heavily inflated by one-off gains from the demerger. In contrast, net profit from continuing operations fell **30%** year-on-year to **₹2,118 crore**, weighed down by the implementation of new Labor Codes and exceptional costs. Operational data shows HUL maintaining a resilient core despite these shifts. Revenue from operations grew **5.7%** to **₹16,441 crore**, supported by an underlying volume growth of **4%**. The company’s EBITDA margin remains within the guided range at **23.3%**, though it faced a minor compression of **70 basis points** due to rising gross margin pressures. Post-demerger, HUL is pivoting toward "Channels of the Future," with a dedicated focus on quick commerce and premiumization. The separation allows the remaining entity to sharpen its focus on Home Care and Beauty & Wellbeing, which saw double-digit growth in premium segments during the December quarter. For Kwality Wall's, the path forward involves scaling a cold-chain network that already includes over **2 lakh** cabinets. The independent entity is expected to prioritize innovation in health-conscious and plant-based segments, which are currently the fastest-growing niches in the Indian market.