Bullish News
Collection
Asia Markets: Equities Steady as Weak Japan GDP Weighs on Yen
Market performance across Asia remains mixed as investors digest a cooling US inflation report that has recalibrated expectations for global interest rates. US consumer prices moderated to 2.4% in January, a decrease from 2.7% in the previous month. This represents the lowest inflation level since 2021 and has fueled a cautious debate over potential Federal Reserve rate cuts. While some analysts see room for a move in March, the broader market consensus has shifted toward a more definitive cut in July 2026. Japan's Nikkei 225 has experienced significant volatility following a historic rally. After hitting record highs above 57,000 last week—driven by a decisive political victory for the Liberal Democratic Party—the index closed Friday at 56,941.97, a decline of 1.21%. The Japanese Yen remains sensitive to intervention risks, currently trading near 156.5 against the US Dollar. Australian equities tracked lower at the end of the week, with the S&P/ASX 200 dropping 1.39% to finish at 8,917.60. Despite this daily dip, the index gained 2.40% over the full week. Sector performance was led by a 9.38% surge in Utilities and a 5.41% rise in Financials, while Healthcare and Technology faced steep sell-offs of 12.61% and 5.37%, respectively. Regional liquidity is tightening as several major markets enter the Lunar New Year holiday cycle. Mainland China is closed for the full week starting February 15, with South Korea, Hong Kong, and Singapore observing shortened trading hours or closures through February 19. This coincides with a market holiday in the United States, where exchanges are closed today, February 16, for Presidents’ Day. Commodities and digital assets are showing renewed movement amid the shifting rate outlook. Gold has rebounded to approximately 5,077 USD per ounce, while Bitcoin is stabilizing near the 68,800 USD mark after recent fluctuations. Oil prices remain steady, with Brent Crude holding near 69.33 USD as traders monitor global supply dynamics and geopolitical developments. The focus for the coming sessions shifts to critical employment and inflation data releases from Japan and Australia, which will provide further clarity on whether regional central banks will follow the Federal Reserve’s anticipated pivot toward easing.

Potential Legal Delays to National Stock Exchange IPO
NSE Market Update: IPO Outlook and Performance India's primary market remains on edge as the **National Stock Exchange (NSE)** navigates a fresh legal challenge. A writ petition filed on **February 10, 2026**, in the Delhi High Court has emerged as a significant hurdle. The petition contests the No-Objection Certificate (NOC) granted by the market regulator, SEBI, on **January 30**, which was intended to clear the path for the exchange’s long-delayed public listing. The legal dispute centers on alleged procedural violations regarding how derivative trades are adjusted during corporate actions. This development is particularly critical given that the NSE has been attempting to list since **2016**. While the exchange recently moved to settle historical disputes—including a **1,388 crore** settlement proposal for the co-location and dark fibre cases—this new litigation could once again stall the drafting of its red herring prospectus. Market Context and Benchmark Performance The exchange continues to operate against a backdrop of heightened market volatility. As of **February 16, 2026**, the benchmark **Nifty 50** is trading around the **25,471** level, reflecting a recent correction of approximately **1.3%**. Persistent global tech selling and significant foreign institutional outflows have pressured the indices, with FIIs recording a net sell-off of **7,395 crore** in the most recent session. Despite the legal roadblocks, NSE’s operational metrics remain dominant. The exchange recently implemented a revision in derivative lot sizes to align with higher trading volumes. For instance, the **Nifty 50** lot size was adjusted from **75 to 65**, and the **Bank Nifty** from **35 to 30**, effective from the **January 2026** series. Sectoral Trends and Upcoming Activity While the NSE IPO remains in a "wait-and-watch" mode, the broader primary market shows selective activity. New listings like **Aye Finance** and **Fractal Analytics** made their debut on **February 16**, even as global sentiment remains cautious. Investors are closely monitoring the Delhi High Court’s proceedings, as a favorable outcome is essential for the NSE to finally unlock value for its shareholders after a decade of regulatory and legal scrutiny. The exchange's financial health remains robust, with consistent growth in premium turnover across its derivative segments. However, the immediate focus for the board and potential investors is now firmly on the judicial clarification regarding derivative trade rules, which will determine if the IPO can proceed in the first half of **2026**.

GST Implementation Drives Largest Quarterly Corporate Revenue Growth in 18 Months
India’s corporate landscape is navigating a period of resilient growth and structural transition. Performance during the December quarter shows a steady expansion in revenues and profits, underpinned by landmark policy shifts and strengthening domestic demand. **Earnings and Profitability** Aggregate net profits for India Inc. rose 14% year-on-year to reach 3.37 lakh crore. While this highlights double-digit momentum, it reflects a slight deceleration from the 16.6% growth recorded in the previous year. Net sales grew by 5.9%, totaling 28.43 lakh crore, as companies balance volume growth against global cost pressures. **Sector Highlights** The Financial Services (BFSI) sector remains the primary engine of growth, contributing over 60% of total profit gains. Major lenders like State Bank of India reported a net profit of 21,876 crore for the quarter, a 14.1% increase. Asset quality continues to improve, with gross NPAs for leading banks dropping significantly, such as Bank of India’s reduction to 3.69%. The Automotive sector is seeing a divergent trend. While overall volumes grew by 10.8% to 77.98 lakh units, bottom-line growth remained muted at 1.75% due to aggressive discounting and operational costs. However, rural demand is surging, particularly in the two-wheeler and tractor segments, with tractor volumes jumping 20.1%. **Market Trends and Indices** There is a visible shift in investor preference toward the broader market. While the Nifty 50 has faced recent pressure, closing around 25,471, the Midcap and Smallcap indices are outperforming. Small-cap stocks recently saw a weekly gain of approximately 1%, driven by a domestic institutional investment inflow of 6,883 crore. **Macroeconomic Catalysts** GST reforms continue to formalize the economy and stimulate consumption. Following a major rate rationalization in September 2025 that slashed taxes on 375 items, gross GST collections reached a three-month high of 1.93 lakh crore in January 2026. This 6.2% growth indicates that increased consumption is successfully offsetting lower tax rates. **Future Outlook** Analysts project a real GDP growth of 6.4% to 7.2% for FY27, positioning India as the fastest-growing G-20 economy. This optimistic trajectory is supported by a significant India-US trade deal reached in February 2026, which is expected to provide tariff relief and boost export-linked MSMEs. Corporate earnings are anticipated to maintain a double-digit CAGR of 10.2% through 2027.

Emerging Markets and Precious Metals Positioned for Long-Term Growth According to Arvind Sachdeva
Emerging markets are transitioning into a significant long-term uptrend, marking a shift after years of relative stagnation. Market forecasts for 2026 suggest steady GDP growth of approximately 4% across these regions. This resilience is increasingly driven by stronger domestic fiscal management and a pivot toward new trade alliances as traditional global partnerships weaken. China has emerged as a high-conviction play for 2026. The MSCI China Index maintains a price-to-earnings valuation of roughly 12.6x, supported by an anticipated 15% increase in corporate earnings. Sentiment is bolstered by Beijing’s "anti-involution" policies, which aim to reduce unsustainable price wars and improve corporate margins. Analysts are particularly optimistic about the consumer discretionary sector, where earnings are projected to climb by 35%. Brazil remains a key tactical bet despite upcoming election volatility. The Ibovespa index recorded a gain of over 30% in recent cycles, and the country’s risk rating plummeted by more than 31%. While GDP growth is expected to moderate to 1.5% in 2026, the start of a monetary easing cycle—with the SELIC rate potentially falling to 11% by year-end—is viewed as a major catalyst for equity performance. India faces a period of cooling as the Nifty 50 trades around the 25,500 level. Recent sessions have seen the Sensex shed over 680 points, reflecting broader caution regarding high valuations and a slight decline in quarterly corporate revenues. Despite this, downside risk is estimated to be capped at roughly 2%, with investors awaiting a more favorable entry point following recent tax policy adjustments and currency fluctuations. Commodities are proving to be essential hedges in this shifting landscape. Gold has rebounded to approximately 15,790 rupees per gram for 24K, driven by bargain-hunting and its status as a safe haven. Silver futures are hovering near 285,000 rupees per kilogram, showing resilience alongside gold. In the energy sector, Brent crude is trading in a range between 67 and 75 dollars per barrel, though planned OPEC production increases in late 2026 may create future supply-side pressure. Skepticism is rising regarding the Artificial Intelligence trade. While global AI spending is forecast to reach a massive 2.5 trillion dollars by 2026, concerns over "malinvestment" are intensifying. Investors are rotating away from debt-funded infrastructure firms as capital expenditure expectations for hyperscalers climb toward 527 billion dollars. Markets are now entering what analysts call a "trough of disillusionment," where the focus is shifting from speculative potential to proven return on investment. The broader emerging market narrative is now one of selective growth. Attractive valuations and improving governance are drawing capital back to the East and South, even as technology-driven volatility tests the resolve of global investors.

Nifty Enters Range-Bound Trade Above 25,100 Support Level
Market Brief: Nifty Outlook and Sector Trends The Nifty 50 enters the current trading week on a cautious footing after closing the previous session at **25,471.10**, marking a decline of **1.30%**. The index has transitioned into a consolidation phase following its inability to sustain levels above the **26,000** psychological mark. Investor sentiment has been dampened by a sharp sell-off in the IT sector and higher-than-expected retail inflation data. January inflation was recorded at **2.75%**, the first reading within the **2%–4%** target range in several months, which has reduced the immediate likelihood of interest rate cuts. Key Technical Levels The index is currently navigating a range-bound environment with a slight bearish tilt in the short term. Traders are monitoring the following technical zones: * **Resistance:** Immediate hurdles are positioned at **25,700**, followed by the significant **26,000** mark. A decisive close above this level is required to reopen the path toward **26,250**. * **Support:** Strong downside protection is anticipated at **25,300** and **25,060**. A breach below these levels could signal a deeper correction toward **24,800**. Sector and Stock Highlights While the broader market remains under pressure, stock-specific action continues to offer opportunities. Banking and select pharmaceutical names have shown relative resilience compared to the technology sector. **Bajaj Finance** remains a top pick after gaining **3.09%** to close at approximately **1,024.75**. Despite a reported **6%** dip in quarterly net profit, the stock attracted buying interest as core income remains robust. **Torrent Pharma** has maintained a steady trend, trading near **4,078** with a monthly return of approximately **3.49%**. The company’s focus on high-margin segments continues to support its valuation. **Tata Motors** and the broader auto sector faced some profit booking, with shares trading lower alongside the index. However, analysts maintain a long-term positive view on the passenger vehicle segment as demand remains healthy. **Dr. Reddy’s Laboratories** and **L&T** are being watched for stability, as defensive buying often shifts toward these heavyweights during periods of high volatility. **Pricol** also remains on the radar for mid-cap participants looking for niche industrial plays. Market Sentiment Foreign Institutional Investors (FIIs) have been net sellers, offloading approximately **$4 billion** in equities in the first month of the year. Conversely, Domestic Institutional Investors (DIIs) and consistent SIP inflows, which remain at record highs, are providing a necessary cushion to the market. Market participants are advised to maintain a disciplined approach, focusing on quality stocks that have recently corrected. High volatility is expected to persist as global geopolitical cues and domestic macro data continue to evolve.

Market Analysis: Current Trading Outlook and Pre-Market Setup
Benchmark indices ended the session with significant losses as a persistent global technology rout continues to dampen investor sentiment. The Nifty 50 declined by 336 points to settle at 25,471, while the BSE Sensex plummeted over 1,048 points to close at 82,626. This downward spiral is primarily driven by escalating fears surrounding AI-led disruption. The technology sector has faced intense selling pressure, with the Nifty IT index marking its steepest weekly decline since early 2020. Market value totaling nearly $50 billion was erased from Indian IT firms this week alone. Market volatility has surged in response to these structural concerns. The India VIX, often referred to as the fear gauge, jumped 13.37% to reach the 13.29 level. This spike reflects growing anxiety among participants as they attempt to price in the long-term impact of artificial intelligence on traditional outsourcing business models. Heavyweight tech stocks led the losers' list, with Tata Consultancy Services dropping 2.11% to ₹2,692 and Infosys sliding 1.22% to ₹1,369. Other sectors also faced collateral pressure; Hindalco Industries fell 5.74% following disappointing earnings, and Hindustan Unilever dropped 4.34% due to cautious management commentary on future growth cycles. Despite the broad-based sell-off, select pockets showed resilience. Finance and banking stocks attracted some buying interest as investors rotated away from tech. Bajaj Finance emerged as a top gainer, rising 2.57% to ₹1,024, supported by strong credit growth guidance. State Bank of India also managed a marginal gain of 0.52%. Analysts are currently advocating for a highly selective and risk-managed approach. The market is expected to remain range-bound in the near term, specifically between the 25,300 and 26,000 levels for the Nifty. Immediate support is identified at 25,400, and any breach below this could trigger further downside toward the 25,000 psychological mark. Investor focus is now shifting toward upcoming macroeconomic signals and the sustainability of corporate margins amid rising AI investment costs. Until clearer policy or industry trends emerge, the prevailing "sell on rise" sentiment is likely to dominate the trading floor.

Global Markets: Chinese Stocks Decline Amid Weak Earnings Outlook
Market Brief: China’s Economic Outlook February 2026 The Chinese stock market is entering the Year of the Horse under a cloud of cautious sentiment. Recent data indicates a significant disconnect between 2025’s policy-driven rally and current corporate fundamentals. Fourth-quarter earnings for over **2,000** mainland-listed A-share companies show a sharp downturn. Negative alerts outnumber positive ones by **14.8%**, a steep climb from the **4.8%** net negative rate seen in mid-2025. Smaller firms in the real estate and consumer sectors are bearing the brunt of this decline. Economic Pressure and Deflation Wider economic indicators confirm a cooling trend. GDP growth slowed to **4.5%** in the final quarter of 2025, marking the weakest pace since late 2022. Deflationary pressure persists as Producer Prices fell **1.4%** in January **2026**. This extends a multi-year streak that continues to squeeze corporate profit margins and limit pricing power. Lunar New Year Spending While the **9-day** Lunar New Year holiday usually provides a spark, experts remain skeptical of its impact this year. Consumer Price Inflation (CPI) slowed to **0.2%** in January. Early reports show a surge in holiday-themed cultural products and local travel, with passenger traffic up by more than **5%**. However, the scaling back of government "trade-in" stimulus programs has created significant headwinds for broader consumption. Market Divergence Stock performance is splitting by sector. While the MSCI China Index has gained only **0.8%** so far in **2026**, specific industries are thriving: * **Artificial Intelligence:** Companies like Iflytek have reported profit jumps between **40%** and **70%**. * **Commodities:** Preliminary net income for mining firms like CMOC rose by approximately **50%**. * **Tech Inflows:** Foreign interest persists in specialized areas, with South Korean investors injecting **$92.5 million** into Hong Kong-listed tech and AI stocks this year. In contrast, electric vehicle makers like BYD and Great Wall Motor have seen share prices slump following underwhelming January sales figures. Outlook for 2026 The CSI 300 Index has climbed roughly **20%** over the last **12 months**, but momentum is stalling. The index opened at **4,693.41** today, reflecting a market that is waiting for more aggressive fiscal support. Beijing has allocated **2.05 billion yuan** for New Year consumption vouchers to stimulate demand, yet structural challenges in the labor market and a stagnant property sector continue to weigh on the long-term recovery.

Growth in AI-Related Derivative Instruments Amid Market Volatility Concerns
Major technology companies have entered an unprecedented era of debt-funded expansion, with capital expenditure projections for the "Big Five" hyperscalers—Amazon, Alphabet, Microsoft, Meta, and Oracle—climbing toward **$650 billion** for 2026. This represents a staggering **60% increase** from 2025 levels. As these firms move away from their historical reliance on internal cash flows to fund growth, the credit markets are undergoing a fundamental transformation. Debt investors are increasingly utilizing credit default swaps (CDS) to manage the heightened risks associated with this massive infrastructure build-out. Activity in the credit derivative market has surged, particularly for single-company contracts. For instance, the cost of insuring Oracle's debt through 5-year CDS more than tripled in late 2025. Similar trends are visible for Meta and Alphabet, as the market seeks protection against potential execution risks and the sheer volume of new bond supply. The tech sector issued over **$200 billion** in investment-grade bonds during 2025, a record-breaking figure that dominated global credit markets. Projections suggest that the industry may need to issue as much as **$1.5 trillion** in new debt over the next several years to sustain the construction of data centers and the acquisition of advanced GPUs. This shift is beginning to widen credit spreads, as the market adjusts to the reality of higher leverage ratios among companies that were once considered cash-rich fortresses. Market sentiment in early 2026 has been marked by significant volatility following these historic spending announcements. Amazon recently disclosed a **$200 billion** capital plan, while Alphabet guided toward a range of **$175 billion to $185 billion**. These figures have fueled a "Capex-to-FCF" gap, where infrastructure spending now consumes roughly **94%** of operating cash flow after dividends and buybacks for certain leaders. While AI-driven revenue is growing—with AWS and Google Cloud reporting strong quarterly gains—investors remain focused on the timeline for a full return on investment. The concentration of AI-related debt now accounts for approximately **18%** of the aggregate corporate bond index. This concentration means that any shift in the credit health of a few major tech players now has a direct and outsized impact on the stability of the broader global fixed-income market.

FPIs Reduce Short Positions While Maintaining Neutral Stance
Market Brief: FPI Derivative Trends and Indian Equity Outlook Overseas fund managers are recalibrating their stance on Indian equities as the market enters mid-February 2026. While extreme bearishness seen in late 2025 has begun to thaw, Foreign Portfolio Investors (FPIs) maintain a defensive posture in the derivatives segment. The Long-Short Ratio for Nifty futures continues to fluctuate, reflecting a tug-of-war between improving domestic sentiment and persistent global headwinds. Capital Flows and Recovery Signs The first fortnight of February 2026 marked a significant turnaround in cash market activity. FPIs pumped **₹19,675 crore** into Indian equities up to February 13, a sharp reversal after a combined exit of over **₹62,000 crore** during December and January. This buying interest was largely catalyzed by a breakthrough Indo-US trade deal, which saw effective tariffs on key imports slashed from **50% to 18%**. Despite this influx, derivative data reveals underlying caution. On February 13, FPIs recorded a net sell-off of **₹7,395 crore** in a single session. Index futures saw a daily volume of **15,842 buy contracts** against **16,837 sell contracts**, indicating that overseas players are still hedging aggressively against potential downside risks. The "Anthropic Shock" and IT Volatility A primary driver of the current derivative caution is the ongoing uncertainty surrounding the "AI trade" on Wall Street. The Nifty IT index plunged **8.2%** in the second week of February, suffering what analysts call the "Anthropic shock." This volatility stems from fears that rapid AI advancement is disrupting the traditional headcount-based revenue models of Indian IT majors. * **Nifty 50 Level:** **25,544.60** (as of mid-Feb 2026) * **India VIX:** **14.45**, up **1.83%**, signaling rising near-term anxiety. * **Currency Factor:** The Rupee is hovering near **90.50 per USD**, stabilizing after hitting lows of **92.10** earlier in the year. Regulatory and Macro Overhangs The Union Budget 2026 has introduced new friction points for derivative traders. The Securities Transaction Tax (STT) on futures was raised to **0.05%**, a **150% increase** that has significantly altered the cost-benefit analysis for high-frequency FPI arbitrageurs. Domestic Institutional Investors (DIIs) remain the market's primary shock absorbers. While FPIs sold heavily on February 13, DIIs countered with a net purchase of **₹5,553.96 crore**. This internal liquidity provides a floor for the market, even as global funds retain short positions to protect against further tech-led sell-offs in the US. The Nifty currently finds crucial support in the **25,300 to 25,400** zone. Until the FPI Long-Short Ratio shows a sustained move above the **40-45%** mark, the market is expected to remain in a consolidation phase characterized by stock-specific action rather than broad-based momentum.

RBI Reintroduces Default Loss Guarantee Scheme for NBFCs
In a major regulatory pivot effective February 2026, the Reserve Bank of India (RBI) has restored the ability of Non-Banking Financial Companies (NBFCs) to use Default Loss Guarantees (DLG) when calculating loan loss buffers. This decision reverses previous restrictions and allows lenders to factor in these guarantees—typically provided by fintech partners—to offset potential losses, provided they are an integral part of the loan arrangement. The move provides immediate balance sheet relief for the shadow banking sector. Under the updated framework, NBFCs can now reduce their provisioning requirements, which had ballooned following a May 2025 directive that forced many to set aside full provisions regardless of third-party guarantees. This change is expected to free up significant capital for fresh lending as the industry heads into the final quarter of the fiscal year. Market data as of mid-February 2026 shows a resilient trajectory for the sector. Total bank credit in India has surpassed the 200 lakh crore milestone, with NBFCs now managing assets (AUM) projected to reach 50 lakh crore by March 2027. Currently, NBFC credit is expanding at an estimated rate of 15% to 17% for FY26, significantly outpacing traditional bank credit growth. Key performance indicators across specific segments remain strong. Vehicle finance continues to lead with 18% year-on-year growth, while diversified financiers have reported a 22% increase in AUM. Gold loan portfolios are also witnessing a surge, with some providers seeing growth as high as 30% to 35% as they capture market share from unorganized sectors. The RBI’s decision on DLGs coincides with new co-lending directions that took effect on January 1, 2026. These rules have standardized the minimum loan retention at 10% for all partners, down from the previous 20% for NBFCs. By harmonizing DLG usage with these co-lending models, the regulator aims to improve credit flow to under-penetrated retail and MSME segments. While the provisioning pressure has eased, the RBI has emphasized transparency. Lenders must update loss estimates every time a guarantee is invoked, as the protection decreases with each use. Furthermore, all DLG arrangements must now be reported on the RBI’s CIMS portal to ensure strict oversight of risk-sharing between NBFCs and their digital lending service providers. Profitability outlooks for the sector have turned optimistic following this update. After seeing a sharp dip in profits during FY25 due to extra DLG-related buffers—some firms reported profit drops of 22% to 44%—analysts now expect a reversal of these provisions. This capital infusion is likely to support the targeted 21% CAGR in earnings projected for the broader NBFC universe through 2028. [RBI DLG Framework Update](https://www.youtube.com/watch?v=tBvstdNcrvw) This video provides an expert breakdown of the latest regulatory shifts and credit growth trends affecting the Indian financial sector in 2026. http://googleusercontent.com/youtube_content/0
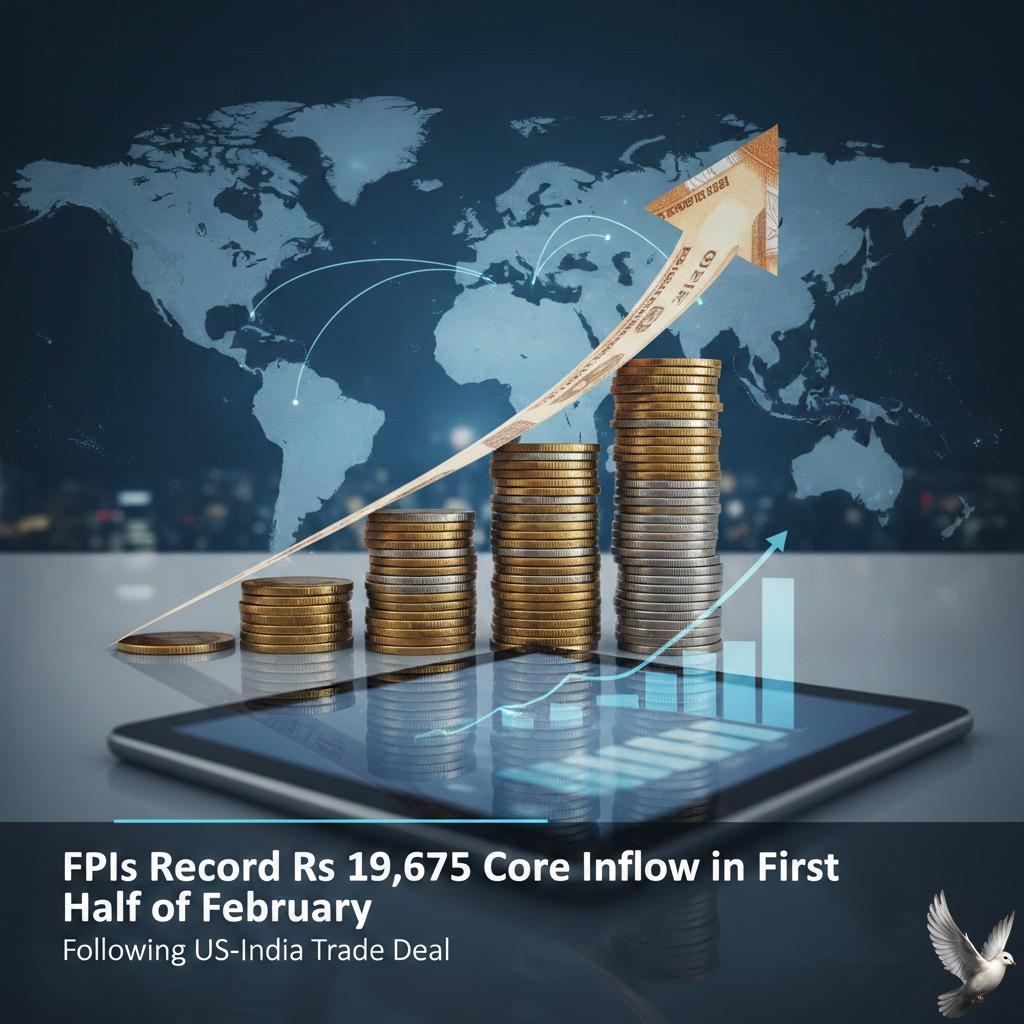
FPIs Record Rs 19,675 Crore Inflow in First Half of February Following US-India Trade Deal
Foreign Portfolio Investors (FPIs) have made a decisive return to Indian equities, marking a sharp reversal from three consecutive months of heavy selling. In the first week of February 2026, foreign funds infused a net **₹8,129 crore** into the cash market. This turnaround follows a massive exit in January 2026, where FPIs withdrew **₹35,962 crore**. The primary catalyst for this shift is the landmark trade agreement between the United States and India. Under the new framework, the US has reduced tariffs on Indian imports from levels as high as **50%** down to **18%**. In exchange, India has committed to purchasing over **$500 billion** in US energy and technology products over the next five years. Market sentiment is further bolstered by the Union Budget for FY26, which emphasizes fiscal discipline and a record capital expenditure plan. Although the government increased the Securities Transaction Tax (STT) on futures to **0.05%** and options to **0.15%**, the long-term focus on infrastructure and semiconductors has maintained investor interest. Domestic economic indicators remain a pillar of stability. The Reserve Bank of India (RBI) has kept the repo rate unchanged at **5.25%**, maintaining a neutral stance. Real GDP growth for the current fiscal year is projected at **7.4%**, positioning India as one of the fastest-growing large economies globally. Currency dynamics have played a critical role in attracting capital. The Indian rupee has shown resilience, recovering from a low of **90.30** against the US dollar to stabilize around the **90.70** level. Analysts anticipate the currency could appreciate below **90.00** by March, which would further enhance returns for foreign participants. Sectoral activity reveals a clear preference for export-oriented industries and financials. Banking and large-cap stocks are seeing the highest institutional interest. Meanwhile, sectors like textiles, chemicals, and auto ancillaries are gaining traction as they become more price-competitive in the US market due to the new trade terms. While the immediate outlook is positive, global macro concerns persist. Investors are closely monitoring US debt refinancing risks and fluctuations in global crude prices. Despite these headwinds, the combination of domestic growth and improved trade relations has effectively tilted the balance toward fresh foreign inflows.

Impact of Trade Agreements on India’s Economic Growth Model
India’s trade landscape has entered a transformative era characterized by high-speed global integration and a series of landmark free trade agreements. The nation is successfully transitioning from a domestic-demand-driven economy to a globally competitive manufacturing and services hub. Recent data underscores this shift as total exports reached a historic high of **$825.25 billion** in the last fiscal year, maintaining a growth momentum of **6%** despite global volatility. The recent finalization of the India-European Union Free Trade Agreement in January 2026 marks a historic milestone. This "deal of the century" provides duty-free access for over **99%** of Indian exports by value. It specifically targets labor-intensive sectors such as textiles and leather, where immediate duty elimination replaces previous tariffs of up to **16%**. Similarly, the newly implemented pact with the UK aims to double bilateral trade to **$120 billion** by 2030, offering Indian firms an estimated **₹4,000 crore** in annual savings through simplified social security contributions. Strategic management of the trade balance has led to a significant narrowing of the current account deficit, which moderated to approximately **0.7%** of GDP. This improvement is largely fueled by a powerhouse services sector, which grew by over **13%** to reach **$387.54 billion**. On the merchandise front, electronic goods have emerged as a primary driver with a staggering **39%** growth rate, signaling India’s rising prominence in the global technology supply chain. In North America, a recent interim trade framework with the United States has successfully reduced tariffs on Indian goods from **50%** to **18%**. This reset restores competitiveness for gems, jewelry, and pharmaceuticals while removing previous penalties related to energy sourcing. To maintain this momentum, the government has launched the **₹25,060 crore** Export Promotion Mission to streamline trade compliance and digitalize the export ecosystem through 2031. Foreign investment is increasingly tied to these trade milestones. The agreement with the EFTA bloc (Switzerland, Norway, Iceland, and Liechtenstein) includes a unique binding commitment of **$100 billion** in foreign direct investment and the creation of **1 million** jobs over the next 15 years. These inflows are shifting toward high-value manufacturing and renewables, positioning India as a stable alternative in the reconfiguration of global industrial networks. [India's International Free Trade Agreements](https://www.youtube.com/watch?v=5zWbEZ73lYw) This video provides a breakdown of India's evolving trade strategy and its growing influence as a trusted economic partner through new agreements and manufacturing reforms. http://googleusercontent.com/youtube_content/0

Market Outlook: 10 Key Factors for Monday’s Trading Session
Market Outlook: Nifty 50 Technical Brief The benchmark **Nifty 50** concluded the trading week on a defensive note, settling at **25,471.10** after a sharp single-day decline of **336 points** or **1.30%**. The index has officially slipped below its short-term moving averages, including the **20-day, 50-day, and 100-day** exponential moving averages (EMAs), signaling a distinct shift toward near-term weakness. This correction follows an unsuccessful attempt to sustain levels near the **26,000** mark, which has now emerged as a formidable resistance zone. Market participants are closely watching for a potential test of the **200-day Moving Average (DMA)**, currently situated near the **25,300** level. This threshold is considered a crucial structural cushion for the long-term trend. Key Support and Resistance Levels Volatility has resurfaced as the **India VIX** moved toward the **11.73** range. Technical analysts highlight a specific downside gap from previous sessions that the index is attempting to navigate. If the current selling pressure persists, the following levels are in focus: * **Immediate Support:** **25,400** to **25,450** * **Critical Floor:** **25,300** (200-DMA) * **Primary Resistance:** **25,800** * **Major Ceiling:** **26,000** Economic Indicators and Sector Performance The broader market sentiment is being shaped by a mix of cooling domestic inflation and shifting global liquidity. While benchmarks faced pressure, certain macroeconomic fundamentals remain resilient: * **GDP Growth:** Projected at **7.3%** for FY26. * **CPI Inflation:** Averaging a moderate **1.7%** for the April-December period. * **Forex Reserves:** Currently standing at **$717.6 billion** as of early February. * **Repo Rate:** Maintained at **5.25%** following cumulative cuts in 2025. Sector-wise, the **IT** and **Consumer** segments led the recent laggards, while the **Banking** sector showed relative resilience, holding near its **60,450** support base. Domestic institutional buying continues to provide a secondary buffer against foreign portfolio outflows, which were triggered by currency volatility and global interest rate trajectories. Short-Term Outlook The technical setup has turned cautious. The **Relative Strength Index (RSI)** has dipped to **46**, indicating fading upside momentum. As long as the index remains below the **25,800** mark, pullback rallies are expected to meet persistent selling pressure. A decisive breach below the **25,300** support could accelerate the corrective phase toward the **25,100** zone.
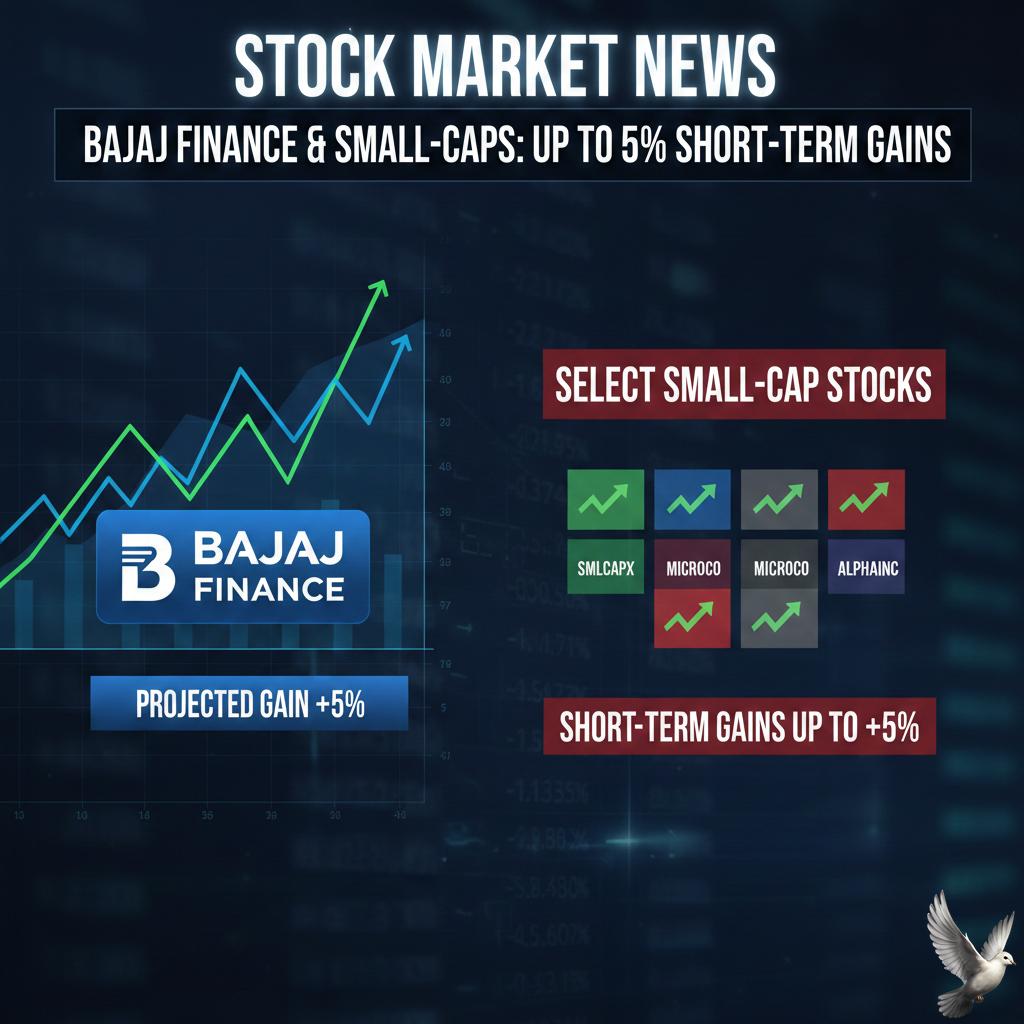
Bajaj Finance and Select Small-cap Stock Projected for Short-Term Gains of Up to 5%
Indian equity markets faced a turbulent end to the week as the **Nifty 50** plummeted by **336.10 points (1.30%)** to settle at **25,471.10**. This sharp downturn has pushed the index below critical technical thresholds, specifically its **20-day, 50-day, and 100-day** Exponential Moving Averages (EMAs). Rising volatility and broad-based selling, particularly in the technology and financial sectors, have dampened investor sentiment. Analysts at LKP Securities have highlighted that the breach of the 20-DMA has weakened the near-term structure. A sustained trade below the **25,400** mark could potentially open the doors for a further decline toward the psychological support level of **25,000**. Key Technical Levels The immediate resistance zone for the Nifty is now positioned at **25,600 to 25,650**. On the downside, a decisive break below the **25,300** level is viewed by technical experts as a trigger for accelerated downward momentum. Stock Highlights & Breakout Opportunities Despite the broader market weakness, select stocks are showing resilience and potential breakout patterns on their daily charts. **Kirloskar Oil Engines (KIRLOSENG)** The stock emerged as a notable performer, closing at **1,371.00**, up by approximately **2.54%** in the latest session. Trading near its 52-week high of **1,434.90**, it has delivered a staggering **104%** return over the past year. Analysts suggest monitoring this stock for a continuation of its bullish trend if it sustains above its immediate pivot of **1,236**. **Bajaj Finance (BJFN)** Bajaj Finance demonstrated relative strength, closing at **1,024.75** with a gain of **2.57%**. The stock has recently shown a price breakout, supported by a 7-day Simple Moving Average (SMA) of **1,009.64**. Technical strategists identify it as a "buy on breakout" candidate, with long-term targets positioned near the **1,100** mark, provided it holds its current support base. Global & Domestic Influence The domestic sell-off was exacerbated by a cautious global environment. Investors are closely monitoring the upcoming release of the **US Federal Reserve** minutes on **February 18, 2026**. Domestically, the finalization of the **India-EU Free Trade Agreement** and the announcement that EU banks may open up to **15 branches** in India over the next four years are expected to provide long-term structural support to the financial sector. Market participants are advised to maintain a range-bound strategy with strict stop-loss discipline as the index attempts to stabilize near the **25,300** support zone.
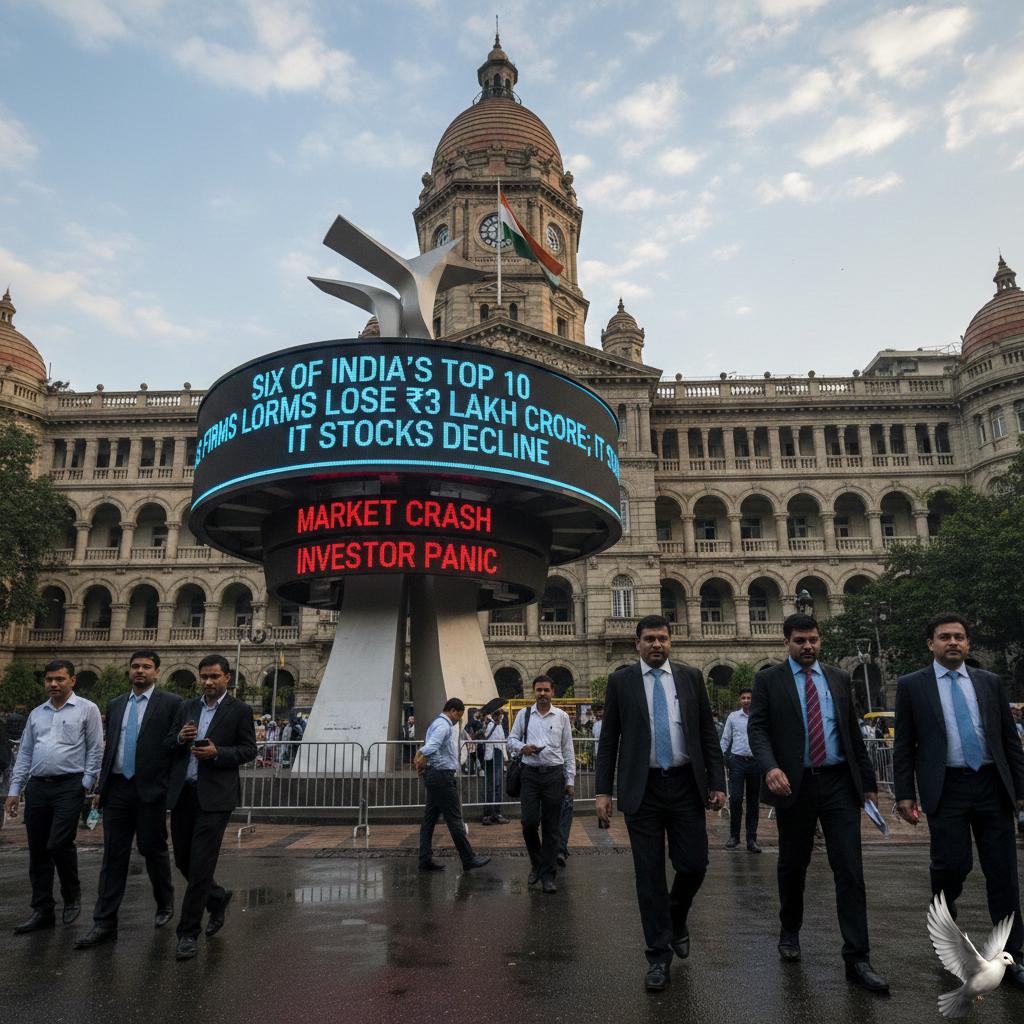
Six of India's Top 10 Most Valued Firms Lose ₹3 Lakh Crore in Market Capitalization; IT Stocks Lead Decline
Market Update: Top Valuations Erode Amid IT Rout The Indian equity market witnessed a significant contraction in the second week of February 2026. The combined market valuation of six of the top 10 most valued firms plummeted by more than **Rs 3.12 lakh crore**. This sharp erosion was primarily driven by a massive sell-off in the information technology sector, which faced structural concerns and global macro pressures. The benchmark BSE Sensex closed at **82,626.76**, recording a single-day drop of **1,048 points** or **1.25%** on Friday. Similarly, the Nifty 50 slipped **336 points** to end at **25,471.10**. Over the last two trading sessions of the week, investor wealth worth approximately **Rs 9.52 lakh crore** was wiped out across the exchange. IT Majors Lead the Decline Technology heavyweights emerged as the biggest laggards. Tata Consultancy Services (TCS) and Infosys saw their market capitalizations shrink significantly as the Nifty IT index tumbled nearly **5%** in a single session. **TCS** valuation dropped by over **Rs 1.10 lakh crore**, with its share price hitting a 52-week low near **Rs 2,750**. The company’s market cap fell below the psychological **Rs 10 lakh crore** mark during the week. **Infosys** followed a similar trajectory, with its market value eroding by approximately **Rs 75,000 crore**. The stock crashed over **6%** to trade near **Rs 1,299** as investors reacted to the shifting landscape of service delivery. Key Performance Indicators The downturn was not limited to the IT giants. Other major firms in the top 10 also saw substantial value erosion: * **Hindustan Unilever (HUL)** and **Eternal** saw valuations drop by nearly **4%** each. * **HCLTech** and **Wipro** recorded declines of **4.48%** and **3.64%** respectively. * **Tech Mahindra** slipped by **2.66%**, contributing to the broader sectoral drag. Triggers for the Bearish Trend The market sentiment was dampened by a combination of domestic and international factors. A primary concern for the technology sector is the "Revenue Deflation Risk" prompted by rapid advancements in automation. The launch of advanced autonomous agents by global startups has sparked fears of shrinking billable hours for traditional IT services. Externally, strong employment data from the United States has reduced expectations for early interest rate cuts by the Federal Reserve. This has kept US bond yields elevated, leading to significant capital outflows. Foreign Institutional Investors (FIIs) offloaded equities worth **Rs 7,395.41 crore** in a single day, far outstripping the **Rs 5,553.96 crore** in purchases made by domestic institutional investors. Sectoral Outlook and Valuations Despite the volatility, the broader market remains anchored by the financial sector. **Bajaj Finance** and **ICICI Bank** provided some support during the mid-week sessions, preventing a deeper collapse of the headline indices. The current correction is being viewed by analysts as a structural reset in valuations. While the IT sector navigates a transition toward intellectual property-led models, the total market capitalization of all BSE-listed firms now stands at approximately **Rs 465.46 lakh crore** ($5.13 trillion).

Groww CEO Highlights Domestic Demand as Key Driver for Hospital ETFs
The Indian hospital sector is entering a phase of high-growth transformation, projected to reach a market valuation of **$202.5 billion** by 2030. Current data indicates a steady compound annual growth rate (CAGR) of **11% to 12%**, fueled by a chronic infrastructure deficit and an urgent need to add approximately **1.5 million beds** over the next decade to meet global standards. Growth is no longer restricted to major metros. Approximately **55% to 60%** of new hospital capacity is now being developed in Tier-2 and Tier-3 cities. This decentralization is supported by a significant shift in revenue models, as more than **550 million Indians** are now covered by some form of health insurance. While insurance penetration is rising, about **70%** of the population still lacks comprehensive coverage, representing a massive untapped market for private players. Operational efficiency has become a primary performance metric for the industry. The Average Revenue Per Occupied Bed (ARPOB) for leading hospital chains has surged to an average of **₹49,304 per day**, with top-tier providers reporting figures as high as **₹74,000**. This spike is driven by a shorter Average Length of Stay (ALOS) of roughly **3.4 to 3.5 days** and a transition toward high-value, complex surgical procedures. Investor interest remains aggressive, particularly through specialized financial instruments. The Groww BSE Hospitals ETF, which recently opened its New Fund Offer (NFO) in February 2026, allows investors to track the **BSE Hospitals Index**. This index includes major constituents like Sun Pharma, Apollo Hospitals, and Max Healthcare. The hospital segment is increasingly viewed as a "pure-play" structural opportunity because healthcare demand remains non-discretionary. Medical tourism is also a critical revenue pillar. India currently ranks among the top **10 medical tourism destinations** globally, attracting over **7.3 million** foreign patients annually. Treatment costs in India remain **60% to 90%** lower than global averages, providing a distinct competitive advantage. Despite the positive outlook, the sector faces challenges from medical inflation, which is currently estimated at **14% annually**. To combat rising costs, hospital chains are maintaining healthy operating margins between **22% and 24%** through cost optimization and digital integration. Asset allocation remains a key theme for the year, with experts emphasizing the need to balance equity exposure in healthcare with defensive holdings in precious metals to navigate market volatility.
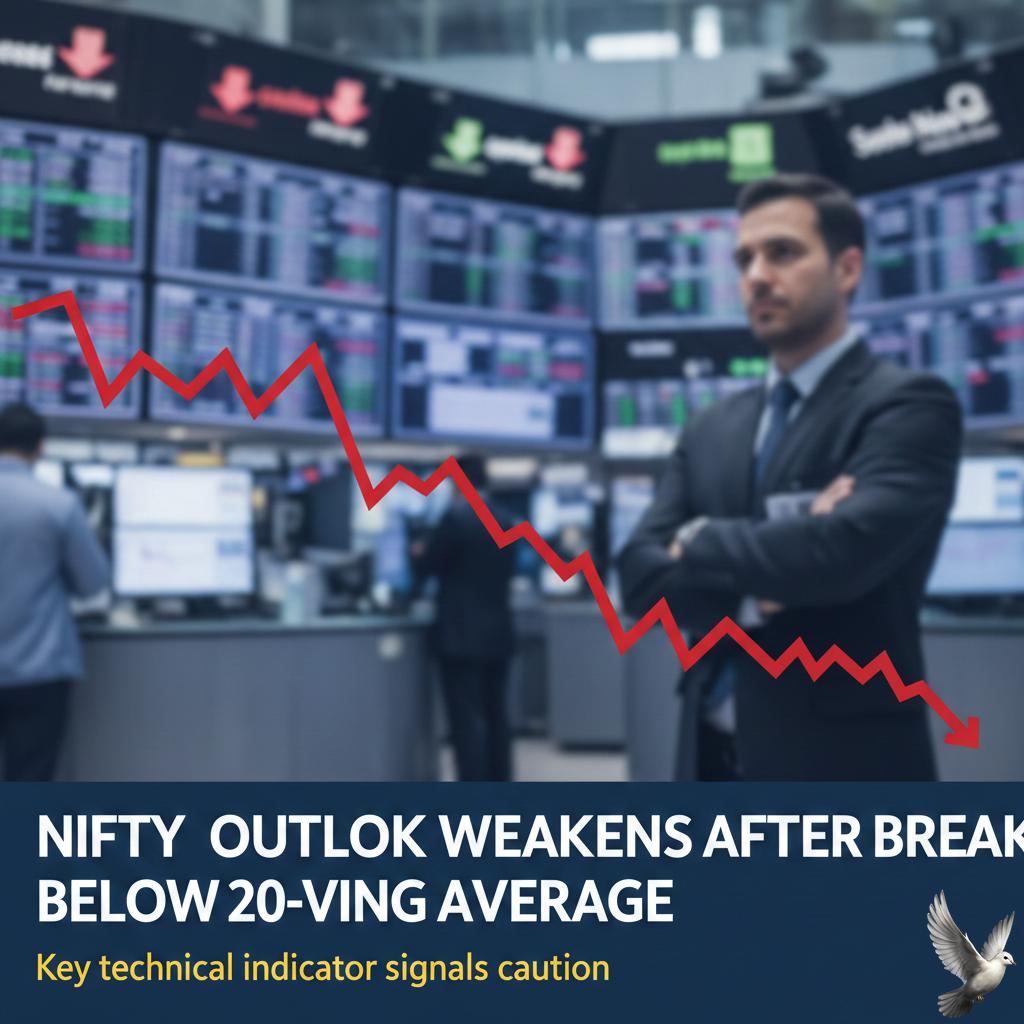
Nifty Outlook Weakens After Break Below 20-Day Moving Average
Market volatility has intensified as the Nifty 50 failed to maintain its upward momentum, ending the week on a sharply bearish note. The index slumped **336 points** to settle at **25,471** on February 13, 2026. This significant decline follows a breach of the 20-day moving average, a move that technical strategists at LKP Securities warn has severely weakened the near-term market structure. Investor sentiment was further dampened by the India VIX, which surged by **14%** during Friday’s session. This spike in the "fear index" reflects growing nervousness as the benchmark tested an intra-week low of **25,444**. The breakdown suggests a shift in the risk-reward ratio, with the immediate risk now skewed toward the **25,000** psychological support level. Selling pressure was broad-based, led by a massive rout in the IT sector. The Nifty IT index plunged nearly **5%** in a single day, as concerns over global tech valuations and the impact of AI on traditional business models intensified. Major laggards included Infosys, which dropped over **6%**, and Hindalco, down **5.8%**. Despite the overarching gloom, domestic institutional investors (DIIs) provided some cushion, infusing over **1,100 crore** into the market. However, this was not enough to offset the global risk-off sentiment. Market participants are now closely watching the **25,400** zone; a sustained break below this could accelerate the slide toward **25,200** or lower. Amid the volatility, technical experts suggest a highly selective approach. While the broader indices struggle, pockets of resilience are still visible. The banking sector, led by State Bank of India and select private lenders, has shown relative strength compared to tech and metals. Defensive plays in the FMCG sector and specific opportunities in defense stocks also remain on the radar for investors looking to weather the current correction. To regain a bullish posture, the Nifty must decisively reclaim resistance at **25,850** and **26,000**. Until these levels are surpassed on a closing basis, the bias remains cautious. Traders are advised to prioritize capital protection as the market undergoes this distribution phase.

Reliance Industries and Tata Steel Among Top 10 Stocks with Highest Retail Holding Decline in Q3
Market dynamics shifted significantly in the December 2025 quarter as retail investors adjusted their portfolios against a backdrop of record-high valuations and global economic shifts. Despite the Nifty 50 ending the year with a respectable **10.6%** gain to close at **26,129**, the quarter was marked by a strategic retreat of individual shareholders from several market heavyweights. The Nifty 500 witnessed a historic shift in ownership structure. Promoter holdings hit an all-time low of **48.8%** in December 2025, a sequential drop of **50 basis points**. During the same period, retail participation dipped to **12.1%**, down from higher levels earlier in the year. This space was largely filled by Domestic Institutional Investors, whose ownership reached a record **20.6%**. Public Sector Undertakings (PSUs) remained at the center of investor attention, though the retail base within them thinned. The Nifty PSU Bank index was the year's standout performer with a **28%** surge. However, individual investors engaged in heavy profit-booking across the sector. The following stocks saw the steepest declines in their retail shareholder base during the December 2025 quarter: **NTPC Ltd** led the exits with a reduction of **1.81 lakh** retail shareholders, as its base fell from **36.31 lakh** to **34.50 lakh**. **IDFC First Bank** followed closely, losing **1.74 lakh** individual investors, bringing its retail count down to **27.93 lakh**. **BHEL** and **Tata Power** recorded exits of **1.69 lakh** and **1.58 lakh** shareholders respectively. Both companies had seen significant rallies earlier in the year, prompting investors to lock in gains. **Indian Oil Corporation (IOC)** and **Yes Bank** each saw their retail bases shrink by approximately **1.5 lakh** participants. **Indian Railway Finance Corp (IRFC)**, a retail favorite for much of 2025, saw a reduction of **1.48 lakh** individual holders, ending the quarter with **51.23 lakh** shareholders. **Tata Steel** and **Reliance Industries** also featured in the top ten list of exits. Tata Steel lost **1.46 lakh** retail investors, even as the government imposed new import tariffs to support domestic steel prices. In the small-cap segment, a disconnect emerged between price and participation. While **35 out of 68** small-cap stocks delivered double-digit returns in the final quarter, retail holdings in these companies continued to slide. For instance, **SBC Exports** and **Force Motors** rallied over **120%** in the 2025 fiscal year, yet retail ownership in these names fell consistently for three straight quarters. Overall market sentiment remained cautious but resilient. While Foreign Institutional Investors pulled out over **₹1.61 lakh crore** in 2025, steady domestic inflows and a series of repo rate cuts by the RBI—bringing the rate down to **5.25%** by December—provided a necessary floor for valuations. [Indian Market Retail Trends](https://www.youtube.com/watch?v=P83_u2A_O48) This video provides a detailed breakdown of the Q3 FY26 earnings and investor shifts that shaped the market in late 2025. http://googleusercontent.com/youtube_content/0
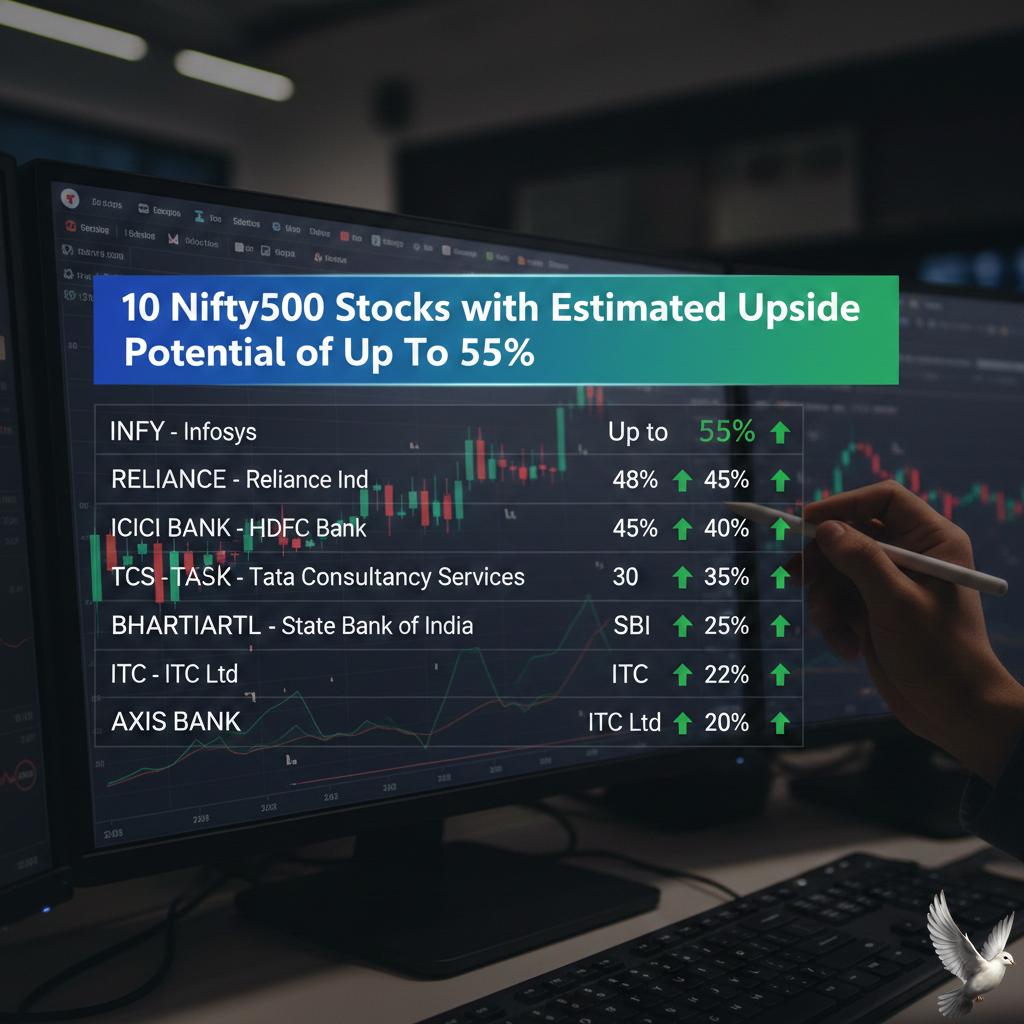
10 Nifty500 Stocks with Estimated Upside Potential of Up to 55%
The Indian equity markets are currently navigating a period of significant volatility, characterized by sharp sectoral shifts and evolving analyst sentiment across the Nifty 500. Recent data indicates a "bloodbath" on Dalal Street, with the Nifty 50 falling below the 25,500 mark. This downward pressure is largely attributed to heavy sell-offs in the IT sector, where global concerns regarding artificial intelligence disruption have dampened investor confidence. Market indices reflect this turbulence clearly. As of mid-February 2026, the Sensex has plunged over 1,000 points to settle near 82,595, while the Nifty 50 closed at 25,471.10, representing a 1.30% daily decline. The broader Nifty 500 has not been immune, though select pockets of resilience exist. Specifically, while the IT index tumbled 5%, the Financial Services and Consumer Durables sectors have managed to edge up, providing a fragile buffer against the wider market slump. Analyst consensus from Trendlyne suggests that strategic opportunities remain within the Nifty 500 for those looking beyond current volatility. Ten specific stocks have been identified based on sequential earnings growth and multi-analyst coverage. These companies are projected to offer upside potential ranging from 40% to 55% over the next 12 months. In the banking and financial space, State Bank of India (SBI) continues to hit near 52-week highs, recently trading at 1,198.60. Other notable performers include Bajaj Finance, which gained 2.57% to reach 1,024.75, and Shriram Finance, which holds steady at 1,065.80 despite broader selling pressure. Eicher Motors has also shown strength, rising 1.54% to 8,065.00, positioned just 0.67% away from its 52-week peak. Corporate earnings for the Nifty 500 show a nuanced recovery. While revenue growth has been modest at approximately 5.7% year-on-year, aggregate profit (PAT) for the Nifty 500 excluding the top 50 companies grew by a strong 20.7%. This indicates that mid-cap and small-cap constituents are currently driving profit momentum more effectively than their large-cap counterparts. Sector-wise, the Financials, Materials, and Industrials segments are expected to contribute nearly 62% of incremental earnings over the next two years. However, caution remains the dominant theme. The Earnings Revision Indicator (ERI) has dipped into negative territory for most sectors, reflecting more analyst downgrades than upgrades in the immediate term. Investors are closely monitoring the 25,400 support level for the Nifty, which remains a critical psychological and technical baseline for the current market structure.

Brookfield's Bruce Flatt Prioritizes Value Investing Over Market Trends for Long-Term Returns
Brookfield Asset Management is doubling down on value investing as global markets shift toward a multi-decade supercycle driven by digitalization, decarbonization, and deglobalization. CEO Bruce Flatt, who recently transitioned to Chairman of the Board as part of a long-term succession plan, continues to advocate for a disciplined approach that prioritizes durable cash flows over popular market trends. The firm enters 2026 with a massive **$188 billion** in deployable liquidity, allowing it to move aggressively where others hesitate. This capital strength follows a record-breaking 2025, during which the company raised **$112 billion** in new capital and achieved total assets under management exceeding **$1 trillion**. Distributable earnings reached a record **$5.4 billion** for the 2025 fiscal year, marking an **11%** increase year-over-year. A significant portion of this growth is tied to the accelerating demand for digital infrastructure. Brookfield recently launched a **$100 billion** AI infrastructure program to support the physical systems powering artificial intelligence. This includes a strategic **$20 billion** partnership to develop "AI factories" and data centers, tapping into a digital infrastructure market projected to grow from **$438 billion** in 2025 to over **$553 billion** by the end of 2026. In the real estate sector, management is shifting focus toward high-quality, supply-constrained markets. While traditional office demand remains selective, Brookfield is finding value in industrial logistics and secondary market growth. The company recently announced a **$1.2 billion** all-cash acquisition of Peakstone Realty Trust, a move designed to expand its industrial and warehouse platform. Infrastructure remains a primary pillar for the firm, specifically in the "all-and-any" energy approach. This strategy balances renewable power with nuclear and natural gas to meet the global surge in electricity demand. In 2025, the firm successfully monetized nearly **$80 billion** in assets, proving that high-quality real assets remain liquid and highly sought after even in a higher-cost environment. Institutional confidence in these sectors is rising, with global commercial real estate investment expected to hit **$144 billion** this year. By focusing on operational excellence and "disciplined transformation," Brookfield aims to capture this momentum. The company’s fee-bearing capital now stands at **$603 billion**, up **12%** from last year, supported by a recent **15% to 17%** increase in shareholder dividends. Investors are increasingly prioritizing assets with inflation resilience and compounding growth. For Brookfield, the path to lasting wealth remains rooted in the fundamentals: identifying essential infrastructure and real estate that form the backbone of the global economy.