Bullish News
Collection
Major Corporate Developments: M&M, LG, Lenskart, BHEL, Titan, and Shoppers Stop
Market Brief: Wednesday, February 11, 2026 Indian equity benchmarks maintained a positive trajectory during the mid-week session, with the **Nifty 50** trading firmly above the **25,950** mark. The **S&P BSE Sensex** showed similar strength, jumping approximately **327 points** to reach **84,393**. This upward momentum is largely supported by sustained optimism surrounding regional trade agreements and a steady inflow of foreign portfolio investment. The market sentiment remains "buy-on-dips" as the broader market breadth stays strong. The **S&P BSE Small-Cap** index outperformed the main benchmarks with a gain of **0.65%**, while the **Mid-Cap** index added **0.19%**. Volatility, as measured by the India VIX, remains stable in the **low-12** range, providing a calm backdrop for the ongoing Q3 earnings season. Auto and Consumer Focus The **Nifty Auto index** emerged as a top performer, rising **1.28%** to reach **28,148**. **Mahindra & Mahindra (M&M)** gained **1.6%** as group-linked units reported profit jumps exceeding **60%**, driven by robust volume gains. Other major players like **Maruti Suzuki** and **Bajaj Auto** also posted gains between **1.7%** and **1.9%**. **Titan Company** reported a stellar performance for the December quarter, with consolidated net profit surging **61%** to **1,684 crore**. Despite high gold prices, the company’s jewelry business saw a **42%** jump in revenue, reaching **22,517 crore**, fueled by strong festive and wedding demand. Corporate Actions and Disinvestment The government has officially launched its stake sale in **Bharat Heavy Electricals Limited (BHEL)**. The Offer for Sale (OFS) opened today, February 11, for non-retail investors, with the retail window opening tomorrow. The government aims to divest up to a **5% stake** (17.41 crore shares) at a floor price of **254 per share**. This move is expected to raise approximately **4,422 crore**. In the private sector, **Reliance Industries (RIL)**, through its FMCG arm Reliance Consumer Products, finalized the **100% acquisition** of **Southern Health Foods**. The deal, valued at **156.42 crore**, brings the popular "Manna" brand under the RIL umbrella. This acquisition significantly deepens RIL’s presence in the rapidly growing millet-based and health-focused food segments. Banking and Technical Outlook The **Nifty Bank** index is trading in a tight range around **60,700** during its weekly expiry. While private lenders like **Axis Bank** and **ICICI Bank** provided modest support, PSU banking stocks faced slight profit booking after recent rallies. Technical analysts identify near-term support for the Nifty 50 at **25,516**, while resistance is pegged at **26,351**. For the Bank Nifty, immediate resistance stands at **61,566**, with support levels holding at **59,687**. The Relative Strength Index (RSI) for major indices remains near **60**, suggesting that the current bullish momentum has further room to run as the earnings season nears its peak.

**Asian Stocks and Gold Rise Ahead of Global Jobs Data**
Market Overview: Asian Equities and Global Sentiment Asian markets are currently navigating record territory, with the **MSCI Asia Pacific Index** hovering near all-time highs. This momentum follows a significant surge in Japanese equities, where the **Nikkei 225** jumped **2.3%** to surpass **57,200** points. Investor confidence in the region has been bolstered by political shifts in Japan and Thailand, alongside a broader recovery in the technology sector. Despite the regional strength, global sentiment remains cautious as traders pivot their attention toward the United States. While Asian benchmarks reached new peaks, the **S&P 500** saw a slight retreat of **0.3%**, reflecting a "wait-and-see" approach ahead of critical labor market data. U.S. Economic Indicators and Fed Expectations Recent data has significantly altered expectations for Federal Reserve policy. U.S. retail sales for December unexpectedly stalled at **0.0%** growth, missing the **0.4%** increase forecast by economists. This stagnation suggests that high interest rates are finally curbing consumer appetite, providing the Fed with more room to consider easing. Markets are now pricing in higher odds of interest rate cuts in **2026**. Currently, money markets see a high probability of three cuts this year, with two already fully priced in. The **10-year Treasury yield** reacted by sliding to approximately **4.14%**, marking its lowest level in nearly a month as investors rushed into the safety of bonds. High Stakes for the Jobs Report The focus now shifts to the January **Non-Farm Payrolls (NFP)** report, scheduled for release today, **February 11, 2026**. This report is exceptionally high-stakes as it includes annual benchmark revisions that could recalibrate the entire economic trend of the previous year. * **Consensus Forecast:** **+65,000 to +70,000** new jobs. * **Unemployment Target:** Expected to hold steady at **4.4%**. * **Rate Cut Trigger:** A print below **50,000** jobs would likely solidify the case for a rate cut as early as March. Commodities and the Tech AI Spending Debate Gold prices are edging higher, trading near **$4,800** per ounce. The precious metal is benefiting from the downward pressure on Treasury yields and the softening U.S. dollar. Analysts suggest that if inflation data later this week remains cool, gold could see further upward momentum as a hedge against economic cooling. In the equity space, a shadow remains over the tech sector. Major firms are projected to commit over **$700 billion** to AI-related capital expenditure in **2026** alone. Amazon has signaled plans for **$200 billion** in spending, while Alphabet and Microsoft are also ramping up investments. Investors are increasingly divided on this "AI arms race." While these investments drive long-term infrastructure, the immediate lack of high-margin returns from AI services has led to intermittent sell-offs. Markets are closely watching whether this massive spending will translate into earnings growth or if it represents an overextension of corporate balance sheets.
HUDCO, NaBFID and SIDBI to Raise Rs 13,500 Crore via Bonds
Major public sector entities HUDCO, NaBFID, and SIDBI are mobilizing a combined ₹13,500 crore from the corporate bond market. This surge in borrowing activity is a strategic response to shifting interest rate dynamics and a favorable environment for institutional debt. The Housing and Urban Development Corporation (HUDCO) is taking center stage with plans to raise up to ₹1,500 crore through perpetual bonds. This is a critical component of its significantly expanded ₹80,000 crore borrowing program for the 2025–26 fiscal year. These bonds, structured as Tier I/II capital, are expected to feature a 10-year call option. HUDCO's financial health remains robust, with a loan book reaching ₹1.34 lakh crore and a goal to hit ₹1.55 lakh crore by the end of the fiscal year. Its asset quality has seen marked improvement, with net Non-Performing Assets (NPAs) dropping below 0.1%. Market attention is also fixed on the National Bank for Financing Infrastructure and Development (NaBFID), which is proceeding with a ₹4,000 crore bond sale. This move aligns with the government's aggressive infrastructure push, underscored by a massive ₹12.2 lakh crore capital expenditure target for the upcoming fiscal cycle. The Small Industries Development Bank of India (SIDBI) continues its consistent market presence, having recently maintained outstanding bond issues with coupon rates near 7.59%. This reflects the broader pricing trend for high-grade PSU paper. The Reserve Bank of India (RBI) recently held the repo rate steady at 5.25% in its February 2026 meeting, following 125 basis points of easing throughout 2025. While wholesale bank lending rates have shown signs of easing, systemic liquidity remains tight, pushing 10-year government bond yields to approximately 6.73%. This tightening liquidity has driven many lenders toward the bond market to diversify funding. To further support this, the government has announced new financial instruments, including total return swaps and derivatives on corporate bond indices, to enhance market depth and liquidity. The corporate bond segment in India has now reached a valuation of roughly ₹53.6 lakh crore. For investors, AAA-rated PSU bonds remain a defensive "sweet spot," offering yields generally ranging between 7.5% and 9.5% as an alternative to traditional bank deposits. This video provides an expert analysis of the latest debt market trends and yield shifts following the February 2026 policy announcements. [February 2026 Debt Market Outlook](https://www.youtube.com/watch?v=z01RGOV-ZNw) http://googleusercontent.com/youtube_content/0
Surplus Liquidity Drives Record Deposits in Standing Deposit Facility
The Reserve Bank of India (RBI) has concluded its final monetary policy meeting for the 2025-26 fiscal year, maintaining a steady course to ensure market stability. Central to this strategy is the management of substantial surplus liquidity within the banking system, which has reached a significant average of ₹2.4 lakh crore so far in February 2026. Banking institutions continue to utilize the Standing Deposit Facility (SDF) as a primary tool for parking excess funds. Currently, the SDF rate is held at 5.00%, serving as the floor of the interest rate corridor. This allows banks to deposit uncollateralized funds with the central bank overnight, earning a reliable return while the RBI absorbs excess cash to prevent inflationary pressures. The current market environment offers a profitable spread for commercial lenders. While the SDF provides a 5.00% return, banks are often able to source short-term liquidity at lower costs from the Tri-party Repo (TREPS) market. Recent data shows TREPS rates hovering around 4.27% to 4.32%, allowing banks to earn a margin by borrowing at these levels and depositing the surplus at the higher RBI facility rate. On February 6, 2026, the Monetary Policy Committee (MPC) unanimously decided to keep the benchmark repo rate unchanged at 5.25%. This "neutral" stance signals that the central bank has paused its easing cycle following 100 to 125 basis points of cumulative rate cuts earlier in the fiscal year. The focus has now shifted toward ensuring that these previous cuts are fully transmitted to the broader economy. Liquidity management remains proactive and dynamic. To maintain balance, the RBI has conducted significant Open Market Operations (OMO) totaling ₹3.5 lakh crore and utilized large-scale forex swaps. These measures are designed to support a stable credit environment as India's GDP growth is projected to hit a robust 7.4% for the 2025-26 period. Despite the current surplus, the RBI remains vigilant. Headline inflation is projected at a benign 2.1% for the full year, though officials expect a temporary uptick to 3.2% in the current quarter due to base effects and rising precious metal prices. The central bank's priority remains ensuring sufficient liquidity to meet productive economic requirements while keeping overnight market rates closely aligned with policy targets. [RBI MPC 2026 Policy Update](https://www.youtube.com/watch?v=JE_fDBxKe58) This video provides a concise breakdown of the RBI's recent liquidity measures and how the central bank is injecting funds into the banking system to support economic stability. http://googleusercontent.com/youtube_content/0
Government to Divest Up to 5% Stake in BHEL via Offer for Sale
The Government of India has initiated a strategic disinvestment in Bharat Heavy Electricals Limited (BHEL) through an Offer for Sale (OFS). This move involves offloading up to 5% of its total equity stake to institutional and retail investors. The sale is structured with a base offer of 3%, representing 10.44 crore shares. An oversubscription option for an additional 2%, or 6.96 crore shares, brings the potential total divestment to 17.41 crore shares. The floor price for the offer is fixed at ₹254 per share. This represents a significant discount compared to the stock’s recent closing price of approximately ₹275.90. The government aims to raise roughly ₹2,653 crore through the base offer, potentially increasing to ₹4,422 crore if the full 5% is exercised. Bidding for the OFS is conducted over two days. Non-retail and institutional investors were granted access on Wednesday, February 11, 2026. Retail investors, defined as those bidding up to ₹2 lakh, and eligible BHEL employees can place their bids on Thursday, February 12, 2026. This divestment arrives as BHEL reports a sharp financial turnaround. In the December 2025 quarter, the company’s net profit more than tripled to ₹382 crore, up 206% year-on-year. Revenue from operations also rose 16% to ₹8,473 crore, driven by robust execution and a dominant position in the power segment. The company’s order book remains a critical pillar of its market valuation. As of December 31, 2025, the outstanding order book stood at ₹2,22,800 crore. The power sector accounts for 80% of these orders, while the industry and export segments contribute the remaining 20%. Broader market trends in the power sector further support the stock’s outlook. Electricity demand in India grew by 6.7% in February 2025 as the summer season approached. Installed capacity has surpassed 476 GW, with a strong shift toward renewable sources, which now account for nearly 49% of the national mix. BHEL stock has shown significant long-term growth, with a 1-year return of approximately 30% and a 3-year surge exceeding 250%. The current market capitalization stands at approximately ₹96,000 crore. The OFS is expected to enhance the stock's liquidity and increase public shareholding, which currently sits at roughly 36.83%. The government remains the majority owner with a 63.17% stake prior to this sale. Market analysts view the stake sale as a timely move given the current focus on PSU asset monetization and the revival of capital expenditure in the power and infrastructure sectors. BHEL’s recent operational milestones, including synchronization of major 800 MW units, underline its recovery and growth potential.

SEBI Mandates Additional Net Worth Requirements for Credit Rating Agencies
Market Brief: Strategic Expansion of Credit Rating Framework The Securities and Exchange Board of India (Sebi) has implemented a significant regulatory shift as of **February 2026**. Credit Rating Agencies (CRAs) are now authorized to rate a wider array of financial instruments, including unlisted securities and products overseen by other financial sector regulators. To support this expansion, Sebi has introduced a strict "additional net worth" mandate. Agencies must maintain a core minimum net worth of **₹25 crore**, which must remain untouched by any non-Sebi activities. Any capital requirements imposed by other regulators—such as the RBI or IRDAI—must be maintained as a separate, additional buffer. Structural and Operational Segregation The new framework demands a total firewall between Sebi-regulated activities and those under other jurisdictions. Agencies are required to implement: * **Distinct Digital Presence:** Separate webpages and dedicated email IDs for different regulatory grievance handling. * **Transparent Branding:** Clear labeling in all marketing and rating reports to show which regulator governs the instrument. * **Mandatory Disclosures:** Explicit statements in rating agreements that Sebi’s investor protection and grievance mechanisms do not apply to non-Sebi products. Market Context and Growth Trends This move arrives as India’s credit market shows robust momentum. Major agencies like ICRA and CRISIL have reported strong financial performance in the first half of **FY2026**. ICRA saw a **24.4%** rise in profit after tax for H1 FY26, reaching **90.8 crore**, while CRISIL’s rating revenue grew by **20%** year-on-year. The expansion into unlisted debt is expected to bridge a massive market gap. Retail asset management for NBFCs is projected to cross **₹30 lakh crore** by **FY2027**, and the ability to provide holistic ratings for conglomerates—covering both their listed and unlisted entities—provides a more accurate risk profile for large-scale investors. Economic Backdrop India's macroeconomic stability continues to anchor this regulatory confidence. Real GDP growth for **FY2026** is forecasted at **6.5%**, with CPI inflation expected to moderate to **2.5%** by March 2026. Credit growth remains healthy, projected to stay between **11.5% and 12.5%** through the next fiscal year. By allowing CRAs to explore these "adjacent" business lines, Sebi aims to foster industry synergies while ensuring that the core safety of the listed securities market is not compromised by the risks associated with unlisted or private debt instruments.

European companies explore Indian stock market listings
The Indian equity market is currently witnessing a transformative shift as European multinational corporations (MNCs) move to list their local subsidiaries in Mumbai. This trend is accelerated by a historic breakthrough in trade relations and a domestic fundraising environment that continues to defy global volatility. Recent data indicates that the Indian IPO market remains one of the most active globally. In 2025, the region saw a record-breaking surge in public offerings, with total proceeds exceeding 1 trillion rupees. Major global players have led the charge, including LG Electronics India’s 116 billion rupee issue and Hyundai Motor’s 270 billion rupee listing. The momentum is carrying into early 2026, with Rothschild & Co forecasting at least 10 more multinational firms will go public in Mumbai this year. Key European industrial giants, including German auto parts leader MAHLE GmbH and Danish brewer Carlsberg, are reportedly preparing for local listings. A primary driver for this surge is the conclusion of the landmark EU-India Free Trade Agreement (FTA) in early 2026. This historic deal is expected to eliminate or significantly reduce tariffs on 96.6% of EU goods exports to India. For the automotive sector, tariffs that previously reached 110% are being slashed to as low as 10%, while duties on chemicals and machinery are being phased out entirely. Market performance remains a powerful magnet for these firms. While global indices have faced headwinds, the Indian market has maintained high valuations. As of February 2026, domestic institutional investors have become the backbone of the market, accounting for nearly 75% of investment in recent listings. This provides a stable base of capital that is increasingly independent of foreign institutional outflows. Sector-specific interest is concentrated in three high-growth areas: Auto Components and EVs European manufacturers are leveraging India’s Production Linked Incentive (PLI) schemes. With the FTA reducing trade barriers, companies are seeking to unlock value through local listings to fund expansion in the rapidly growing electric vehicle ecosystem. Specialty Chemicals Valued at approximately 250 billion dollars, India’s chemical sector is benefiting from global supply chain diversification. European firms are establishing Mumbai listings to tap into a market that is growing at a double-digit annual pace. Clean Energy and Infrastructure The push toward net-zero targets has triggered massive investment. Italian giant Bonfiglioli Transmissions recently filed for a 2,000 crore rupee IPO, joining a wave of renewable energy and industrial firms seeking to capitalize on India's green transition. The current regulatory environment in India is also at its most supportive. The Securities and Exchange Board of India (SEBI) has streamlined disclosure standards, giving European boards greater confidence in the transparency and maturity of the Mumbai exchanges. With the Nifty 50 and Sensex demonstrating resilience and the rupee stabilizing against major currencies, the "India listing" has evolved from a niche strategy into a standard corporate priority for European leadership looking to capture premium valuations.
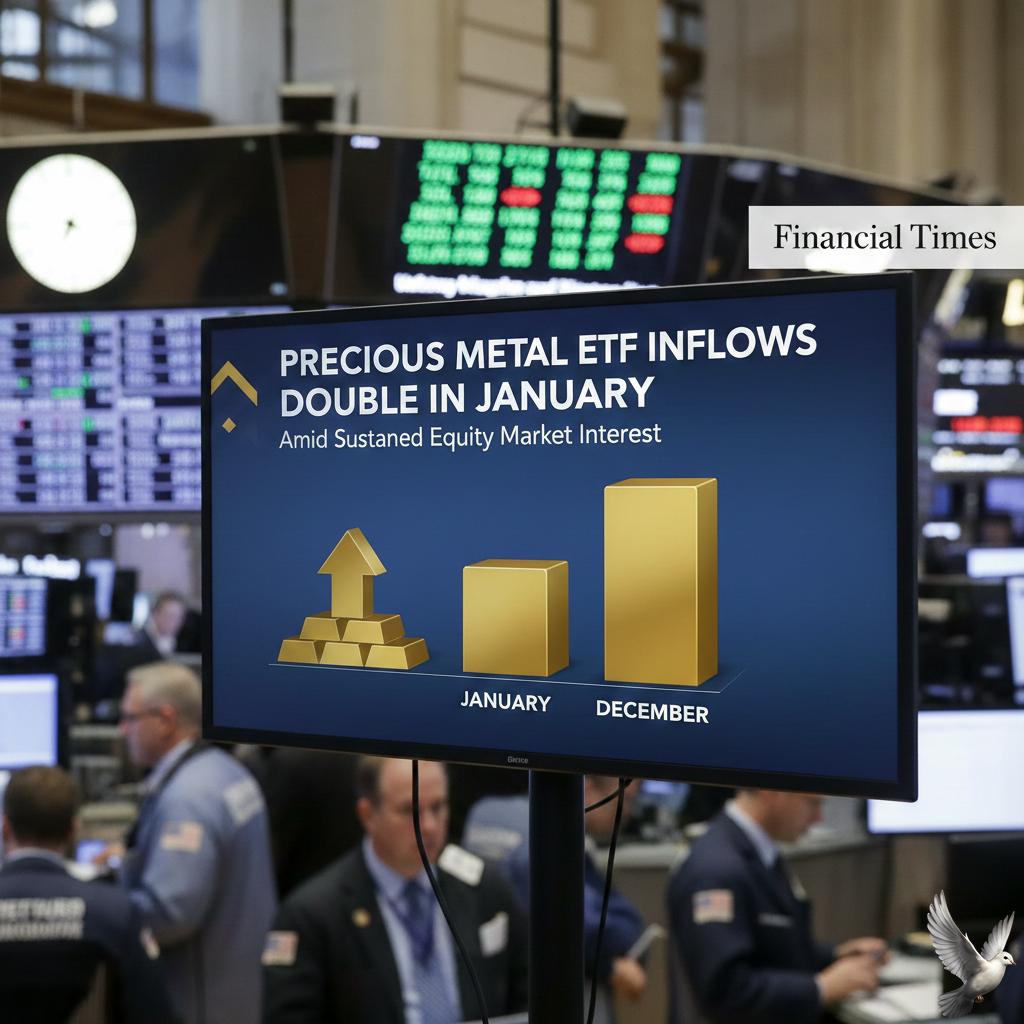
Precious Metal ETF Inflows Double in January Amid Sustained Equity Market Interest
In a historic shift for the Indian mutual fund industry, precious metals emerged as the dominant asset class in January 2026. Combined net inflows into gold and silver exchange-traded funds (ETFs) reached a record **₹33,503 crore**, officially surpassing net equity fund inflows for the first time. The surge was led by gold ETFs, which attracted **₹24,040 crore**, a significant jump from the **₹11,647 crore** recorded in December. This movement coincided with a 14% decline in equity fund inflows, which cooled to **₹24,028 crore** during the same period. Silver ETFs also saw a massive spike, with inflows rising 139% to reach **₹9,463 crore**. Total assets under management (AUM) for the mutual fund industry climbed to **₹81.01 lakh crore**. Within this, the gold ETF segment saw its AUM swell to **₹1.84 lakh crore**, marking a 44% increase in a single month. The combined gold and silver ETF AUM has now crossed the **₹3 lakh crore** milestone. Investor behavior has been driven by exceptional trailing returns. Over the past year, gold delivered approximately **80%** returns, while some silver ETFs posted gains as high as **180%** prior to recent volatility. This performance outpaced the modest **8% to 10%** growth seen in major domestic equity indices like the Nifty 50 and Sensex during 2025. Market prices reached unprecedented levels in late January. 24K gold hit a lifetime high of **₹1,75,930 per 10 grams** on January 29, while silver futures briefly breached the **₹4 lakh per kg** mark. These peaks were fueled by global geopolitical tensions, a weakening rupee, and consistent central bank buying. However, the beginning of February introduced sharp corrections. A shift in global sentiment, triggered by expectations of a more hawkish US Federal Reserve, led to a dramatic sell-off. Gold prices retreated toward **₹1.55 lakh per 10 grams**, and silver fell roughly 42% from its peak to settle near **₹2.5 lakh per kg**. Despite the recent price correction, the number of investor accounts continues to grow. Gold ETF folios rose to **1.14 crore**, while silver ETF folios surged over 323% to reach **47.85 lakh**. Experts view this as a structural shift where investors are increasingly using precious metals as a portfolio stabilizer. Current market guidance suggests maintaining a disciplined allocation of **10% to 15%** in gold and silver. While the record inflows indicate strong momentum, the high volatility in silver highlights the risk of performance-chasing. Staggered investments through systematic plans remain the preferred entry strategy at current elevated price levels.
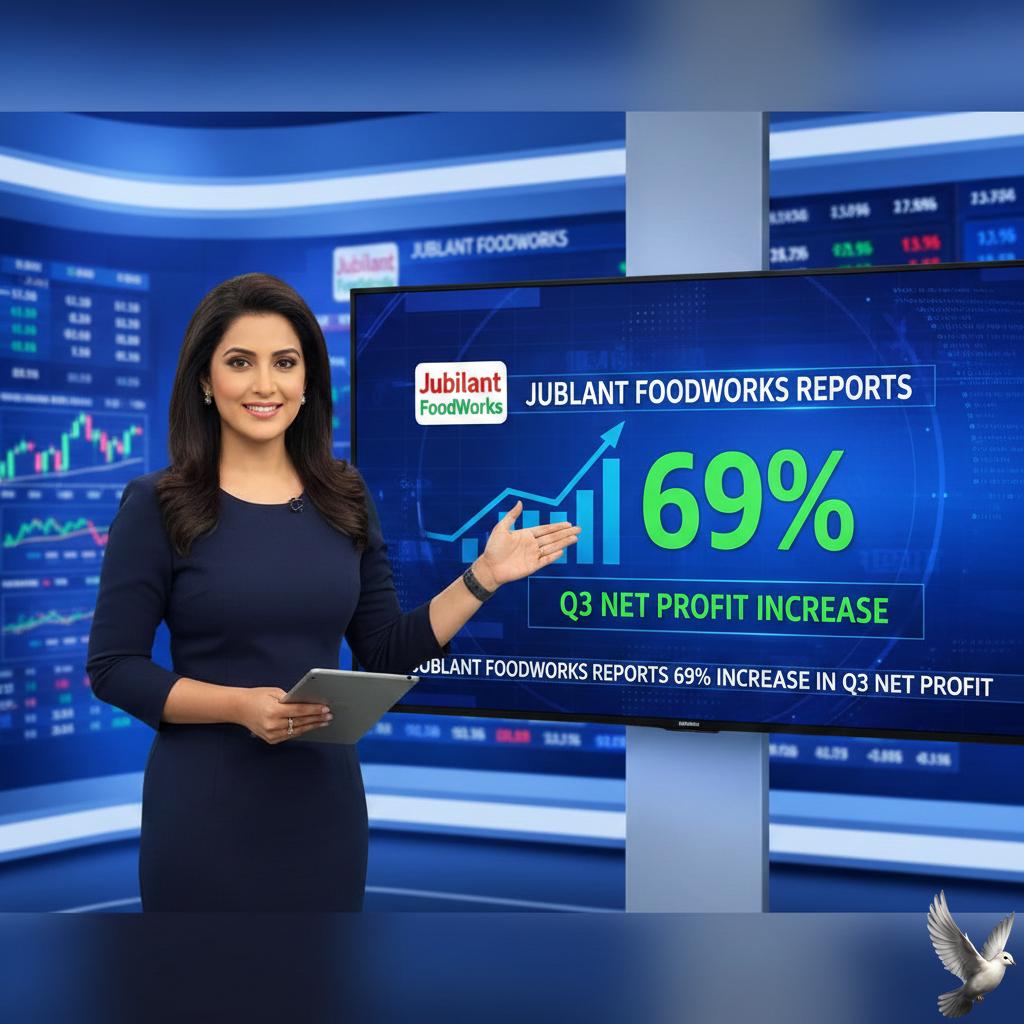
Jubilant FoodWorks Reports 69% Increase in Q3 Net Profit
Jubilant FoodWorks has reported a standout performance for the third quarter of FY26, with consolidated net profit climbing 68.6% to reach ₹72.9 crore. This sharp increase from the ₹43.2 crore recorded in the same period last year underscores a significant recovery in the quick-service restaurant (QSR) sector. The company’s revenue from operations rose by 13.3%, totaling ₹2,437.2 crore for the December quarter. This growth was driven by a combination of disciplined execution, strategic store expansions, and a 21% year-on-year increase in monthly transacting users on the company’s digital apps. Operating efficiency played a central role in these results, with EBITDA rising 20% to ₹482 crore. The EBITDA margin expanded by 110 basis points to reach 19.8%, reflecting improved gross margins and better management of overhead costs despite an overall 10.4% increase in total expenses. Store network expansion reached a new milestone this quarter with the addition of 114 net new stores across all brands. This brings the total global network to 3,594 outlets. Domino’s India alone added 75 net new stores, ending the period with 2,396 locations and reporting a healthy 5% like-for-like (LFL) growth. Performance across the portfolio was diverse. While Domino’s India saw its delivery channel revenue grow by 16%, the Popeyes brand maintained high double-digit LFL growth. Additionally, international operations in Turkey, Sri Lanka, and Bangladesh continue to show strength, with the Turkey business now self-sustaining its debt obligations through internal cash flows. The market responded positively to these figures. Shares of Jubilant FoodWorks settled at ₹556.50 on the BSE following the announcement, reflecting a 1.6% daily gain and a nearly 10% rise over the last week. The stock currently maintains a market capitalization of approximately ₹36,700 crore. Broader sector trends indicate a pivot toward delivery-first models and digital integration. With 30–40% of QSR sales in India now moving through online platforms, Jubilant's focus on app engagement and hyper-local delivery continues to align with shifting consumer habits in both metro and emerging Tier-2 cities. The Indian QSR market is projected to grow to $30.37 billion by the end of 2026. Within this landscape, Jubilant FoodWorks is positioning itself through menu localization and a "focus over variety" strategy to maintain its leadership amidst rising competition and inflationary pressures on raw materials.
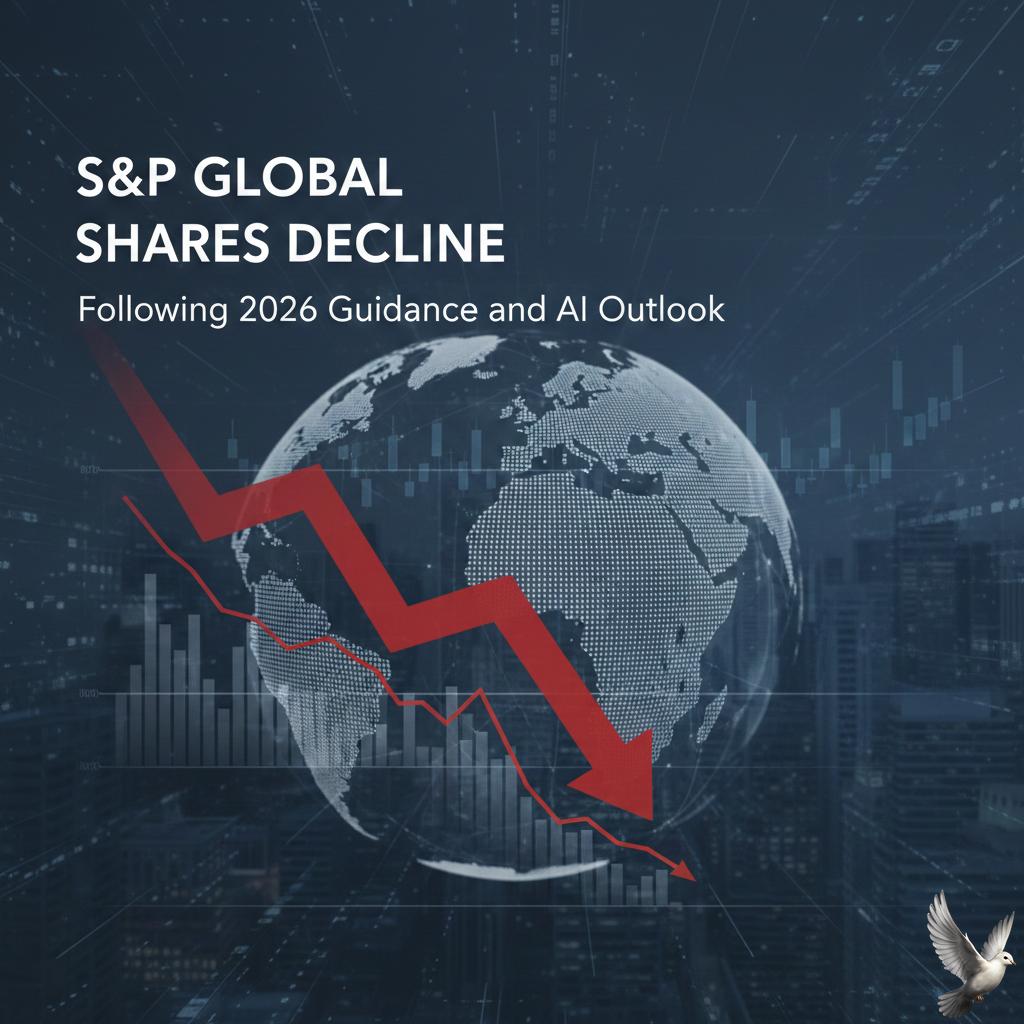
S&P Global Shares Decline Following 2026 Guidance and AI Outlook
Market Brief: S&P Global Guidance Triggers Sell-off S&P Global shares experienced a sharp decline on February 10, 2026, falling nearly **21%** in midday trading to hit a low of **$395.88**. The sell-off represents the stock's lowest level in over two years, wiping out significant year-to-date gains as investor unease intensifies over the pace of growth in the financial data and services sector. The primary catalyst for the decline was the release of the fiscal year 2026 earnings guidance. The company projected adjusted earnings per share between **$19.40 and $19.65**. This forecast fell short of the Wall Street consensus estimate, which had been positioned at **$19.96**. Quarterly Performance and Segment Weakness The company reported fourth-quarter 2025 adjusted earnings of **$4.30** per share, narrowly missing the **$4.32** expected by analysts. While total revenue for the quarter rose **9%** to **$3.92 billion**, specific segments showed signs of softening momentum. S&P Global Ratings, a major revenue driver, issued a conservative organic growth guide of **4% to 7%** for 2026. This outlook disappointed investors who were anticipating a more robust recovery in debt issuance and ratings activity. AI Disruption and Sector Sentiment Investor sentiment is increasingly clouded by the potential for AI-driven disruption within the software and services industry. While the company achieved an annual revenue growth of **8%** for 2025, the market is pricing in the long-term risks of automated analytics and generative AI tools competing with traditional data providers. Institutional reaction has been swift. Major firms, including Goldman Sachs and Stifel, have lowered their price targets, citing lower-than-expected free cash flow and a revenue outlook that sits below the company’s own medium-term strategic targets. Financial Health and Dividends Despite the share price volatility, the firm maintains a market capitalization of approximately **$134.52 billion**. In a move to reassure shareholders, the company increased its quarterly dividend to **$0.97** per share, up from **$0.96**. The current dividend yield stands at **0.9%** with an annualized payout of **$3.88**. However, with the stock losing roughly **15%** of its value since the start of 2026, the focus remains firmly on whether the company can adapt its business model to the accelerating shift toward AI-native financial intelligence.
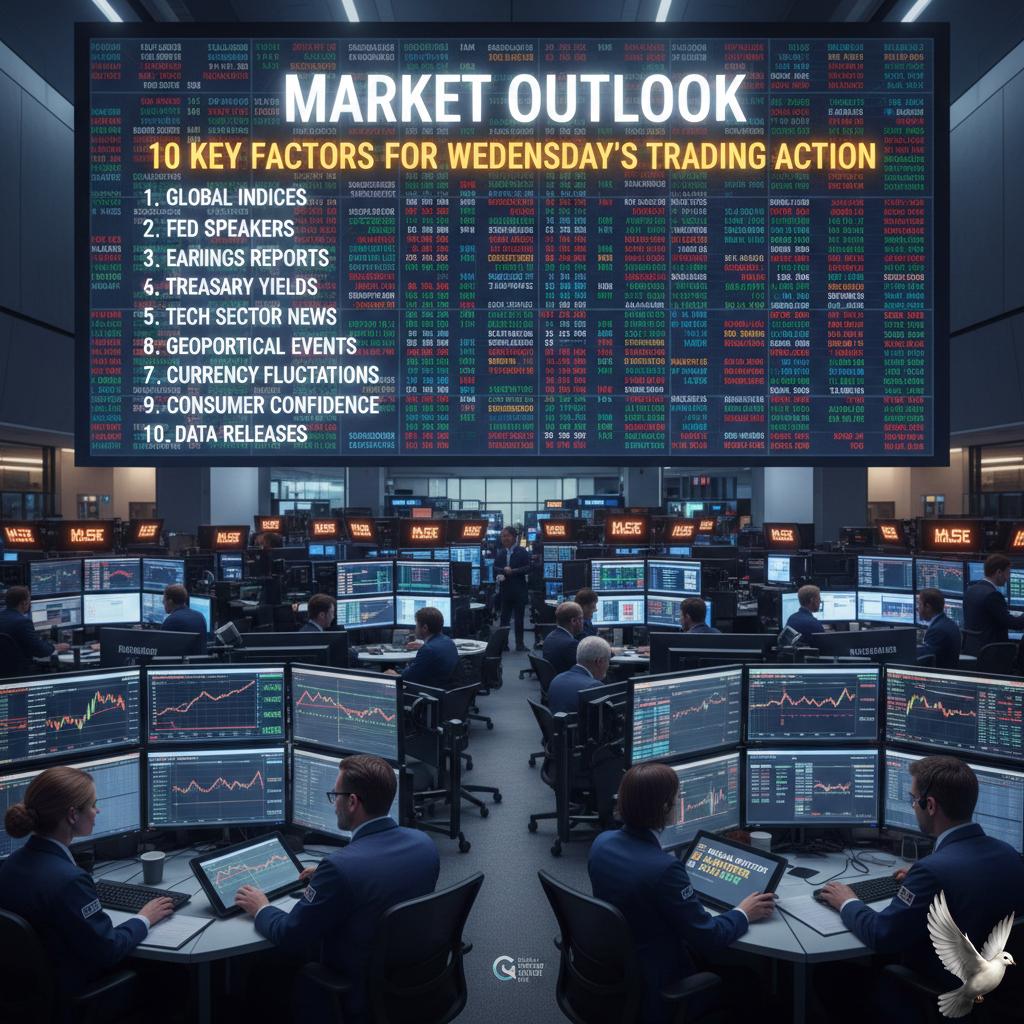
Market Outlook: 10 Key Factors for Wednesday's Trading Action
Indian equity benchmarks extended their winning streak for a third consecutive session on February 10, 2026, as the Nifty 50 closed at 25,935.15, gaining 67.85 points. The BSE Sensex mirrored this strength, climbing 208.17 points to settle at 84,273.92. This upward momentum was largely fueled by sustained foreign institutional investor (FII) interest and a positive reaction to the recently signed India-US interim trade framework. FIIs remained net buyers with an inflow of 2,254.64 crore, signaling a return of global liquidity after a period of caution. Domestic institutional investors (DIIs) provided additional stability, acting as shock absorbers with net purchases of approximately 1,174 crore. This dual institutional support has bolstered investor confidence across the board. Market breadth remained positive as the broader markets outperformed frontline indices. The Nifty Midcap index rose 0.49%, while the Smallcap index advanced 0.38%. Total market capitalization of BSE-listed firms saw a significant jump, crossing the 474 lakh crore mark in a single day. Sectoral performance was led by Nifty Media, which surged 2.40% on the back of strong gains in heavyweights like Sun TV. The Nifty Auto index followed with a 1.37% rise, while the Metal sector gained 0.80%. In contrast, the Nifty Pharma and PSU Bank indices faced minor profit-booking, closing down by 0.36% and 0.20% respectively. Technically, the Nifty 50 is facing stiff resistance at the psychological 26,000 level. Analysts suggest that a decisive move above this hurdle could unlock further upside toward 26,350. On the downside, immediate support is established at 25,800, with a major demand zone emerging near 25,550. Macroeconomic indicators provide a supportive backdrop as the Reserve Bank of India recently maintained its "Neutral" stance, holding the repo rate at 5.25%. With GDP growth for FY26 projected at a resilient 7.4% and retail inflation estimated at a low 2.1%, the domestic fundamental story remains intact. Global cues further assisted the rally, with Japan’s Nikkei leading Asian gains following a significant election outcome. Meanwhile, Brent crude prices softened slightly to 68.85 per barrel, easing concerns over energy-led inflation. The current market environment encourages a buy-on-dips strategy. Despite minor volatility at record highs, the underlying trend remains constructive, supported by robust Q3 earnings and improving liquidity from both foreign and domestic sources.
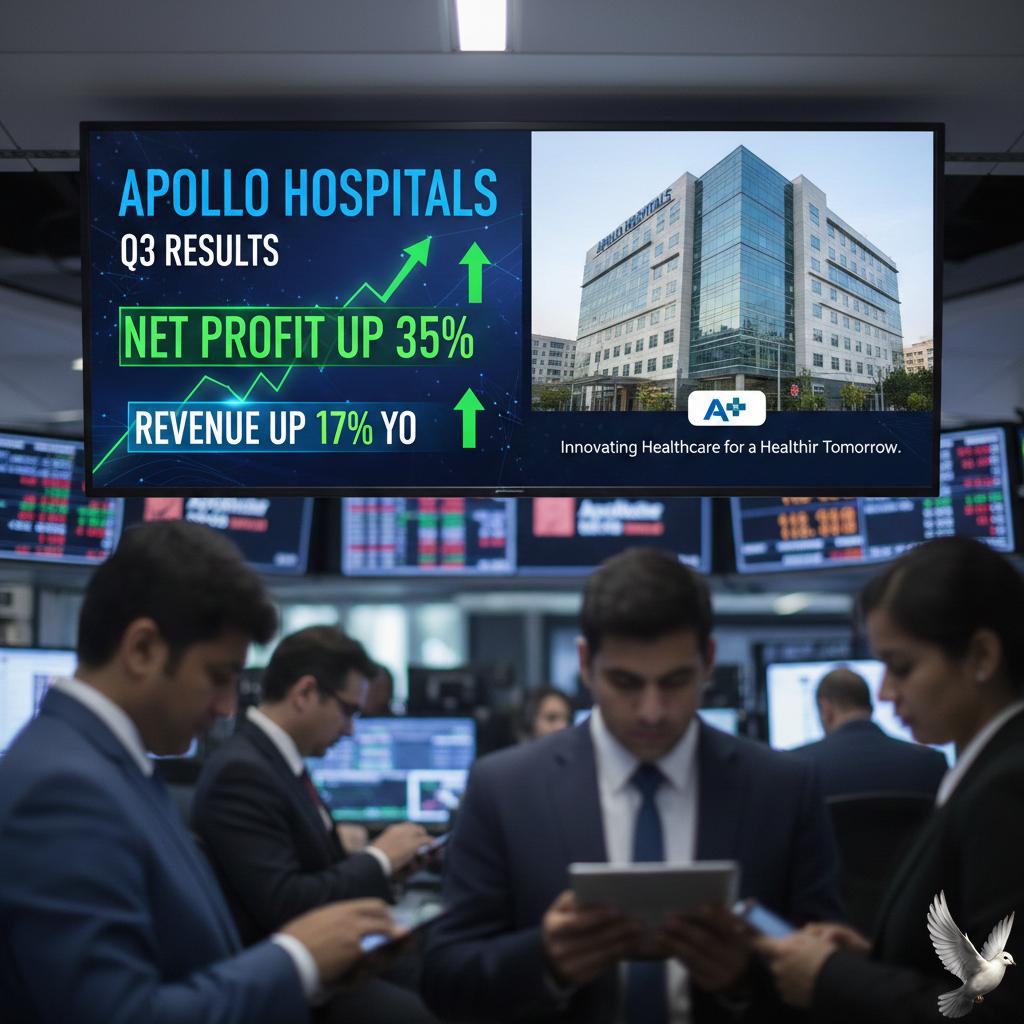
Apollo Hospitals Q3 Results: Net Profit Up 35% and Revenue Up 17% YoY
Apollo Hospitals has delivered a robust financial performance for the third quarter of the 2026 fiscal year, characterized by a significant surge in profitability and double-digit revenue growth. The healthcare major reported a 35% year-on-year increase in consolidated net profit, reaching 502 crore. This bottom-line growth was supported by a 17% rise in consolidated revenue, which climbed to 6,477 crore compared to the same period last year. Operational efficiency also saw a marked improvement, with EBITDA growing 27% to reach 965 crore. The company’s healthcare services division remains a primary driver of this momentum, posting revenues of 3,183 crore. This 14% increase in the core hospital business was fueled by higher occupancy levels and a shift toward more complex medical cases. Strategic segments like Apollo HealthCo, which integrates pharmacy distribution and digital health, reported a 20% revenue jump to 2,827 crore. Notably, the segment's profitability more than doubled during the quarter, reflecting the maturing of its omni-channel healthcare model. Market performance for the group remains steady, with the stock trading near the 7,220 level. In a move to reward shareholders, the board has declared an interim dividend of 10 per share, with the record date set for February 16, 2026. Beyond the immediate financials, Apollo is executing an aggressive 8,000 crore expansion strategy. The plan aims to add 4,300 beds over the next four years, targeting high-growth markets and under-served Tier 2 and Tier 3 cities. The group recently strengthened its western India presence with the launch of a quaternary care facility in Pune. This facility is part of a broader roadmap to increase total capacity, including new upcoming hospital projects in cities like Kolkata and Hyderabad. The broader Indian healthcare sector is currently supported by a 1.06 lakh crore allocation in the latest Union Budget. Policy focus on "Biopharma Shakti" and the creation of regional medical hubs align with Apollo’s focus on high-end clinical specialties and medical tourism. With an integrated network of over 70 hospitals and 6,800 pharmacies, the company is positioning itself to capture the structural shift in Indian healthcare toward chronic disease management and technology-intensive tertiary care.

IndiQube Q3 Profit Rises 214% to Rs 40 Crore as Revenue Grows 45% to Rs 395 Crore
Managed workspace provider IndiQube Spaces Ltd has reported a milestone performance for the quarter ended December 2025. The company’s profit after tax (PAT) surged by 214% year-on-year to reach ₹40 crore. This growth was underpinned by a sharp rise in enterprise demand and an expanding footprint across 17 Indian cities. The firm recorded its highest-ever quarterly revenue of ₹395 crore, a 45% increase from the ₹273 crore reported in the same period last year. For the first nine months of the fiscal year, total revenue reached ₹1,063 crore, while cumulative net profit stood at ₹95 crore—a 284% jump compared to the previous year. Operational efficiency has seen significant improvement. The return on capital employed (ROCE) rose to 23%, up from 15% a year ago. Financial stability was further highlighted by a strengthened balance sheet, with the debt-to-equity ratio dropping from 0.80 to 0.15. Recurring revenues now account for 94% of the company's total income mix. The provider added 1.5 million sq ft of area under management over the past 12 months, bringing its total portfolio to 9.55 million sq ft. Portfolio occupancy improved to 84%, supported by the addition of 21 new centers and 33,000 seats. New market entries include Bhubaneswar, Indore, and Kolkata. The broader Indian flexible office sector is currently experiencing a historic peak. In 2025, net absorption of office space across India hit a record 57 million sq ft. The flexible segment specifically captured a 26.6% share of all leasing activity in the final quarter of 2025, the highest quarterly contribution to date. Market dynamics are being driven heavily by Global Capability Centers (GCCs), which accounted for nearly 38% of total office leasing last year. Overall vacancy rates in major hubs have fallen to a five-year low of 15.2%. Demand is now shifting toward Tier-2 cities as enterprises seek untapped talent and cost-effective expansion. IndiQube’s credit profile remains robust, with a reaffirmed ‘A+’ rating and a stable outlook. The company's specialized "Bespoke Design & Build" services are also gaining traction, with recent projects signed in Guwahati and Chennai. This indicates a growing trend of providing value-added services beyond traditional leasing. The flexible workspace industry in India is projected to cross the 100 million sq ft milestone by the end of 2026. This trajectory is supported by a 20% annual growth rate in demand from IT, manufacturing, and BFSI sectors. As of early 2026, the market valuation for this segment is estimated to be between $9 billion and $10 billion.

IIFL Finance to Launch Rs 2,000 Crore Retail Bond Issue
IIFL Finance has announced plans to launch a retail bond issuance worth **Rs 2,000 crore** next week. This strategic move aims to fuel a business trajectory that has seen its core growth metrics more than double over the past year. The company’s expansion is primarily powered by a massive surge in the gold loan segment. Following the lifting of previous regulatory restrictions, gold loan assets under management (AUM) reached a historic high of **Rs 43,432 crore** in the December 2025 quarter. This represents a staggering **189% year-on-year increase**, as borrowers take advantage of record-high gold prices to secure higher loan values. Current market data indicates that gold prices in India have crossed **Rs 94,000 per 10 grams** as of early 2026. This appreciation has significantly boosted the value of collateral, allowing the company to maintain a robust loan-to-value (LTV) profile. The overall consolidated AUM has climbed to **Rs 98,336 crore**, bringing the firm to the threshold of the Rs 1 lakh crore milestone. Financial health remains a key highlight of the latest quarter. IIFL Finance reported a consolidated profit after tax of **Rs 501 crore**, marking a **20% growth** on a sequential basis. Asset quality has also shown marked improvement, with gross non-performing assets (GNPA) dropping to **1.60%** from 2.14% in the previous quarter. The upcoming bond issue is expected to further diversify the company’s funding mix and lower its average cost of borrowing, which recently moderated to approximately **9.24%**. With a healthy liquidity buffer of over **Rs 9,400 crore**, the firm is positioning itself to capture a larger share of the organized gold loan market, which is projected to exceed **Rs 10 lakh crore** in the current fiscal year. To reward shareholders during this growth phase, the board recently approved an interim dividend of **Rs 4 per share**. The management remains focused on a "phygital" expansion strategy, combining its extensive branch network with AI-driven risk assessment to sustain this momentum through 2026 and beyond.

Market Trading Guide: Near-Term Upside Potential for Eternal, Grasim, and Two Other Stocks
Market Overview The Indian equity market maintained its upward trajectory on **February 10, 2026**, marking the third consecutive session of gains. The **Nifty 50** closed at **25,935.15**, up **67.85 points** or **0.26%**, after touching an intraday high of **25,989.45**. Similarly, the **BSE Sensex** ended **208.17 points** higher at **84,273.92**. Market sentiment remains bolstered by a combination of positive global cues from Asian peers and a renewed surge in **Foreign Institutional Investor (FII)** inflows, which reached **₹2,254.64 crore** in the previous session. Optimism regarding an interim trade framework between New Delhi and Washington is also providing a supportive floor for domestic valuations. Sectoral Performance and Trends The auto and metal sectors continue to lead the rally. The **Nifty Metal** index saw significant traction, with **Tata Steel** rising nearly **3%** to close at **₹208.01**. The automotive segment remains a standout performer, with January retail sales jumping **18%** year-on-year. Within this space, **Mahindra & Mahindra** gained **1.84%**, while **Bajaj Auto** climbed **1.92%** to settle at **₹9,774**. The banking sector showed resilience despite minor profit-booking in heavyweights. While **HDFC Bank** eased slightly, **Axis Bank** added **1.15%**. The broader market indices, including MidCap and SmallCap, outperformed the benchmarks, showing gains of **3.8%** and **4.6%** respectively, indicating widespread buying interest beyond large-cap stocks. Technical Outlook Technical indicators signal a "sideways-to-positive" trend as the Nifty navigates crucial psychological resistance at the **26,000** mark. Immediate support is firmly established in the **25,600–25,700** range. The **Relative Strength Index (RSI)** and **MACD** indicators suggest improving momentum, though analysts warn of potential consolidation near current highs as the market awaits upcoming CPI inflation data. Short-Term Picks and Corporate Highlights Specific stocks are demonstrating strong individual momentum. **Eternal Ltd** emerged as a top gainer, surging **5.24%** to close at **₹304.00**. **Grasim Industries** also saw steady demand, trading at approximately **₹2,871**, up **1.22%**. In the small-cap and ancillary space, **Gabriel India** hit a notable milestone, trading near **₹1,000** after a **3.23%** jump, supported by a favorable outlook in the auto parts industry. Analysts maintain a constructive view on **HDFC AMC** as institutional participation remains robust, aligning with the broader trend of steady domestic inflows. Commodities and Currency The Indian Rupee was quoted near **90.77** against the US Dollar, reflecting slight depreciation. In commodities, **Gold** prices on the MCX hovered around **₹157,925 per 10 grams**, while **Brent Crude** remained relatively stable at **$68.89 per barrel**, easing pressure on trade balance expectations.
US Retail Sales Unchanged in December
US retail sales remained unexpectedly flat in December, coming in at 0.0% growth. This figure, released in a delayed government report on February 10, 2026, missed the 0.4% expansion forecasted by analysts. The stagnation follows a stronger 0.6% increase in November and marks a sharp cooling of consumer activity at the close of the holiday season. The flat headline number reflects a cautious shift in consumer behavior. Total sales for the month were estimated at $735 billion, a figure unchanged from the previous month. While annual growth for 2025 reached 3.7%, the recent slowdown suggests that high interest rates and persistent inflation are finally weighing on the American consumer's appetite. Sector performance was notably mixed. Building materials and garden centers saw a 1.2% increase, providing a rare bright spot. However, these gains were offset by significant declines in discretionary spending. Furniture and home furnishing stores dropped by 0.9%, clothing and accessories fell by 0.7%, and electronics retailers saw a 0.4% decrease. A critical indicator of broader economic health, restaurant and bar spending, also registered a slight dip of 0.1%. Because dining out is often the first expense cut during times of financial anxiety, this decline is being closely watched as a potential signal of waning consumer confidence. Market analysts point to several factors for this late-year "fizzle." Many Americans reportedly pulled their spending forward into the summer to avoid price hikes linked to new tariffs. Additionally, a 43-day government shutdown last fall disrupted typical shopping patterns and delayed the release of these official figures by more than a month. The 2.4% annual increase in retail sales failed to keep pace with the 2.7% rise in the consumer price index over the same period. This gap indicates that while shoppers are spending more in nominal terms, they are often receiving fewer goods for their money as purchasing power erodes. Investors are now turning their attention to upcoming data for early 2026, including the January jobs report and the latest Consumer Price Index readings. These reports will clarify whether the December stagnation was a temporary holiday hangover or the start of a more significant downward trend for the world's largest economy.

Software Sector Sees Record Retail Investment Amid AI Disruption Concerns
Market Brief: Tech and Software Recovery Retail investors have re-entered the software and technology sectors with significant volume as of **February 10, 2026**. This wave of "dip-buying" follows a sharp correction last week that saw the S&P 500 Software & Services Index decline by **7.5%**. Year-to-date, the software sector has faced a steep **18.6%** loss, primarily driven by concerns over AI-driven disruption to traditional business models. The sentiment shift was largely triggered by a technical rebound. On Monday, the **Nasdaq Composite** climbed **0.9%** to reach **23,238.67**, while the **S&P 500** rose **0.47%** to **6,964.79**. Individual performance was led by Oracle, which surged **9.6%** over two sessions, signaling a stabilization in enterprise software. Despite the recovery, the Nasdaq remains approximately **3%** below its record high. Industry volatility intensified following the release of advanced agentic AI tools, such as Anthropic’s Claude Cowork, which automates complex professional workflows. These advancements initially sparked fears that legacy software providers could face rapid obsolescence. However, retail participants appear to be prioritizing current valuations, as the technology sector is now trading at an estimated **16% discount** to fair value. Capital expenditure remains a critical metric for the market. The four leading "hyperscalers"—Amazon, Microsoft, Alphabet, and Meta—are projected to spend a combined **$600 billion** to **$700 billion** on AI infrastructure in 2026. This represents a growth of nearly **80%** from the previous year. While this spending pressures free cash flow, it continues to fuel the semiconductor and data center supply chains. The broader market maintains a cautious but upward trajectory. The **Dow Jones Industrial Average** recently breached the **50,000** mark for the first time, closing at **50,135.87**. While software has been the most volatile sector in 2026, other "real economy" sectors like Energy and Basic Materials have seen year-to-date gains of **17.9%** and **14.3%**, respectively, as investors diversify their exposure. Looking ahead, the market is preparing for key economic indicators. The upcoming release of January employment data and CPI inflation figures will likely determine the Federal Reserve’s interest rate path for the remainder of the year. For now, the aggressive return of retail buyers suggest a belief that the recent software selloff was overextended, even as the industry navigates the long-term structural shifts brought by artificial intelligence.
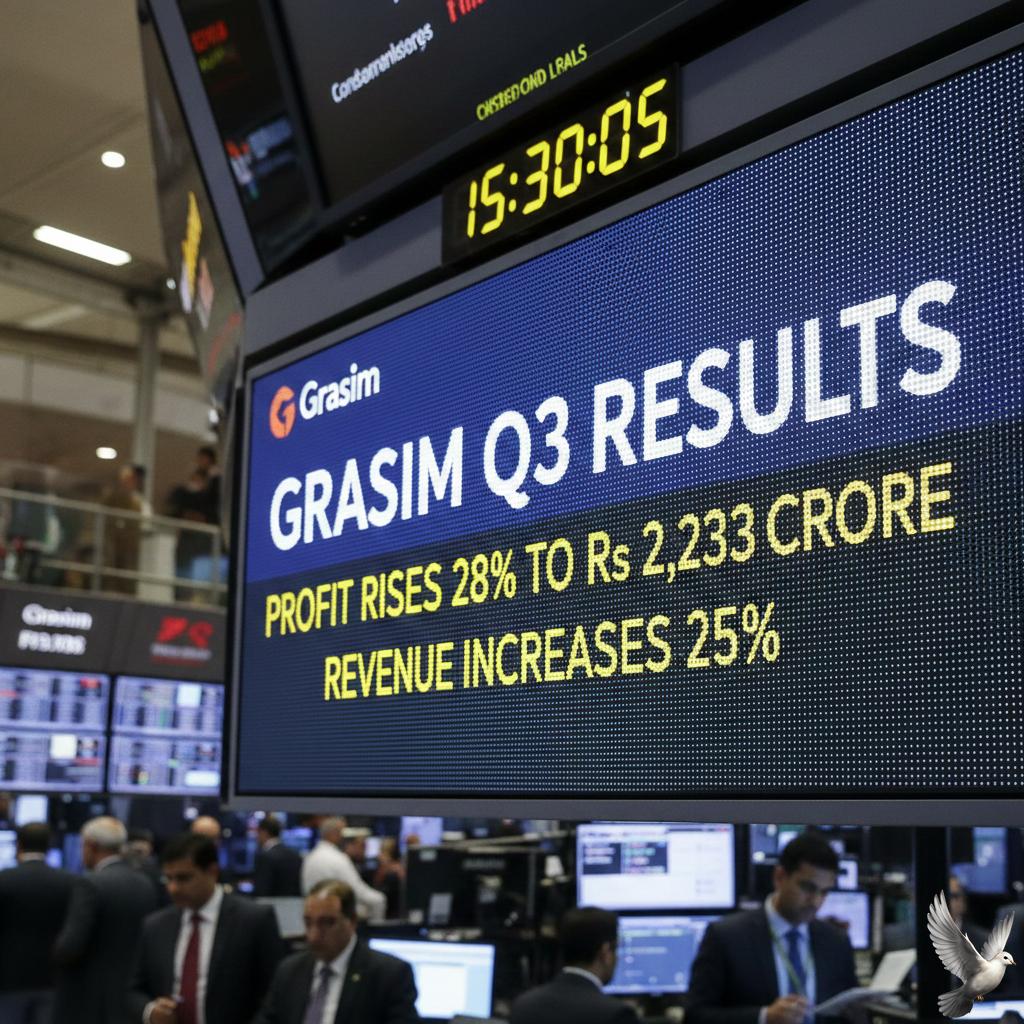
Grasim Q3 Results: Profit Rises 28% to Rs 2,233 Crore and Revenue Increases 25%
Grasim Industries, the flagship holding company of the Aditya Birla Group, reported a robust financial performance for the third quarter of FY26 ending December 31, 2025. The conglomerate achieved its highest-ever consolidated revenue of **₹44,312 crore**, marking a **25.25%** year-on-year increase. Consolidated net profit for the quarter surged by **28.76%** to reach **₹2,232.95 crore**. This growth was largely driven by a strong showing in the building materials and financial services sectors, alongside improved operational efficiencies across its diversified portfolio. **Core Segment Highlights** The building materials segment remains the largest revenue contributor, generating **₹71,159 crore** in the first nine months of the fiscal year. In the December quarter, the cement business saw EBITDA growth of **29%**, supported by lower logistics and fuel costs. The chemicals division achieved a historic milestone with caustic soda sales volumes reaching **313 KT**, up **4%** year-on-year. While international prices faced some pressure, domestic realizations remained stable, contributing to a healthy consolidated operating margin of **13.61%**, up from **12.53%** in the previous year. **New Business and Strategic Shifts** Grasim is aggressively scaling its new ventures. The decorative paints brand, Birla Opus, reported market share gains with revenue growth nearly three times the industry average. The B2B e-commerce platform, Birla Pivot, reached an annualized revenue run-rate milestone of **₹8,500 crore**. In a major strategic move, Global Infrastructure Partners (GIP) is set to invest up to **₹3,000 crore** in Aditya Birla Renewables Limited. This capital influx, along with a recent **₹500 crore** injection from Essel Mining, is designed to accelerate the group’s expansion into sustainable energy. **Stock and Market Performance** The market responded positively to the results. As of February 9, 2026, Grasim’s share price stood at **₹2,926.30**, a gain of **3.15%** for the day. The company’s market capitalization is currently valued at approximately **₹1,93,013 crore**. Over the past year, the stock has delivered a **17.64%** return, outperforming several sectoral peers. Investors are monitoring the company’s debt-to-equity ratio, which edged up to **1.26** due to ongoing capital expenditure in paints and renewable energy. **Future Outlook** The company is undergoing significant corporate restructuring, including the merger of Aditya Birla Finance into Aditya Birla Capital to streamline financial services. With all six greenfield paint plants now operational and cement capacity expansion targets set for **240.8 MTPA** by 2028, the group is positioned for long-term industrial leadership. Macroeconomic indicators remain supportive, with India’s WPI inflation for manufactured products holding steady at **0.83%** and the Union Budget for FY26 focusing on manufacturing and energy security. These factors provide a stable backdrop for Grasim’s continued expansion in the domestic market.

US Equity Markets Edge Higher Ahead of Economic Reports
Wall Street’s main indexes edged higher on Tuesday, February 10, as tech shares extended a rebound following a recent period of high volatility. The market mood was bolstered by tech giants and renewed optimism around artificial intelligence spending, even as investors digested mixed economic signals. The Dow Jones Industrial Average rose by 396 points, or 0.79%, reaching a new record level above 50,400. Gains were led by major names like Disney, American Express, and Salesforce. The S&P 500 hovered near 6,980, adding 0.20%, while the Nasdaq 100 traded slightly higher at approximately 25,315. Tech stocks remained the primary focus for traders. Nvidia, AMD, and Broadcom each gained roughly 1% following strong January order reports from major semiconductor suppliers. However, Alphabet fell over 1% despite strong interest in its recent bond issuance. In the consumer sector, Coca-Cola saw a decline of over 3% after its fourth-quarter revenue missed analyst estimates. Crucial economic data released this morning showed that U.S. retail sales for December were essentially flat, coming in well below the expected 0.4% increase. This disappointing figure suggested a more fragile consumer environment following the holiday period. Market participants are now shifting their attention to upcoming labor and inflation reports. The January jobs report is scheduled for release on Wednesday, with expectations of 68,000 new payrolls and an unemployment rate of 4.4%. These figures will be vital in determining the Federal Reserve's next move regarding interest rates. In other markets, gold prices surged to a new record, surpassing $5,000 per ounce as investors sought safe-haven assets amid ongoing policy uncertainty. Treasury yields trended lower following the weak retail sales data, as traders increased bets on multiple interest rate cuts throughout the year. Corporate earnings continue to drive individual stock movements. While S&P Global reported profits above expectations, companies like CVS Health faced pressure after issuing lower-than-expected projections for the current fiscal year. Energy giant BP also reported a significant underlying profit of $7.5 billion for 2025, though it suspended its share buyback program to prioritize balance sheet strength.

Britannia Industries Q3: Net Profit Rises 17% to Rs 680 Crore on 8% Revenue Growth
Britannia Industries has delivered a robust financial performance for the third quarter of the 2026 fiscal year, ending December 31, 2025. The company reported a consolidated net profit of 682 crore, marking a significant 17.1% increase compared to the same period last year. This growth trajectory was supported by a 9.5% rise in consolidated sales, reaching 4,885 crore for the quarter. The results reflect a return to healthy growth patterns, as profit margins expanded faster than revenue, driven by a combination of volume recovery and efficient cost management. Market momentum remains strong within the core biscuit segment, further bolstered by adjacent categories. Strategic product innovations played a pivotal role this quarter, with new offerings like the 50-50 Dipped range, 'Doodh' Marie Gold, and several 'Veg' cake variants gaining traction among consumers. The company is benefiting from a relatively stable commodity environment. Retail prices for key raw materials have shown a cooling trend, with average wheat prices at approximately 31.72 per kg and sugar at 46.30 per kg as of February 2026. This stability, alongside the gradual materialization of GST rate reduction benefits, has allowed for improved gross margins, which reached approximately 42% in recent estimates. In the broader FMCG landscape, Britannia continues to maintain its leadership in the biscuit market. The sector is seeing a shift toward premiumization and health-conscious choices, such as high-fiber and fortified products. While the overall FMCG index faced a 7.7% decline in January 2026 amid market volatility, food-focused companies like Britannia have shown resilience due to consistent demand and effective inventory management. Investor sentiment remains largely positive, with the company’s stock trading at roughly 5,874 as of the latest market close. A significant majority of market analysts maintain a "Buy" rating, citing a high Return on Equity of 52.9% and a healthy dividend payout ratio of 80.1%. Looking at the nine-month performance for FY26, the company has accumulated consolidated sales of 14,172 crore and a net profit of 1,857 crore. This represents a 14.7% year-on-year increase in profitability, confirming a steady recovery in rural demand and sustained interest in premium snack portfolios.