Bullish News
Collection
Investment Analysis of Aye Finance IPO for Long-Term Investors
Aye Finance is entering the public market with a ₹1,010 crore initial public offering, scheduled to open for subscription from February 9 to February 11, 2026. The capital raise is structured as a fresh issue of shares worth ₹710 crore and an offer for sale totaling ₹300 crore. The company has set a price band of ₹122 to ₹129 per share. Retail investors can participate with a minimum investment of ₹14,964 for a single lot of 116 shares. The offering values the lender at approximately ₹3,184 crore at the upper price limit. The fresh capital is earmarked to bolster the company’s capital base, supporting its expansion across the micro and small enterprise (MSE) lending landscape. As of September 2025, Aye Finance manages assets totaling ₹6,027 crore and serves more than 5.86 lakh active customers. Financial performance shows a strong growth trajectory. Total income rose to ₹1,459 crore for the fiscal year ending March 2025, up from ₹1,040 crore in the previous year. Net profit for the same period stood at ₹175 crore. This growth is driven by a "phygital" model that combines 568 physical branches with digital underwriting. While the company maintains a robust 12.12% return on net worth, it faces challenges typical of the sector. Gross Non-Performing Assets (NPA) stood at 4.21% as of late 2025, reflecting the inherent volatility of lending to micro-businesses. Approximately 38% of its loan book consists of unsecured credit. The MSME lending market in India continues to expand, with an estimated credit gap of ₹30 lakh crore. This gap presents a significant opportunity for specialized NBFCs like Aye Finance, even as the sector deals with rising compliance costs and a shift toward digital integration. Shares are expected to list on the BSE and NSE on February 16, 2026. Early grey market indicators suggest a modest premium, reflecting cautious optimism as the company transitions from private equity backing to public ownership. Major investors, including CapitalG and LGT Capital, are partially divesting through the offer for sale component.
RBI Signals Post-December Policy Pause Amid Rising Inflation Pressures
The Reserve Bank of India (RBI) has signaled a shift toward stability, maintaining the benchmark repo rate at 5.25% following its February 2026 meeting. This decision marks a definitive pause in the recent easing cycle, which saw cumulative rate cuts of 125 basis points over the past year. While some analysts previously hoped for a final reduction, the central bank’s transition to a "neutral" stance suggests that the window for further monetary stimulus has effectively closed. Economic growth remains a primary driver for this cautious approach. The RBI recently upgraded its GDP growth forecast for the 2025-26 fiscal year to 7.4%, up from the previous estimate of 7.3%. This optimism is fueled by strong domestic consumption and a significant revival in manufacturing activity. Projections for the first half of the 2026-27 fiscal year also look robust, with growth expected to hold steady at 6.9% to 7.0%. Inflation dynamics are evolving, prompting the central bank to stay vigilant. While headline inflation remained at a benign 1.33% in December 2025, the RBI has nudged its full-year forecast for 2025-26 up to 2.1%. Looking further ahead, inflation is projected to climb toward 4.0% in early 2026-27 due to unfavorable base effects and rising prices in precious metals. This upward trajectory reinforces the likelihood of a prolonged pause in rate adjustments. The external sector has received a massive boost from landmark trade agreements. India recently finalized a major deal with the United States, targeting a total trade value of $500 billion and slashing tariffs on Indian goods from 50% to 18%. Simultaneously, a comprehensive Free Trade Agreement with the European Union has been inked, which is expected to eliminate or reduce duties on over 96% of exports. These deals are anticipated to be highly growth-accretive, further reducing the need for aggressive monetary support. Financial markets have reacted with a mix of volatility and consolidation. Following the recent Union Budget 2026, the Nifty 50 and Sensex experienced sharp swings, with the Nifty trading near the 25,750 level. The rupee has faced some pressure, weakening beyond ₹90 against the US dollar, which further complicates the case for any additional rate cuts. For the average consumer, this policy environment means stability. Home and auto loan EMIs are expected to remain unchanged for the foreseeable future. With the central bank prioritizing "growth with stability," the focus has moved from cutting costs to ensuring the transmission of previous rate hikes while monitoring global geopolitical risks and commodity price volatility.

Mixed Performance in Seafood Sector Driven by Cost Pressures and Competitive Landscape
**MARKET BRIEF: SEAFOOD SECTOR REBOUND** The Indian seafood industry is entering a high-velocity recovery phase following the landmark India-US trade deal finalized in early February 2026. This agreement effectively reverses the severe tariff shocks of 2025, which at their peak reached nearly 58% for shrimp exports. Under the new framework, the US has slashed reciprocal tariffs on Indian marine products to 18%, down from the previous 25% to 50% range. **Stock Market Reaction** The news triggered an immediate rally in seafood-linked equities. Major players like Avanti Feeds and Apex Frozen Foods surged 20% in single sessions following the announcement. Other notable gainers included Zeal Aqua, which jumped over 10.5%, and Kings Infra Ventures, rising 7.6%. This reflects renewed investor confidence after a period of intense caution and margin pressure. **Export Dynamics & Pricing** The US remains India’s primary seafood market, valued at approximately 2.78 billion USD. Despite a 6.3% value decline in early FY26 due to punitive duties, the volume of exports is expected to return to historical levels quickly. India now holds a competitive edge, with its 18% tariff placing it slightly ahead of regional rivals like Indonesia and Thailand (19%) and Vietnam (20%). Domestic shrimp prices in Andhra Pradesh are already seeing upward movement. Vannamei white shrimp prices rose by 5 rupees per kg recently, driven by tight off-season supply. Total shrimp production for 2026 is forecasted to exceed 1 million tons, with Monodon (black tiger shrimp) output expected to double to 150,000 tons. **Strategic Shifts** While the US deal is the primary catalyst, Indian exporters have successfully diversified to mitigate past risks. Non-US markets now account for 57% of total exports, with significant growth in China, Belgium, and Vietnam. The European Union has also bolstered the sector by approving 102 new Indian fisheries for export, validating improved food safety standards. **Outlook** The global seafood market is projected to reach 278 billion USD in 2026. India’s focus on value-added products and increased aquaculture capacity positions it to capture a significant share of this growth. However, exporters remain vigilant regarding ongoing US anti-dumping reviews, which recently assigned new duty rates between 2.7% and 5.1% for specific major exporters.

Daily Market Outlook and Trade Setup
Indian equity benchmarks exhibited resilient performance on February 9, 2026, building on a recovery trend observed during the previous week. The Nifty 50 closed at **25,693.70**, marking a gain of **50.90 points** or **0.20%**. Market sentiment has steadied following the Reserve Bank of India’s (RBI) latest monetary policy decision. The central bank maintained the repo rate at **5.25%** and kept its stance "neutral." This move, coupled with a comfortable inflation outlook for FY26 projected at **2.1%**, has provided a stable backdrop for domestic investors. The BSE Sensex mirrored this positive movement, finishing at **83,580.40**, an increase of **266 points**. Sectoral performance was notably led by the FMCG and private banking sectors. High-weightage stocks such as ITC saw a significant surge of **5.2%**, supported by strong quarterly earnings and strategic price hikes. Other top performers included Kotak Mahindra Bank and Hindustan Unilever, which gained between **2.7%** and **3.3%**. In contrast, the Information Technology (IT) sector faced headwinds, with TCS and Tech Mahindra declining by nearly **1.8%**. The broader market indices showed slight fatigue, as the Nifty Midcap 100 and Smallcap 100 closed marginally lower by **0.2%** and **0.3%** respectively. Foreign Institutional Investors (FIIs) have returned to a buying mode, recording a net purchase of **₹1,950.77 crore** in the cash segment. Conversely, Domestic Institutional Investors (DIIs) were net sellers, offloading shares worth **₹1,265.06 crore**. The Indian Rupee has shown strength, trading near **90.35** against the US Dollar. This appreciation follows progress on a potential trade deal between New Delhi and Washington, which has boosted local sentiment and helped stabilize the currency against global fluctuations. Analysts maintain that while the Nifty targets a psychological level of **26,000**, the market may enter a range-bound phase. Support is currently established around the **25,500** level, with the 200-day moving average providing a long-term safety net near **25,180**. Any significant dips are being viewed by institutional players as accumulation opportunities amidst ongoing global uncertainties.
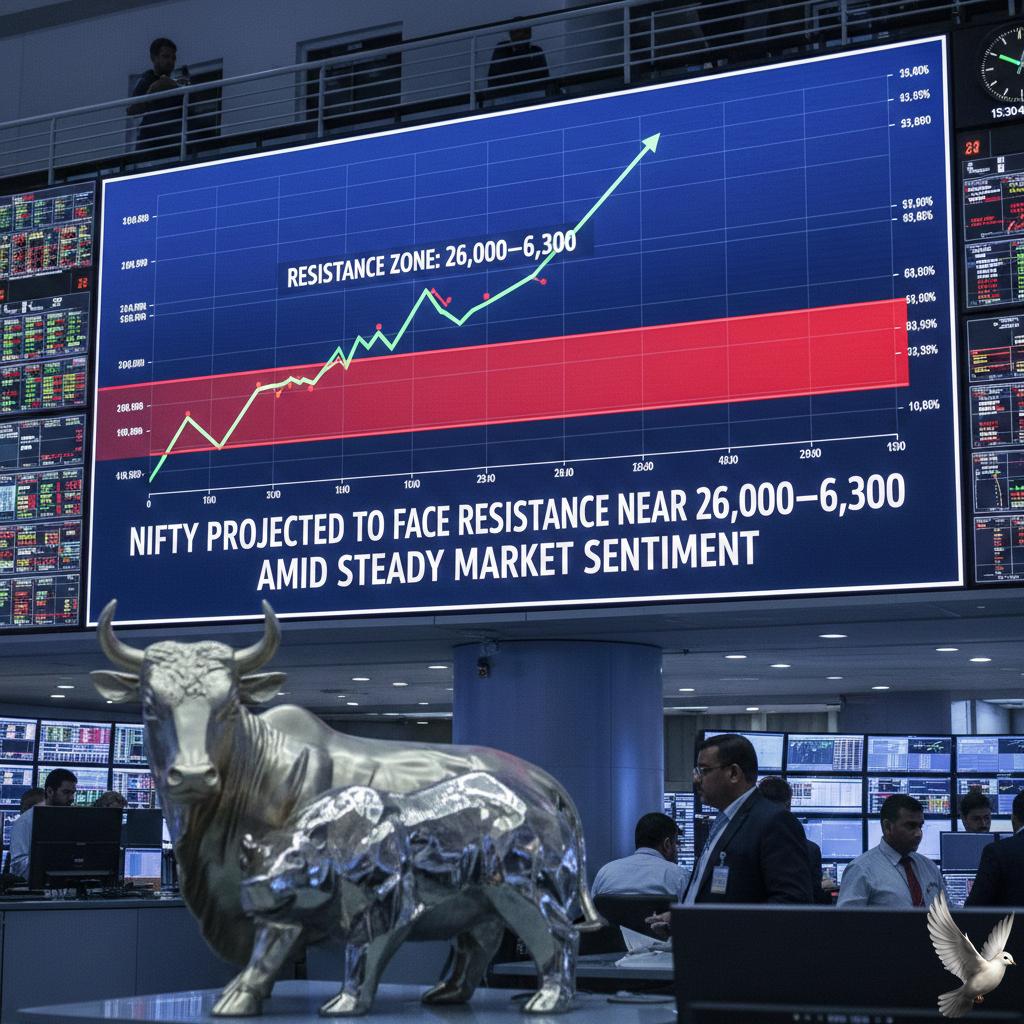
Nifty Projected to Face Resistance Near 26,000–26,300 Amid Steady Market Sentiment
Market Brief: Nifty Outlook and Strategy The Nifty 50 enters the week of February 9, 2026, with a resilient undertone, currently hovering near the 25,700 mark. This follows a period of consolidation where the index successfully reclaimed ground after post-budget volatility. Sentiment has been bolstered by a landmark India-US trade agreement and the RBI’s decision to maintain the repo rate at 5.25%, signaling a focus on structural growth and a robust 7.4% GDP forecast. Key technical levels are clearly defined for the upcoming sessions. Immediate support is established at 25,550, with a more significant floor at the 25,350–25,200 zone. On the upside, 25,800 remains the immediate hurdle. A decisive breach above this level could trigger momentum toward the 26,000 psychological barrier, with further resistance layered up to 26,300. The derivatives landscape shows improving support as Put writers have shifted their positions upward to the 25,500 level. Meanwhile, the India VIX has cooled to approximately 11.94, indicating a notable reduction in market fear. Analysts suggest that the market remains in a "buy on dips" phase as long as it sustains above the 25,550 threshold. For the February 10 weekly expiry, a moderately bullish Bull Call Spread is a preferred strategy among market experts. This involves buying the 25,700 Call and selling the 25,900 Call. This approach aims to capitalize on a steady upward bias while capping the maximum loss at approximately 3,770 per lot and lowering the breakeven point to 25,758. Sector-specific action is expected to dominate the narrative. Large-cap earnings remain a primary trigger, with results from majors like State Bank of India, Tata Steel, and Mahindra & Mahindra in focus. While the broader market shows some caution, IT and Healthcare have emerged as defensive pillars. Additionally, two mainboard IPOs totaling nearly 3,800 crore are set to test liquidity this week. Traders should monitor the 25,800 level closely, as a sustained move above it could open the doors for a retest of lifetime highs. Conversely, any slip below 25,500 may invite fresh profit-booking, potentially dragging the index toward the 25,000 support region. A disciplined approach with strict stop-losses is recommended to navigate the current range-bound environment.

Market Outlook: 10 Key Factors for Monday’s Trading Session
Indian benchmark indices concluded the week on a positive note, staging a sharp late-session recovery. The BSE Sensex advanced **266.47 points** or **0.32%** to settle at **83,580.40**. Meanwhile, the Nifty 50 gained **50.90 points** or **0.20%** to finish at **25,693.70**. The recovery was largely driven by the Reserve Bank of India’s decision to maintain the repo rate at **5.25%** and keep a "Neutral" stance. Positive sentiment was further bolstered by an upgraded GDP growth forecast for the fiscal year, now pegged at **7.4%**. Consumer-facing sectors led the gains. ITC emerged as the top performer, surging **5.21%** following reports of price hikes and strong quarterly earnings. Other major gainers included Kotak Mahindra Bank, which rose **3.33%**, and Hindustan Unilever, up **2.97%**. Private banking stocks provided significant support, helping the indices bounce back from an intraday low of **82,925.35** on the Sensex. Buying interest in Bharti Airtel and Bajaj Finance also contributed to the upward momentum toward the closing bell. However, gains remained capped due to persistent weakness in the technology sector. IT heavyweights faced selling pressure amid global concerns over profit margins, with Tech Mahindra and TCS dropping **1.84%** and **1.72%** respectively. The automotive and pharmaceutical sectors also struggled to find momentum. Tata Motors and Bajaj Auto saw declines of over **1.3%**, while profit-taking limited the performance of several healthcare names. Institutional activity remained divergent as the market processed the latest budget implications. Domestic Institutional Investors provided a cushion against foreign outflows, helping the Sensex record a weekly gain of **1.6%**. Market volatility, as measured by the India VIX, cooled significantly to approximately **11.5**, suggesting reduced anxiety among participants following the central bank's policy clarity. Investors now look toward upcoming global cues and the final leg of the corporate earnings season for further direction.
Silver Falls More Than 16%, Erasing Two-Day Recovery
**MARKET BRIEF: PRECIOUS METALS UPDATE** **Snapshot: Volatility & Divergence** The precious metals sector is currently navigating a period of extreme turbulence following a historic sell-off. After erasing recent record gains, the market is showing signs of a fractured recovery as of **February 5, 2026**. **Gold (XAU/USD)** has managed to arrest its freefall, staging a rebound to trade near the **$5,016 per ounce** level. This represents a **1.1%** intraday gain, though it remains significantly below its recent all-time high of approximately **$5,600**. **Silver (XAG/USD)**, however, remains under intense pressure. In stark contrast to gold’s stabilization, silver futures on the MCX have hit lower circuits, trading near **₹2,80,000 per kg**. The white metal has suffered a dramatic collapse, dropping nearly **46%** from its recent peaks, highlighting a severe liquidity crunch and panic selling in the industrial metal. **Key Drivers of the Crash** The "significant drop" mentioned in previous reports has been catalyzed by three specific, high-impact developments: **1. The "Warsh" Hawk Factor** Investor sentiment shifted violently following the nomination of **Kevin Warsh** as the next Federal Reserve Chair. Known as an "inflation hawk" who favors a smaller central bank balance sheet, his nomination triggered a rapid repricing of interest rate expectations. Markets are now pricing in higher real rates for longer, which strengthens the US Dollar and acts as a direct headwind for non-yielding assets like bullion. **2. Regulatory Crackdown & Margin Calls** A major liquidity squeeze was triggered when the **CME Group** raised margin requirements for silver futures. This forced highly leveraged speculative traders to liquidate positions immediately to cover costs, exacerbating the sell-off. This regulatory move is a primary reason why silver has underperformed gold so significantly during this correction. **3. US Dollar (DXY) Resurgence** The US Dollar Index has rebounded to the **97.50** level. As the greenback strengthens on the back of hawkish Fed signals and solid economic data (such as the recent ADP payroll report), dollar-denominated commodities have become more expensive for international buyers, dampening demand. **Market Outlook** **Short-Term: Caution Advised** Analysts suggest that volatility will remain elevated until there is definitive clarity on the Federal Reserve's immediate policy path under the new leadership. The divergence between gold and silver suggests the market is still searching for a floor. While gold is re-attracting safe-haven flows due to lingering geopolitical tensions in the Middle East (specifically involving Iran-US discussions), silver remains vulnerable to industrial demand concerns. **Long-Term: Structural Support** Despite the brutal short-term correction, the macro thesis for precious metals remains intact. Leading financial institutions, including **J.P. Morgan**, maintain a bullish long-term forecast, projecting gold prices could average **$5,400 per ounce** by 2027. The "buy-the-dip" narrative is supported by: * Continued central bank accumulation of gold reserves to diversify away from fiat currencies. * Persistent global debt concerns and "de-dollarization" trends. * Structural supply deficits in silver relative to its demand in green energy technologies (solar and EVs). **Summary** The market has shifted from a euphoric rally to a defensive stance. While the "historic rout" has shaken out speculative froth—particularly in silver—gold’s ability to hold the **$5,000** psychological support level indicates that the long-term bull market, while bruised, is not broken. *** **
Tata Power Shares Traded Following 4% Year-on-Year Revenue Decrease to Rs 14,485 Crore
**Market Brief: Tata Power Q3 FY26 Performance** **Financial Snapshot** Tata Power reported a mixed set of numbers for Q3 FY26. Consolidated **Profit After Tax (PAT)** stood at **Rs 1,194 crore**, marking a marginal **1%** year-on-year increase. However, **Revenue from Operations** declined by approximately **9%** to **Rs 13,948 crore**, weighed down by lower power demand and the temporary suspension of operations at the Mundra plant for overhauling. Despite the topline pressure, operational efficiency remained robust. **EBITDA** grew by **12%** to **Rs 3,913 crore**, supporting margins. The bottom line was impacted by a one-time exceptional expense of **Rs 78 crore** related to the implementation of new labor codes. **Renewable Energy Surge** The renewable energy segment emerged as the quarter's standout performer. Segment PAT skyrocketed **156%** to **Rs 547 crore**, driven by accelerated execution and manufacturing output. Key operational milestones include: * **10 GW Milestone:** The company surpassed **10 GW** in cumulative renewable EPC (Engineering, Procurement, and Construction) execution. * **Solar Manufacturing:** Cell production jumped nearly **5x** to **940 MW**, while module production reached **990 MW**. * **Rooftop Solar:** Business remains strong with cumulative installations now exceeding **4 GWp**, following a **372 MWp** addition in Q3 alone. **Market Reaction & Stock Action** Investors shrugged off the revenue dip, focusing instead on the strong operational core and renewable growth. The stock closed **1.63%** higher at **Rs 371.05** following the announcement. The company currently commands a market capitalization of approximately **Rs 1.16 lakh crore**. **Future Outlook** Management expressed optimism for the remainder of FY26, citing favorable macro conditions and rising power demand from industrial sectors. The company continues to aggressively scale its clean energy capacity, targeting **66%** clean energy in its generation portfolio upon the completion of ongoing projects.

Market Outlook 2026: Five Long-Term Stock Picks Including Adani Ports and Ventive Hospitality With Projected Returns of 10-40%
**Market Brief: Infrastructure, Consumer & Hospitality Opportunities** **Overview** Brokerages remain selectively optimistic on India's core growth themes. Infrastructure, industrial consumption, and premium hospitality are showing resilience. Below is the updated snapshot for key picks as of **February 5, 2026**. **Infrastructure & Industrials** **Adani Ports & SEZ (APSEZ)** * **Current Price:** ~₹1,530 * **Target:** ₹1,775+ (Consensus Buy) * **Outlook:** Volumes remain robust with the **Vizhinjam Port Phase 2** expansion (₹16,000 Cr capex) acting as a major trigger. The stock has seen steady accumulation, supported by strong cargo growth estimates of **12-15% YoY**. * **Verdict:** A primary play on India’s logistics boom. **Exide Industries** * **Current Price:** ~₹322 * **Target:** ₹370 – ₹390 * **Outlook:** The stock is consolidating as the market prices in the transition to **EV battery manufacturing** (Li-ion gigafactory). While legacy lead-acid demand remains a cash cow, the re-rating depends on faster execution in the EV segment. * **Verdict:** Long-term hold for the green energy transition. **Consumer & Chemicals** **Varun Beverages Ltd (VBL)** * **Current Price:** ~₹445 * **Upside Potential:** ~30% (Target ₹580+) * **Outlook:** Recent corrections offer an entry point. The company delivered a **10%+ volume beat** in the latest quarter, driven by expanded territories and international operations. * **Verdict:** A disciplined FMCG compounder with reduced seasonality risks. **Pidilite Industries** * **Current Price:** ~₹1,460 * **Trend:** Neutral to Positive * **Outlook:** Q3 FY26 results showed **double-digit revenue growth**, aided by stable input costs (VAM prices) and a recovery in rural demand. Margins have expanded, sustaining its premium valuation. * **Verdict:** Defensive bet on housing and renovation demand. **New-Age Hospitality** **Ventive Hospitality** * **Current Price:** ~₹772 * **52-Week High:** ₹840 * **Outlook:** Since its listing in late 2024, Ventive has established itself as a pure-play luxury asset owner (operating **Ritz-Carlton, JW Marriott** properties). * **Key Trigger:** Expansion of the Marriott partnership and rising Average Room Rates (ARRs) in the premium segment. * **Verdict:** High-growth play in the luxury travel upcycle. **Summary Strategy** **Adani Ports** and **Varun Beverages** offer the clearest immediate upside based on earnings visibility. **Ventive Hospitality** is a strong satellite portfolio addition for exposure to the premium consumption theme.

Force Motors Q3 Net Profit Rises 250% YoY to Rs 406 Crore
**Force Motors Q3 Earnings Brief: Record Profits & Operational Surge** **Executive Summary** Force Motors has delivered a standout performance for the third quarter of FY26, reporting record-breaking profitability driven by robust operational momentum and significant exceptional gains. The company’s consolidated net profit witnessed a massive triple-digit surge, cementing its strongest quarterly showing to date. **Financial Highlights (Q3 FY26)** **Net Profit** Consolidated net profit skyrocketed **252% YoY** to **Rs 406.1 crore**, a sharp rise from **Rs 115.3 crore** in the corresponding quarter last year. This aggressive growth was underpinned by a one-time gain of approximately **Rs 211 crore**, largely attributed to government incentives under the Madhya Pradesh Industrial Investment Promotion Assistance Scheme. **Revenue** Revenue from operations climbed **12.6% YoY** to **Rs 2,128 crore**, up from **Rs 1,889.5 crore** in the previous year. This double-digit top-line growth indicates sustained demand for the company’s core utility and commercial vehicle portfolio, despite broader headwinds in the automotive sector. **EBITDA & Margins** Operational efficiency improved significantly, with EBITDA surging **61.4% YoY** to **Rs 373.8 crore**. Consequently, EBITDA margins expanded substantially to **17.5%**, a marked improvement from **12.3%** a year ago. This margin expansion highlights better fixed-cost absorption and the success of recent cost-optimization measures. **Sales Volume Analysis** **January 2026 Performance** Momentum continued into the fourth quarter, with total sales for January 2026 recorded at **3,764 units**, representing a **4.64% YoY** increase. * **Domestic Sales:** The domestic market remains the primary growth driver, contributing **3,665 units**, a rise of **4.92% YoY**. Demand remains particularly strong in the shared mobility and school bus segments. * **Exports:** Export volumes remained muted, dipping slightly by **4.8%** to **99 units**, reflecting ongoing global macroeconomic challenges. **Market Context & Stock Action** **Share Price Movement** Following the results, Force Motors shares have seen heightened activity. As of early February 2026, the stock is trading in the **Rs 20,000 – Rs 20,069** range. The counter has delivered multibagger returns over the longer term, supported by its dominant market share in the Traveller segment and niche positioning with the Gurkha brand. **Valuation & Sentiment** Investors have reacted positively to the profit surge, though analysts note that a significant portion of the bottom line was driven by the **Rs 288 crore** gross exceptional income (net impact ~Rs 211 crore). Adjusted for this one-off, core operating profit growth remains healthy at over **60%**, validating the underlying business strength. **Strategic Outlook & Regulatory Watch** **No Forward Guidance** Management has not provided specific volume guidance for the remainder of FY26, maintaining a cautious stance. This lack of explicit forward-looking statements has led to some speculation regarding the sustainability of the current growth rate sans exceptional items. **Regulatory Headwinds** A key area to watch is the implementation of the *Environment Protection (End-of-Life Vehicles) Rules, 2025*, effective April 1, 2025. Management has flagged this as a potential variable, stating that the financial impact cannot yet be reliably estimated. This regulatory uncertainty remains a critical monitoring point for institutional investors assessing long-term capital expenditure requirements. **Conclusion** Force Motors has effectively leveraged a favorable product mix and government incentives to post a historic quarter. While the **252%** profit jump is the headline grabber, the **17.5%** EBITDA margin demonstrates genuine operational improvement. The focus now shifts to whether the company can sustain this margin trajectory in the absence of one-off gains as it navigates impending regulatory changes in the next fiscal year.

Marico to Acquire Wellness Brand for Rs 375 Crore
**MARKET BRIEF: Marico’s Strategic Bet on Plant-Based Wellness** **The Deal** FMCG giant Marico Limited has signed definitive agreements to acquire a **60%** majority stake in Cosmix Wellness, a direct-to-consumer plant-based nutrition brand. The transaction values the Bengaluru-based startup at approximately **Rs 375 crore**, with the initial investment reportedly around **Rs 226 crore**. Marico retains the right to acquire the remaining stake after FY29, contingent on performance milestones. **Target Profile** Founded in 2019, Cosmix has quickly scaled to an Annual Recurring Revenue (ARR) of nearly **Rs 100 crore** as of early 2026. The brand is profitable and specializes in functional superfood blends and plant protein, catering to the rapidly expanding "clean label" consumer base. This addition complements Marico’s existing digital-first portfolio, which includes Plix, True Elements, and Beardo. **Strategic Impact** This acquisition aligns with Marico’s "Thrasio-style" aggregation strategy, aiming to derive **25%** of its domestic revenue from premium foods and personal care by 2028. By integrating Cosmix, Marico strengthens its foothold in the Indian plant-based nutrition market, a sector projected to grow at a CAGR exceeding **30%** over the next five years. **Market Reaction** Following the announcement, Marico’s stock traded near **Rs 733.40**, reflecting a neutral-to-positive sentiment. Analysts view the move as a long-term value driver, reducing reliance on the core hair oil business while tapping into high-margin wellness trends. The stock currently trades at a P/E ratio of approximately **49x**, signaling sustained investor confidence in its diversification roadmap.

India Tax Hike Impacts $36 Billion Arbitrage Trade
**Market Brief: Arbitrage Fund Outlook Post-Budget 2026** **Regulatory Shock for Derivative Markets** The Union Budget 2026-27 delivered a sharp surprise to India's financial markets with a significant hike in the Securities Transaction Tax (STT). The levy on futures contracts has surged **150%**, rising from **0.02% to 0.05%**, while the tax on options premiums has increased to **0.15%**. This policy shift is explicitly designed to curb excessive speculation in the derivatives segment, which has seen explosive growth in retail participation. **Direct Hit to Arbitrage Yields** Arbitrage funds, which rely heavily on the cash-futures spread to generate low-risk returns, face immediate operational headwinds. Industry estimates project a direct contraction in annual returns by approximately **25 to 35 basis points (bps)**. Since these funds typically roll over futures positions monthly, the increased transaction costs will persistently erode the spread available to investors. **Current Performance & Competitive Positioning** Despite the tax hike, the arbitrage category remains a heavyweight, managing assets exceeding **$36 billion**. Recent data indicates these funds are delivering annualized returns in the **6.8% – 7.1%** range. While the net yield will dip, experts note that the segment retains a critical tax advantage over liquid funds. Arbitrage gains are taxed as equity (**20%** for short-term, **12.5%** for long-term), whereas debt fund returns are taxed at the investor's marginal slab rate, which can be as high as **30-39%**. **Strategic Outlook** Fund managers are recalibrating strategies to mitigate the impact of higher transaction costs. The consensus suggests that while the "easy money" period of wider spreads may be tightening, the category's post-tax efficiency continues to offer a defensive edge for high-net-worth investors navigating a volatile equity landscape. *** ... [India's derivatives tax hike rattles market sentiment](https://www.youtube.com/watch?v=VeRUPWygWU8) This video provides essential context on the government's rationale for the tax increase and the immediate reaction from the investor community. http://googleusercontent.com/youtube_content/0
JSW Cement Reports Q3 Profit Turnaround With 13% Revenue Growth
**MARKET BRIEF: JSW Cement Q3 FY26 Performance & Strategic Outlook** **Financial Turnaround & Key Metrics** JSW Cement has reported a definitive turnaround for the quarter ended December 31, 2025 (Q3 FY26), shifting from a loss in the previous year to a net profit of **₹130.6 crore**. This profitability is underpinned by a **13%** year-on-year rise in consolidated revenue, which reached **₹1,621 crore**. Operational efficiency drove significant gains, with EBITDA surging **32%** to **₹285.1 crore**. Consequently, operating margins expanded to **17.6%**, up from 15.1% in the corresponding quarter of the previous fiscal year. Total sales volume climbed **14%** to **3.56 million tonnes**, led by a **17%** jump in Ground Granulated Blast Furnace Slag (GGBS) volumes and a **7%** increase in cement volumes. **Strategic Expansion & Credit Profile** The company is aggressively widening its footprint both domestically and internationally. A key development is the establishment of a **1.65 MTPA** grinding unit in Fujairah, UAE, with a planned capital expenditure of approximately **$39 million**. This marks JSW Cement’s entry into the global manufacturing arena. On the domestic front, the first phase of the integrated unit in Nagaur, Rajasthan, is scheduled for commissioning in **Q4 FY26**. These projects align with the company's broader target to reach a grinding capacity of **41.85 MTPA**. Reflecting improved leverage metrics and operational stability, CRISIL has upgraded JSW Cement’s long-term credit rating to **'AA-/Stable'** from 'A+/Stable'. **Market Position** Listed on the bourses since August 2025, the stock continues to attract investor attention following this robust quarterly performance. Recent trading data shows the share price hovering around the **₹116** level on the NSE and BSE. The combination of a financial turnaround, confirmed capacity additions, and a stronger credit profile positions the company favorably within the competitive infrastructure materials sector.

Hero MotoCorp Share Price Live: Stock Registers Three-Month Gains
The Indian equity markets are navigating a period of high intensity following the Union Budget and a landmark trade agreement with the United States. As of February 5, 2026, the benchmark indices have stabilized after a historic single-day rally, with the **Nifty 50** holding firm above the **25,750** level and the **Sensex** positioned near **83,800**. Market sentiment is currently balanced between optimism over improved trade ties and caution ahead of the Reserve Bank of India’s (RBI) monetary policy decision. While the India-US trade deal sparked a surge of over **2.5%** in a single session earlier this week, the momentum has slightly cooled as investors seek concrete documentation of the agreement. Index Performance and Levels The **Nifty 50** recently closed at **25,776**, gaining **0.19%**, while the **Sensex** ended at **83,817**, up **0.09%**. Technical indicators show the Nifty maintaining its position above the **20-day Exponential Moving Average (EMA)** of **25,648**, which now serves as a primary support zone. Resistance is anticipated between **26,000** and **26,200**. The broader market continues to outperform the benchmarks. The **BSE MidCap** index rose by **1.9%** and the **SmallCap** index surged **2.6%** in recent trade. This indicates a "risk-on" appetite among retail and domestic investors, even as large-cap movements remain measured. Sectoral Trends Energy and Power sectors are leading the current gains, with companies like **NTPC** and **Power Grid** seeing significant buying interest. The consumption space is also active, led by **Trent**, which recently gained over **5%**. Conversely, the Information Technology (IT) sector is facing a sharp downturn. Major players including **Infosys** and **TCS** have seen corrections of **6% to 7%** following a tech rout in US markets. Concerns over high valuations and shifting spending patterns in global tech are weighing heavily on Indian software exporters. Macroeconomic Indicators The **Indian Rupee** has shown remarkable resilience, recently settling near **90.43** against the US Dollar. This follows a record single-day gain of **122 paise** earlier in the week, marking its best performance in years. Oil prices remain a supportive factor for the domestic economy. **Brent Crude** is trading near **$66 per barrel**, with projections suggesting a potential move toward **$55** by the end of the first quarter. Lower energy costs are expected to keep retail inflation within the RBI's target range. Institutional Activity and Policy Institutional flows show a divergence in strategy. While **Domestic Institutional Investors (DIIs)** have been net buyers, injecting over **₹2,400 crore** in recent sessions, **Foreign Institutional Investors (FIIs)** remain net sellers, offloading approximately **₹1,800 crore**. All eyes are now on the **RBI Monetary Policy Committee** meeting. Analysts widely expect the repo rate to remain unchanged at **5.25%**. The central bank is likely to maintain a "neutral" stance, focusing on the transmission of previous rate cuts while monitoring the impact of the new trade dynamics on economic growth.
Airtel, Tata Motors PV Among 198 Companies Reporting Q3 Earnings Today
**Market Brief: Earnings Watch (Q3 FY26)** **Date:** February 5, 2026 **Market Overview** Indian equity markets are trading with positive momentum today, with the Nifty 50 holding firmly above the **25,050** mark. Investors remain focused on corporate earnings, with heavyweights across telecom and auto sectors set to release their performance scorecards for the quarter ended December 31, 2025. **Bharti Airtel: Revenue & ARPU Focus** Bharti Airtel releases its Q3 FY26 results today. Analysts expect the telecom major to report "industry-leading" financials, continuing the momentum from Q2 FY26 where it posted a consolidated net profit of **₹8,650 crore** (up 108% YoY). Key metrics to watch include: * **ARPU Growth:** Investors are eyeing average revenue per user (ARPU) expansion, driven by the residual impact of previous tariff hikes and premiumization. * **Subscriber Mix:** Continued migration from 2G to 4G/5G remains a critical growth lever. * **Margins:** EBITDA margins are projected to expand, aided by operational efficiencies and lower spectrum usage charges. **Hero MotoCorp: Festive Demand & Rural Recovery** The world's largest two-wheeler manufacturer is also scheduled to announce its Q3 FY26 numbers today. The stock is currently trading around **₹5,856**, up over **1.6%** in intraday trade, reflecting investor optimism. Expectations for the quarter: * **Robust Topline:** Revenue is projected to grow by approximately **19% YoY**. * **Profitability:** Net profit (PAT) is anticipated to rise by around **17%**, supported by a strong festive season and a recovery in rural markets. * **Product Strategy:** Management commentary on the premiumization strategy and the EV segment (Vida) will be scrutinized closely. **Investor Outlook** The market is pricing in strong execution from both companies. For Airtel, the focus is on sustainable margin expansion, while for Hero MotoCorp, volume growth amid a recovering rural economy is the key monitorable. These announcements are expected to dictate the short-term trend for the broader indices.

Trent Q3 Earnings: Net Profit Rises 3%, Revenue Up 15%
**MARKET BRIEF: Trent Q3 FY26 Earnings & Stock Action** **Trent Ltd** remains in the spotlight following its **Q3 FY26** results, delivering double-digit revenue growth and steady operational expansion despite a challenging consumption environment. The stock reacted positively, surging nearly **5%** as investors focused on the retailer's aggressive store addition pace. **Financial Highlights** * **Revenue Surge:** Consolidated revenue jumped **15% YoY** to **₹5,345 crore**, driven by strong festive demand and aggressive retail footprint expansion. * **Profit Growth:** Net profit rose **3% YoY** to **₹510 crore**, slightly below some street estimates due to a one-time charge related to labour code implementation (₹26 crore). * **EBITDA:** Operating EBITDA climbed **20%** to **₹837 crore**, with operating EBIT margins expanding to **13.8%** (up from 13.2% last year), reflecting improved operational efficiency. **Operational Firepower** The company’s growth engine continues to be fuelled by rapid network expansion: * **Zudio:** Added **48** new stores in Q3, taking the total count to **854** (including UAE presence). * **Westside:** Added **17** new outlets, reaching a total of **278** stores. * **Footprint:** The retailer now operates over **1,100 large-box stores** across 274 cities, covering a retail area of over **15 million sq. ft.** **Market Reaction** Despite initial volatility where the stock dipped in early trade, **Trent** shares staged a sharp recovery to close **~5% higher** at **₹4,013**. The market cheered the resilient top-line growth and stable gross margins in Westside and Zudio, shrugging off concerns about the minor profit miss. **Analyst Sentiment** Brokerage views remain mixed but cautiously optimistic on the long-term story: * **Bulls:** Morgan Stanley maintained an **Overweight** rating, citing the "long runway for growth" and Zudio's dominance in the value fashion segment. * **Bears:** Citi retained a **Sell** rating, flagging valuation concerns and signs of fatigue in same-store sales growth. * **Consensus:** While valuation remains rich, the consistent execution in store rollout keeps Trent as a preferred pick in the discretionary retail space. *** **Next Step:** I can provide a comparative analysis of Trent’s valuation metrics (P/E, EV/EBITDA) against peers like Avenue Supermarts or ABFRL to help gauge if the current price offers an entry point.

Gift Nifty Signals Positive Start as Asian Markets Rise
**Global Market Brief – February 5, 2026** **Equities: Tech Volatility Diverges Markets** US markets are showing a sharp split in performance today. The **Dow Jones Industrial Average** remains resilient, climbing **0.53%** to **49,501** as investors rotate into traditional value sectors. In contrast, the broader **S&P 500** slipped **0.51%** to **6,882**, and the tech-heavy **Nasdaq Composite** fell **1.51%** to **22,904**, weighed down by a significant sell-off in growth stocks. **Sector Focus: AI Doubts Rattle Sentiment** Skepticism regarding the return on investment for massive AI capital expenditures is driving volatility. **Nvidia** declined **3.41%** and **Palantir** dropped **11.62%** as traders reassess valuations. However, pockets of strength remain; **Super Micro Computer Inc.** surged **13.78%**, decoupling from the broader semiconductor weakness. **Crypto: Bitcoin under Pressure** Digital assets are facing a steep correction. **Bitcoin** has retreated to approximately **$84,400**, shedding over **5%** in the last 24 hours. The decline coincides with a broader risk-off sentiment in equities and a wave of leveraged liquidations, dampening immediate speculative enthusiasm. **Commodities: Gold Rallies, Oil Stabilizes** Safe-haven assets are outperforming. **Gold** continues its historic run, breaking past the **$5,000** mark as volatility in the equity market drives demand for stability. In the energy sector, **Brent Crude** is trading around **$69.46** per barrel, balancing geopolitical tensions against demand forecasts. **Key Drivers** The primary market narrative is the scrutiny of "Big Tech" earnings. Results from **Alphabet** and **Microsoft** have intensified questions about the timeline for AI profitability versus soaring infrastructure costs. Investors are now closely watching upcoming economic data for clues on the Federal Reserve's next move regarding interest rates.

9 Stocks Close Above 200 DMA
**Market Brief: Technical Breakout in Nifty500** **Date:** February 04, 2026 **Key Technical Development** A significant technical shift occurred in the Nifty500 universe today as nine stocks closed above their 200-day moving average (DMA). This crossover is widely regarded by traders as a signal of long-term trend reversal, marking a potential shift from a consolidation or bearish phase into a bullish trajectory. **Top Stocks Crossing 200 DMA** Several heavyweights and mid-cap players led this technical breakout: * **Reliance Industries:** Closed at **₹1,456.8**, surpassing its 200 DMA of ₹1,446.1. * **ICICI Bank:** Ended the session at **₹1,408.4**, edging past its long-term average of ₹1,405.5. * **Power Finance Corporation (PFC):** saw strong buying interest, closing at **₹414.6** against a 200 DMA of ₹394.8. * **REC Ltd:** Mirrored the power sector strength, finishing at **₹381.6** (200 DMA: ₹381.5). * **Power Grid Corporation:** Closed at **₹289.4**, clearing its average of ₹284.0. Other notable names joining this breakout list include **J&K Bank** (₹105.4), **Trident** (₹29.3), **Nava** (₹577.8), and **Eternal Ltd** (₹294.2). **Broader Market Context** The breakouts occurred amidst a volatile session for the broader markets. While the Nifty 50 index managed to close higher at **25,776** (+0.19%), the session was defined by a sharp divergence in sectoral performance. * **Sectoral Split:** The Nifty IT index witnessed a steep sell-off, plunging nearly **6%** due to renewed fears over AI-led competition. In contrast, the broader market outperformed, with the Nifty Midcap 100 rising **0.63%** and Smallcap 100 surging **1.27%**. * **Nifty 500 Performance:** The Nifty 500 index reflected this broad-based recovery, closing around **23,506**, signaling that buying appetite remains intact outside the technology sector. **Trend Significance** The ability of these nine stocks to reclaim their 200 DMA despite headline volatility suggests underlying institutional support. For Reliance and ICICI Bank specifically, reclaiming this level often acts as a stabilizing factor for the benchmark indices, potentially setting a floor for near-term corrections.
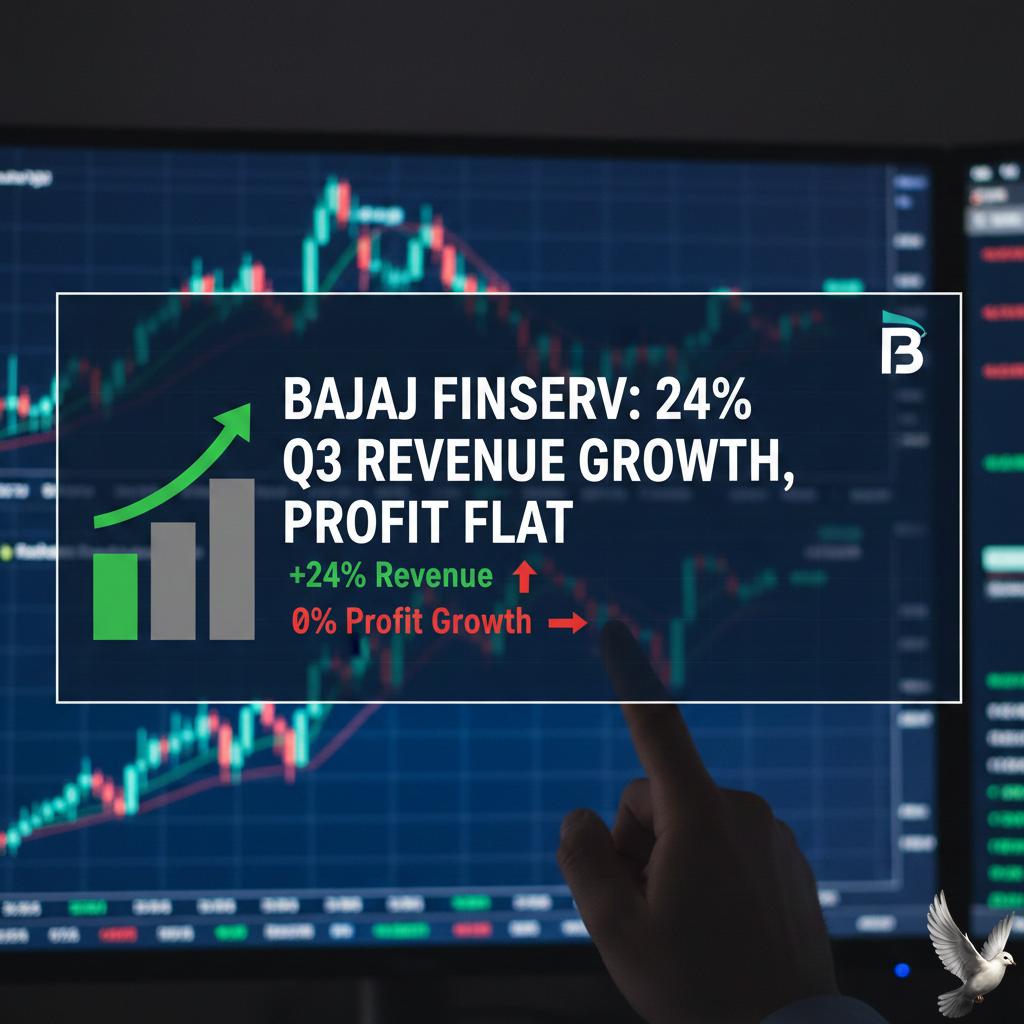
Bajaj Finserv Reports 24% Q3 Revenue Growth With Flat Profit
**MARKET BRIEF: Bajaj Finserv Q3 FY26 Results & Performance** **Overview** Bajaj Finserv Limited reported a resilient set of numbers for **Q3 FY26**, characterized by strong top-line expansion despite one-time operational headwinds weighing on the bottom line. The conglomerate witnessed robust business momentum across its lending and insurance arms, maintaining healthy asset quality and customer acquisition rates. **Financial Highlights** * **Consolidated Revenue:** Surged **24%** year-on-year (YoY) to **Rs 39,708 crore**, driven by broad-based growth in interest income and insurance premiums. * **Net Profit:** Remained flat at **Rs 2,229 crore**, virtually unchanged from the previous year. * **Adjusted Performance:** Profitability was impacted by two significant one-off items: an accelerated Expected Credit Loss (ECL) provision of **Rs 1,406 crore** to strengthen balance sheet resilience, and a **Rs 379 crore** charge related to new labour codes. Excluding these, consolidated profit would have reflected a healthy **32%** growth. **Subsidiary Performance** **1. Bajaj Finance (Lending)** * **AUM Growth:** Assets Under Management (AUM) crossed **Rs 4.84 lakh crore**, registering a solid **22%** YoY increase. * **Asset Quality:** Remains stable with Gross NPA at **1.21%** and Net NPA at **0.47%**. * **Profitability:** Reported PAT stood at **Rs 3,978 crore**. The lender added **4.76 million** new customers during the quarter, signaling continued traction in the retail franchise. **2. Insurance Business** * **General Insurance:** Gross Written Premium (GWP) rose **12%** to **Rs 7,389 crore**, supported by a strong combined ratio of **97.9%**, indicating efficient underwriting. * **Life Insurance:** Delivered impressive growth with New Business Premium climbing **27%** to **Rs 3,501 crore**. The Value of New Business (VNB), a key profitability metric, jumped **59%**, driven by a favorable product mix. **Strategic Developments** A key highlight of the quarter was the completion of the acquisition of Allianz SE’s **23%** stake in both insurance subsidiaries. Bajaj Finserv now holds **75.01%** in both Bajaj Allianz General Insurance and Bajaj Allianz Life Insurance, cementing its control and strategic flexibility over these core businesses. **Market Reaction & Technical Analysis** * **Price Action:** The stock traded with a positive bias following the results, hovering around **Rs 2,019–Rs 2,030**, outperforming the broader Nifty50 index marginally. * **Trend:** The stock is currently consolidating within a sideways range. It recently bounced from support levels near **Rs 1,985**, showing buying interest at lower valuations. * **Indicators:** * **RSI (Relative Strength Index):** Hovering near **40–42** (Neutral), suggesting the stock is neither overbought nor oversold. * **Moving Averages:** The price remains slightly below its **50-day** and **200-day** moving averages, indicating a broader cautious trend, though immediate short-term momentum is stabilizing. **Summary** Bajaj Finserv’s Q3 FY26 performance underscores the underlying strength of its diversified financial services model. While reported profit was flat due to prudent provisioning and regulatory costs, the **24%** revenue growth and strong subsidiary metrics (AUM and Premium growth) point to steady operational health. The successful stake consolidation in the insurance ventures further strengthens the long-term structural story.
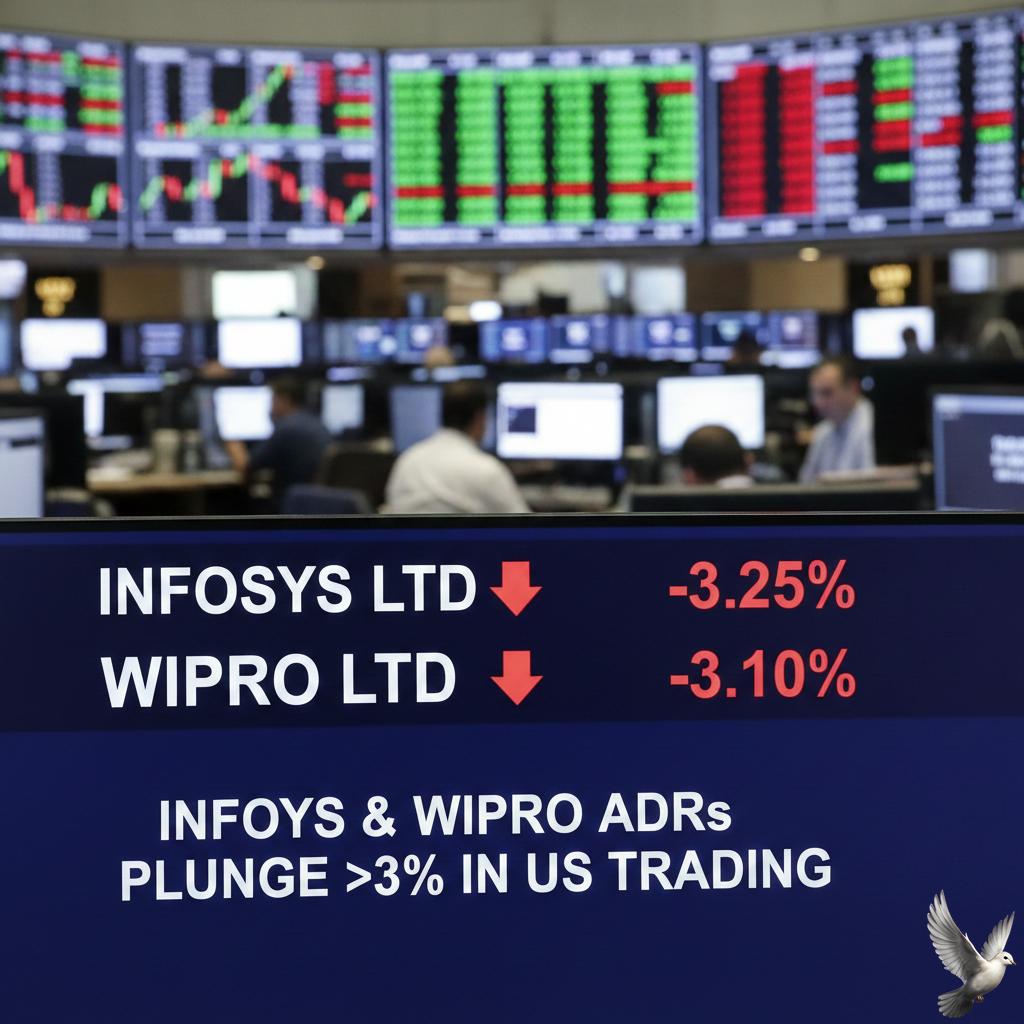
Infosys and Wipro ADRs Decline Over 3% in US Trading
Indian IT stocks witnessed a massive sell-off on February 4, 2026, marking the sector's worst single-day performance since the pandemic onset in March 2020. The Nifty IT index plummeted approximately 6% to 7%, wiping out nearly ₹2 lakh crore in investor wealth in a single session. The downturn was triggered by a global tech rout following the launch of Anthropic’s "Claude Cowork" and its specialized legal automation plugins. This "agentic" AI platform can plan, execute, and review complex multi-step tasks such as contract reviews, compliance tracking, and legal briefings. Investor anxiety stems from the potential for AI to move beyond being a productivity assistant to becoming a direct substitute for the human-led services that form the backbone of Indian IT revenue. **Performance Summary** The Nifty IT index hit an intraday low of 35,909, with every major constituent ending in the red. The correction was led by heavyweight firms, reflecting a structural repricing of the sector rather than company-specific issues. Infosys and Tata Consultancy Services (TCS) bore the brunt of the sell-off. Infosys shares tumbled over 8% during the session, while TCS fell approximately 7%. Wipro also faced significant pressure, closing down nearly 4.5%. Mid-cap and specialized software players were not spared. Persistent Systems dropped 7.5%, and LTIMindtree saw a decline of over 8%. The negative sentiment extended to the US markets, where American Depository Receipts (ADRs) of Infosys and Wipro fell by as much as 3.3% in overnight trade. **Market Drivers and Trends** Market analysts point to the democratization of sophisticated automation as a key threat to traditional pricing power. Anthropic’s new tools allow corporate teams to handle high-volume, routine tasks—previously outsourced to Indian service providers—internally and at a fraction of the cost. The disruption is particularly acute for Business Process Outsourcing (BPO) and data analytics segments. These divisions rely on repetitive, rules-based workflows that are now easily replicable by AI agents. While the $283 billion Indian IT industry has survived previous technological shifts, the speed of this "agentic AI" adoption has forced a reassessment of headcount growth and margin sustainability. **Looking Ahead** Volatility is expected to persist as markets evaluate how quickly global clients adopt these autonomous tools. Large IT firms with strong balance sheets are attempting to pivot by integrating AI into their own service delivery, but the immediate pressure on valuations remains high. The sector currently faces a challenging environment where clients are increasingly focused on cost-cutting through automation rather than traditional labor-intensive transformation projects.