Bullish News
Collection
Fractal Analytics IPO vs. IT Giants: Market Outlook and Comparative Valuation Analysis
Fractal Analytics IPO: Pure-Play AI Entry Amid IT Volatility The Indian primary market marks a milestone today, **February 9, 2026**, as **Fractal Analytics** opens its **₹2,833.90 crore** Initial Public Offering. This debut represents India's first major "pure-play" artificial intelligence listing, arriving at a critical juncture for the domestic technology sector. While traditional IT giants grapple with a structural sell-off, Fractal is positioning itself as an alternative to legacy services. The offering is structured as a fresh issue of **₹1,023.50 crore** and an offer for sale (OFS) of **₹1,810.40 crore**. IPO Snapshot and Pricing The company has established a price band of **₹857 to ₹900** per share. At the upper limit, Fractal’s market valuation is estimated at **₹15,474 crore**. * **Subscription Period:** February 9 – February 11, 2026 * **Allotment Date:** February 12, 2026 * **Tentative Listing:** February 16, 2026 (BSE & NSE) * **Minimum Lot Size:** 16 shares (**₹14,400**) Institutional interest is high, with anchor investors—including **Morgan Stanley** and **Goldman Sachs**—already committing approximately **₹1,248.26 crore**. Financial Turnaround and Growth Fractal’s financials highlight a significant recovery. The company reported a net profit of **₹220.60 crore** in FY25, rebounding sharply from a net loss of **₹54.70 crore** in FY24. Revenue grew by **25.9%** year-on-year to reach **₹2,816.20 crore** in FY25. This growth is driven by its "Must Win Clients"—a group of **122 global enterprises** including Citibank, Nestle, and Costco—who increasingly integrate Fractal’s AI into their core operations. Sector Divergence: AI vs. Legacy IT The timing of the launch coincides with a sharp **4% to 8%** decline in the Nifty IT index over recent sessions. Traditional firms like **TCS**, **Infosys**, and **Wipro** faced pressure following the release of advanced agentic AI tools by global competitors like Anthropic, which investors fear may automate core coding and data processing tasks. In contrast, Fractal’s model focuses on high-end decision intelligence and enterprise AI transformation. This specialization commands a premium valuation; Fractal’s post-issue P/E ratio stands between **70x and 79x**, significantly higher than the **22x to 35x** range seen among traditional IT majors. Market Sentiment and Risks Grey market premiums (GMP) currently indicate a modest upside of approximately **2% to 10%**, reflecting cautious optimism. Investors are balancing the high-growth AI narrative against notable risks: * **Client Concentration:** The top 10 clients generate over **54%** of total revenue. * **Geographic Exposure:** Roughly **65%** of revenue originates from the United States. * **Talent Costs:** Employee benefits consumed **₹1,125 crore** of the **₹1,594 crore** earned in the first half of FY26. Proceeds from the fresh issue are earmarked for debt repayment at Fractal USA, R&D for its **Fractal Alpha** product suite, and new office infrastructure in India.
Kotak Mahindra Bank and Four Other Nifty Stocks Exhibit Bullish RSI Upswing
Market Overview February 2026 The global economic landscape remains resilient despite a series of geopolitical and policy-driven shifts. Market participants are currently navigating a transition period marked by new leadership at the **Federal Reserve**, fluctuating commodity prices, and a pivot toward "real economy" positions. While volatility has surfaced in specific sectors, broader indices show sustained momentum as the first quarter progresses. Global Indices and Equity Trends Major benchmarks opened the year with a positive bias, though recent sessions have introduced caution. The **S&P 500** advanced **1.37%** in January, briefly crossing the **7,000** level for the first time. The **Nasdaq Composite** rose **0.95%**, while the **Dow Jones Industrial Average** led with a **1.73%** gain. In Asian markets, performance remains mixed. The **Nifty 50** is currently maintaining support near the **25,500** zone, with analysts looking for a breach above **26,000** to confirm a renewed uptrend. **Japan’s Nikkei** continues to show strength, rising **5.80%**, while **Korea’s KOSPI** has extended its 2025 rally with a sharp **23.97%** year-to-date increase. Sector leadership is broadening beyond technology. **Energy** emerged as a clear leader with a **14.18%** surge, followed by **Materials** at **8.64%**. Conversely, **Financials** faced pressure, declining **2.43%**, as markets adjusted to a shifting interest rate outlook. Commodities and Currencies Precious metals have experienced significant price swings following the nomination of a new Federal Reserve Chair. **Gold** prices, which recently peaked near **$5,600**, underwent a healthy correction, currently finding technical support around the **$4,825** level. **Silver** faced higher volatility, plunging nearly **36%** from its recent highs due to a reduction in speculative flows. In energy markets, **Brent crude oil** reached **$71.89** per barrel, its highest point since July. Tensions in the Middle East and supply-side concerns remain the primary drivers for this upward pressure. The **US Dollar Index** saw a **1.2%** drop in January, providing a temporary boost to major currencies like the **AUD**, which topped **0.70**. The **USD/INR** pair is currently hovering around the **90.18** mark as domestic markets absorb the latest budget and policy announcements. Macroeconomic Indicators The **US economy** continues to defy recessionary fears, growing at a revised **4.4%** annualized pace. Inflation expectations for **FY26** remain anchored near **2.1%**, though core inflation in various regions suggests supply-side pressures are still being resolved. In India, the **Union Budget 2026** has emphasized capital expenditure, with effective capex pegged at **₹15.48 lakh crore**. Real GDP growth for the current fiscal year is projected between **6.8% and 7.2%**, supported by a **9.1%** expansion in manufacturing and a **9.2%** surge in the services sector. The **Reserve Bank of India** has maintained a neutral stance, holding the repo rate at **5.25%**. Central banks globally, including the **ECB** and **BoE**, are largely expected to maintain current rates as they balance price stability against fragile household demand. Key Events and Outlook Investors are closely monitoring several high-impact triggers for the remainder of the month: * **January Inflation Data**: Expected releases on February 12 will influence global risk sentiment. * **Corporate Earnings**: Results from megacap tech and automobile leaders will provide clarity on consumer demand. * **Geopolitical Developments**: Trade negotiations and security flashpoints in Eastern Europe and the Middle East continue to act as primary volatility drivers. The overall sentiment remains "cautiously positive." While the "Magnificent 7" tech stocks have seen bullish momentum wane, the rotation into industrials and small-cap stocks suggests a healthier, more diversified market structure.
Indian IT Stocks Lose Rs 2.5 Lakh Crore in Three-Day Sell-Off
**Indian IT Sector: Market Update & AI Disruption Brief** The Indian IT sector is navigating a volatile period as a massive selloff recently wiped out approximately **₹2 lakh crore ($22.5 billion)** in market value over a single week. The Nifty IT index plunged nearly **7%** in its sharpest one-day decline since the pandemic, significantly underperforming the broader market. **Market Performance & Price Trends** Leading tech giants have seen dramatic price corrections. Infosys and LTI Mindtree both recorded intraday drops of over **8%**, while TCS, the industry heavyweight, slid nearly **7%**. Other major players like HCLTech, Tech Mahindra, and Wipro fell between **4% and 6%**. Currently, the Nifty IT index is trading roughly **18%** below its peak at the start of last year, signaling a deep reassessment of sector valuations. **The Catalyst: Agentic AI** The primary driver of this panic is the rapid emergence of "Agentic AI." New tools from global AI firms now demonstrate the ability to automate complex, end-to-end business workflows in legal, sales, and marketing. This has sparked intense "seat-compression" fears—the concern that AI will reduce the number of engineers required for projects, directly threatening the traditional billable-hours revenue model that Indian firms have relied on for decades. **Revenue & Growth Outlook** Despite the stock market turbulence, there is a divergence between investor sentiment and enterprise reality. AI-centric engagements now form nearly **74%** of all new contracts signed over the last six quarters. For Q3 FY26, major firms reported steady performance: - TCS reported revenue of **₹67,087 crore** with a **17.3%** surge in AI-led services. - HCLTech saw a **6%** revenue growth, with AI revenues reaching **$146 million**. - Industry spending is still projected to surpass **$176 billion** in 2026. **Sector Transition** Analysts suggest the industry is shifting from simple cost arbitrage to "digital mastery." While legacy outsourcing faces a structural threat, demand is pivoting toward cloud sovereignty, cybersecurity, and generative AI platforms. However, high valuations and a shortage of specialized AI talent remain significant headwinds. Investors are currently pricing in the risk that AI will cannibalize more revenue than it creates in the short term, leading to the current "risk-off" environment on Dalal Street.

Anand Rathi Shares Under Pressure Following Rs 13 Crore Fraud Allegation by Pune-Based Client
Anand Rathi Share and Stock Brokers Limited is currently navigating a significant regulatory challenge following the discovery of a Rs 13 crore fraud. On February 6, 2026, the company’s internal inquiry committee identified an unauthorized off-market transfer of shares from the demat account of a Pune-based client. The investigation indicates that the crime involved unknown individuals acting in collusion with employees of a group entity, Anand Rathi IT Private Limited. The firm has clarified that the breach occurred within depository activities and did not impact its core broking operations. **Key Financial Impact** The estimated financial hit to the listed entity is pegged at approximately Rs 13 crore. Following the disclosure, the company’s stock saw immediate pressure, settling roughly 1% lower at Rs 572.45 on the NSE. Despite this setback, the broader group, Anand Rathi Wealth, remains financially robust. For the December 2025 quarter, the company reported a 33% sequential rise in net profit to Rs 370 crore, supported by a 9% growth in revenue to Rs 248 crore. Assets under management (AUM) also witnessed a 30% year-on-year jump, reaching Rs 99,008 crore. **Regulatory and Legal Landscape** The incident coincides with a major regulatory shift. As of January 2026, SEBI has implemented the New Stock Brokers Regulations, which replace the decades-old 1992 framework. These new rules mandate: - Proactive technology-driven frameworks for fraud prevention - Compulsory whistleblower policies and 48-hour reporting for suspicious activities - Strict liability for senior management regarding internal surveillance Anand Rathi is currently in the process of filing a First Information Report (FIR) and has identified corrective measures to strengthen internal controls. **Market Context and Trends** The Indian brokerage sector is currently operating in a high-growth but volatile environment. As of February 2026, the Nifty 50 has been consolidating near the 25,700 level, while the broader market reacts to fresh India-US trade agreements and a rock-bottom inflation rate of near 1%. Market volatility, measured by the India VIX, has cooled significantly to around 11.94, signaling a shift toward stock-specific action. However, the Anand Rathi case highlights the increasing "mule account" risks and "off-market" vulnerabilities that the new SEBI guidelines aim to eliminate through mandatory electronic record retention for eight years. The company continues its focus on de-risking earnings by expanding non-broking segments, which now contribute significantly to its stable 40.8% EBITDA margins. Further updates on the recovery of the Rs 13 crore are expected as law enforcement investigations proceed.

ITC and Four Other Stocks Signal Potential Market Uptrend
The Indian equity markets entered the second week of February 2026 with a decisive shift in momentum. Following a period of high-voltage volatility triggered by the Union Budget, the Nifty 200 index and broader benchmarks are signaling a renewed bullish phase. Technical scanners identified five key stocks within the Nifty 200 pack that formed a White Marubozu candlestick pattern on February 6, 2026. A White Marubozu is a powerful technical indicator characterized by a long body with little to no shadows. It occurs when a stock opens at its daily low and closes at its daily high, signaling that buyers remained in absolute control throughout the session. This pattern is often a precursor to a sustained uptrend or a definitive reversal from previous lows. Market performance on February 9, 2026, reflects this optimism. The Nifty 50 traded near 25,693, while the Nifty 200 maintained stability around the 14,316 level. Investor sentiment has been significantly bolstered by a new trade agreement with the US, which saw reciprocal tariffs on Indian goods slashed from 25% to 18%, and in some categories, to zero. This global development has particularly energized the export and gems and jewellery sectors. Sectoral data shows a clear divide in performance. While the IT index faced pressure, declining nearly 6.9% over the past week due to shifting growth outlooks, other sectors like FMCG and Finance showed resilience. ITC emerged as a standout performer, gaining over 5% to reach 325.80, while Kotak Mahindra Bank rose 3.3% to 422.35. Key market indicators as of today: - Nifty 200: 14,316.00 (+0.15%) - Sensex: 83,580.40 (+0.32%) - Nifty 50: 25,693.70 (+0.20%) - USD/INR: 90.42 The technical setup for the Nifty 200 remains structurally sound, with the index trading above 7 out of its 8 major Simple Moving Averages (SMAs). The 5-day SMA is currently pegged at 14,247, providing immediate short-term support. While the Relative Strength Index (RSI) at 53.1 suggests a neutral to slightly positive zone, the appearance of bullish candlestick patterns like the White Marubozu in specific large-cap and mid-cap names suggests that the market is preparing to challenge its 52-week high of 14,700. Traders are closely watching the 25,500 level on the Nifty 50 as a critical support zone for the upcoming weekly expiry. On the upside, 26,000 remains a formidable resistance. The combination of favorable trade policies and strong technical breakouts in Nifty 200 constituents suggests that the broader market is currently favoring a "buy on dips" strategy as it navigates post-Budget consolidation.
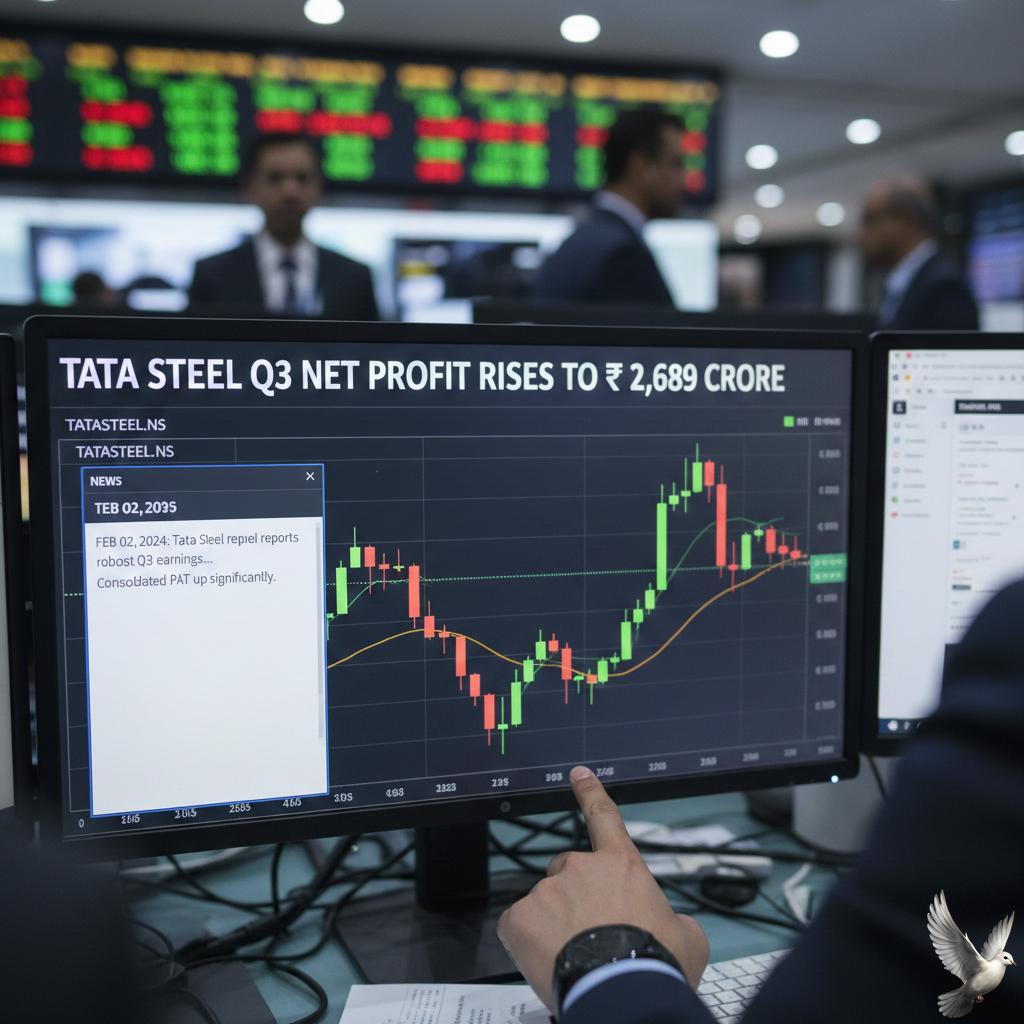
Tata Steel Q3 Net Profit Rises to Rs 2,689 Crore
Tata Steel has delivered a remarkable turnaround for the third quarter of the 2026 fiscal year, reporting a consolidated net profit of 2,730 crore INR. This represents a massive 825% surge compared to the previous year, highlighting a powerful recovery despite a complex global pricing environment. Total revenue for the quarter reached 57,002 crore INR, supported by a 6% year-on-year increase. The company’s Indian operations remain the primary engine of growth, contributing 35,725 crore INR to the top line and maintaining a robust 23% EBITDA margin. Production and delivery milestones have reached historic levels. For the first time, Tata Steel’s India deliveries crossed the 6 million ton mark in a single quarter, growing 14% year-on-year. Crude steel production in India also hit a record 6.34 million tons, reflecting a 12% rise as capacity utilization improved at key plants in Kalinganagar and Jamshedpur. Specific segments within the domestic market are showing exceptional momentum. The automotive and special products vertical achieved its best-ever quarterly volume of 0.9 million tons, a 20% jump from last year. Additionally, the branded products and retail segment surpassed 2 million tons for the first time, driven by strong consumer demand for brands like Tata Tiscon. The financial health of the group has improved with a focused effort on deleveraging. Net debt was reduced by 5,206 crore INR during the quarter, bringing the total down to 81,834 crore INR. Strategic cost transformation programs contributed approximately 3,000 crore INR in savings this quarter, helping to offset lower global steel realizations. Expansion remains a core priority. The board has reaffirmed a long-term strategy to reach a capacity of 40 million tons per annum in India by 2030. Key projects include a 4.8 million ton expansion at Neelachal Ispat Nigam Limited and the development of a 0.75 million ton electric arc furnace in Ludhiana. Recent strategic moves include consolidating a majority stake in the color-coated business and completing the acquisition of a 50.01% stake in Thriveni Pellets. These steps, combined with the government's recent imposition of a three-year import tariff on select products, provide a protective buffer against international oversupply and position the company to capitalize on India's projected 9% growth in steel demand for 2026. Market sentiment remains positive as the stock recently traded near 197 INR, reflecting confidence in the company’s ability to navigate global headwinds through domestic scale and operational efficiency.

IREDA Board Approves ₹2,994 Crore Fundraising via QIP
IREDA remains a focal point for investors following the board's approval of a Rs 2,994 crore fund-raising plan through a Qualified Institutions Placement (QIP) on February 6, 2026. This strategic move is designed to strengthen the company’s capital base while strictly limiting the dilution of the Government of India’s shareholding to no more than 3.76% of the post-issue paid-up equity. The fundraising comes on the heels of impressive financial growth. For the quarter ending December 2025, the Navratna NBFC reported a consolidated net profit of Rs 1,381.36 crore, reflecting a 15.4% year-on-year increase. Revenue from operations surged by 28.2% to reach Rs 6,041.82 crore, supported by a significant expansion in lending activities. Operational data highlights a robust surge in financing for green projects. During the first nine months of the fiscal year, loan sanctions climbed 29% to Rs 40,100 crore, while disbursements jumped 44% to Rs 24,903 crore. The company's total loan book has now expanded to approximately Rs 85,989 crore, reinforcing its position as India’s largest pure-play green financing institution. Despite these strong fundamentals, the stock has faced technical headwinds. Shares recently closed near Rs 128.24, trading below several key short-term moving averages. Analysts have identified immediate technical support levels at Rs 125.58 and Rs 126.92, while resistance is anticipated around the Rs 134.26 and Rs 136.59 marks. The broader market sentiment remains cautious due to a recent restatement of the Capital to Risk-Weighted Assets Ratio (CRAR) to 15.52% following regulatory risk-weight changes. The long-term outlook for the sector remains positive as India targets 250 GW of renewable capacity by the end of FY26. IREDA’s role is further bolstered by the establishment of its subsidiary in GIFT City, which is expected to lower hedging costs and facilitate foreign currency lending. Investors are now monitoring the upcoming postal ballot for shareholder approval of the QIP tranches.
SBI Shares Rise as Nuvama Hikes Target Price Following Q3FY26 Results
State Bank of India (SBI) has solidified its position as a market leader after reporting its highest-ever quarterly performance for the period ending December 2025. The lender posted a standalone net profit of 21,028 crore, reflecting a robust 24% year-on-year increase. This growth was fueled by a 9% rise in Net Interest Income, which reached 45,190 crore, alongside a significant 40% jump in operating profit. The bank's total business volume has successfully crossed the 103 trillion milestone. Credit expansion remains a core strength, with total advances growing 15% to surpass 46 trillion. This growth is well-distributed across sectors, led by a 21% surge in SME loans and a 16% rise in agricultural lending. On the liabilities side, deposits grew by 9%, crossing the 57 trillion mark. Asset quality has reached a two-decade high in terms of stability. The Gross Non-Performing Asset ratio improved significantly to 1.57%, down 50 basis points from the previous year. Net NPAs followed a similar trajectory, dropping to a lean 0.39%. Additionally, the bank maintains a strong capital cushion with a Capital Adequacy Ratio of 14.04% and a Provision Coverage Ratio of 92.37% when including written-off accounts. Brokerage firm Nuvama Research has responded to these results by upgrading its outlook on the stock. Analysts have raised the target price to 1,250, citing high visibility for sustained credit growth and stable operating margins. The bank has also revised its full-year credit growth guidance upward to a range of 13%–15%, signaling confidence in domestic demand. Macroeconomic conditions further support this banking momentum. The Reserve Bank of India recently maintained the repo rate at 5.25% with a neutral stance, ensuring a stable interest rate environment for borrowers. While Domestic Net Interest Margins saw a marginal compression to 3.12%, SBI’s focus on digital efficiency remains a key differentiator. Currently, over 68% of new savings accounts are opened through the YONO platform, and nearly 99% of all transactions are now processed through alternate digital channels. In the equity markets, SBI shares are trading near their 52-week highs, supported by a price-to-earnings ratio of approximately 11.8, which many analysts view as attractive compared to private-sector peers. With a Return on Equity (ROE) standing at 20.68%, the lender continues to demonstrate superior capital efficiency while leading the sector's recovery.

Aye Finance IPO: Subscription Opens Today; Key Details and Market Sentiment Inside
Aye Finance, a specialized non-banking financial company (NBFC) focusing on micro-enterprises, has launched its primary market debut today, February 9, 2026. The initial public offering (IPO) aims to raise a total of 1,010 crore. The offer is structured as a book-building issue, consisting of a fresh equity issuance worth 710 crore and an offer for sale (OFS) of 300 crore from existing shareholders. The price band for the equity shares, which have a face value of 2 each, is set between 122 and 129. Investors have a three-day window to subscribe, with the bidding process concluding on Wednesday, February 11, 2026. For retail participants, the minimum application size is one lot of 116 shares, requiring an investment of 14,964 at the upper price limit. The company occupies a unique niche in the Indian lending landscape, catering to the "thin-file" segment of micro-scale MSMEs. These are businesses often overlooked by traditional banks, typically engaged in manufacturing, trading, and services with annual turnovers between 20 lakh and 1 crore. As of late 2025, Aye Finance managed assets totaling 6,027 crore and serviced a customer base of approximately 5.86 lakh active unique clients. The company operates through a geographically diverse network of 568 branches across 18 states and three union territories. Financially, the lender has shown significant scaling, with total income rising to 1,504.99 crore for the fiscal year ending March 2025. This represents a robust 40% year-on-year growth. Profit after tax for the same period stood at 175.25 crore. Market indicators show a cautious but optimistic sentiment. The grey market premium (GMP) currently hovers around 5, suggesting a modest listing gain of approximately 3.8%. Valuation-wise, the company is priced at roughly 14 times its FY25 earnings, which analysts view as competitive compared to listed peers. Potential investors are monitoring specific risk factors, including a rise in Gross Non-Performing Assets (NPA) to 4.85% as of September 2025 and a high employee attrition rate of 64%. However, the company’s "phygital" model—combining physical branch presence with 100% paperless digital underwriting—remains a core strength. Following the close of the subscription period, the basis of allotment is expected to be finalized on February 12. Refunds and the credit of shares to demat accounts are scheduled for February 13. Aye Finance shares are tentatively set to list on both the BSE and NSE on Monday, February 16, 2026.

Fractal Analytics IPO: GMP, Brokerage Reviews, and Subscription Details
Fractal Analytics officially enters the Indian stock market today, February 9, 2026, marking a landmark moment as the country’s first pure-play artificial intelligence company to list. The IPO is open for subscription until February 11, with the company aiming to raise 2,834 crore through a combination of a 1,023.5 crore fresh issue and an 1,810.4 crore offer for sale. Investors can participate within a price band of 857 to 900 per share. The minimum application size is set at one lot of 16 shares, requiring an investment of 14,400 at the upper price limit. Shares are expected to be listed on both the BSE and NSE on February 16, 2026. The company has demonstrated a massive financial turnaround, reporting a net profit of 220.6 crore in FY25, a significant recovery from the 54.7 crore loss recorded in FY24. This growth is supported by a 26% year-on-year surge in revenue, reaching 2,765 crore. Adjusted PAT margins currently stand at a healthy 12.6%. The IPO proceeds are earmarked for strategic expansion, including 355 crore for research, development, and marketing under its Fractal Alpha division. Additionally, 265 crore will be utilized to settle debt for its US subsidiary, while other funds will support new infrastructure and inorganic growth opportunities. Market sentiment remains cautious but optimistic. While the IPO is valued at roughly 70 times its price-to-earnings ratio—reflecting a "scarcity premium" for a specialized AI firm—grey market activity suggests an initial premium of approximately 10%. Global demand for Enterprise Data, Analytics, and AI (DAAI) services is driving interest, with the sector projected to grow at a 16.7% CAGR to reach 23 lakh crore by 2030. Fractal’s deep integration with over 120 Fortune 500 clients, including Google and Microsoft, provides a stable revenue foundation despite high geographic concentration in the US market. Analysts view the offering as a high-risk, high-reward opportunity. The company’s long-term success will depend on navigating rapid technological shifts and maintaining its 114% net revenue retention rate. For those with a 3–5 year outlook, this listing represents a primary vehicle for exposure to the maturing generative AI cycle in India.

India-US Textile Tariff Agreement Impact on KPR Mill and Related Stocks
The Indian textile sector is witnessing a historic recovery following the formalization of the India-US interim trade deal on February 2, 2026. This landmark agreement has slashed US reciprocal tariffs on Indian textile and apparel exports from a prohibitive 50% down to 18%. The move effectively removes a 25% penalty previously linked to geopolitical trade tensions, instantly restoring the global competitiveness of Indian manufacturers. The US remains India’s largest textile destination, accounting for roughly 32% of total exports with an annual value of approximately 10.5 billion dollars. Industry experts project that this new tariff structure will unlock access to a 118 billion dollar US import market. By lowering the entry barrier to 18%, India now holds a strategic pricing advantage over key regional rivals such as China, which faces 30% tariffs, and Vietnam and Bangladesh, both at approximately 20%. Market reaction has been immediate and aggressive. Major textile stocks including Gokaldas Exports, Indo Count Industries, and KPR Mill surged by 15% to 20% in single trading sessions following the announcement. Analysts expect an operating margin expansion of 200 to 400 basis points over the next four to six quarters as exporters move away from the "discounted pricing" strategies they used to absorb previous tariff costs. Supply chain hubs like Tiruppur are reporting a swift clearing of backlogged orders valued at nearly 4,000 crore rupees. This momentum is further bolstered by the Union Budget 2026-27, which allocates 6 billion rupees for chemical and mega textile parks. These infrastructure projects aim to scale India’s textile exports toward a 100 billion dollar target by 2030, with the US expected to contribute more than one-fifth of that growth. Investors are shifting focus toward high-exposure export firms as the sector transitions from a period of "tariff-related uncertainty" to one of structural growth. Beyond the US deal, the recent India-EU Free Trade Agreement is also providing tailwinds, positioning the industry to capitalize on a global "China Plus One" sourcing shift. Current projections for the 2026-27 fiscal year suggest a steady 12.4% compound annual growth rate for the broader sector. With tariff parity achieved and domestic capacity expanding through new technical textile corridors, the industry is entering a high-volume cycle characterized by improved cash flows and renewed foreign institutional interest.
12 stocks cross above 200-day moving average
The Indian equity market is demonstrating selective strength as the Nifty 500 universe shows signs of long-term trend reversals. On February 6, 2026, twelve notable stocks successfully closed above their 200-day moving average (DMA), a critical technical milestone that often signals a shift from a bearish or sideways phase into a sustained uptrend. Among the prominent names securing this breakout are Reliance Industries, which closed at 1,450.80, and ICICI Bank at 1,406.10. Other major players joining the bullish trend include Kotak Mahindra Bank (422.35), Bajaj Finserv (2,024.20), and Life Insurance Corporation of India (901.85). Consumer staples and real estate also saw representation through Dabur India (508.30) and Sobha (1,514.50), alongside niche performers like Data Patterns and Campus Activewear. The broader market context remains cautiously optimistic following the Reserve Bank of India’s February policy update. The Monetary Policy Committee maintained the repo rate at 5.25% and kept a neutral stance, reflecting a balanced approach toward India’s 7.4% projected GDP growth for the fiscal year. While the Nifty 50 has been consolidating near the 25,693 level, the cooling of the India VIX to 11.94 indicates a significant reduction in market fear, paving the way for the current stock-specific action. Traders are closely watching these technical breakouts as the Nifty 500 continues to rotate capital into sectors showing relative strength. A price hold above the 200 DMA is traditionally viewed as a green flag for institutional buyers, suggesting that the underlying momentum for these twelve stocks is backed by long-term accumulation rather than short-term speculation. The market now faces a psychological hurdle at the 26,000 mark for the Nifty 50. However, the emergence of these "Golden Cross" candidates within the mid-cap and large-cap segments suggests that internal market breadth is improving. Investors are currently prioritizing quality breakouts over broad index plays, focusing on names that have reclaimed their long-term averages despite global volatility and recent corrections in the technology sector.

Rupee Tracks Foreign Capital Inflows While Bond Markets Monitor Supply Pressures
Indian markets are navigating a high-stakes environment this week as pivotal economic shifts and trade breakthroughs redefine the outlook for the rupee and domestic bonds. Foreign Portfolio Investors (FPIs) have staged a notable return, injecting over 8,100 crore into Indian equities during the first week of February. This follows a massive 1.66 lakh crore outflow in 2025 and a further 35,962 crore withdrawal in January. The sudden reversal is largely credited to the historic India-U.S. trade deal, which reduced tariffs on Indian exports from 25% to 18%. The Indian Rupee has responded with its strongest performance in years, rallying from lows near 92.10 to settle around 90.70 against the U.S. dollar. Analysts anticipate the currency could test the 89.50 level by March, though the Reserve Bank of India (RBI) remains active in the market to prevent excessive appreciation and maintain export competitiveness. Inflation remains a central focus as the government prepares to release January retail data on February 12. This release will mark the debut of a new CPI series rebased to 2024, designed to better reflect modern consumption patterns by reducing the weight of food from 46% to approximately 37-39%. Headline inflation for 2025-26 is projected to hover near 2.1%, giving the RBI room for potential policy maneuvers. In the bond market, the 10-year benchmark yield recently settled near 6.74%. Investors are currently managing a delicate balance between high supply and tight liquidity. The Union Budget has outlined a gross borrowing target of 17.2 trillion for the upcoming fiscal year, a 17% increase that has kept yields elevated despite the RBI holding the repo rate steady at 5.25%. Traders are now shifting their attention to industrial production figures and upcoming quarterly earnings to gauge the sustainability of the current rally. While the trade deal has provided a massive sentiment boost, high equity valuations and global interest rate trajectories remain the primary risks for the weeks ahead. [India Market Update](https://www.youtube.com/watch?v=z01RGOV-ZNw) This video provides an expert breakdown of the February 2026 debt market outlook, covering the impact of new borrowing targets on bond yields. http://googleusercontent.com/youtube_content/0
Japanese Markets React to Takaichi Election Victory as Stocks Reach Record and Yen Weakens
Japanese financial markets have entered a new era of volatility and growth following Prime Minister Sanae Takaichi’s landslide victory in the February 8, 2026, snap election. Her Liberal Democratic Party secured a commanding 316-seat supermajority in the 465-seat lower house, granting her an undisputed mandate to implement aggressive fiscal expansion. The Nikkei 225 index responded with an unprecedented surge, climbing 5.7% to a record high of 57,337.07. The broader Topix index followed suit, advancing 3.4% to reach a historic 3,825.67. This "Takaichi trade" is being driven by investor confidence in her pro-growth agenda, which prioritizes heavy spending in strategic sectors like AI, defense, and shipbuilding. The administration’s fiscal plan includes a massive stimulus package exceeding 13.9 trillion yen. Key measures on the immediate horizon include a proposed two-year suspension of the consumption tax on food, aimed at providing relief from persistent inflation. Additionally, corporate tax incentives for production facility investments are expected to boost industrial output. While equities have soared, the bond market is signaling caution. Yields on 10-year Japanese Government Bonds (JGBs) climbed to 2.275%, marking a five-year high. Even more striking was the movement in long-dated debt, where 30-year yields reached 3.615%. This rise in yields reflects market concerns over the potential for increased deficit-covering bond issuance to fund the government’s ambitious spending goals. The Japanese yen has faced significant downward pressure, sliding to a fresh two-week low of 157.95 against the U.S. dollar. Most notably, the yen hit an all-time low of 203.30 against the Swiss franc. The currency is also trading near record lows against the euro, currently around 186.55. These movements have prompted Japanese authorities to issue warnings of potential market intervention to stabilize the exchange rate. Traders are now closely watching the Bank of Japan, with market swaps pricing in a 74% probability of a rate hike by late April. The central goal of the Takaichi administration remains a delicate balance: stimulating domestic growth through tax relief and public investment while managing the inflationary risks and currency depreciation that come with such a large-scale fiscal pivot.

Precious Metals Prices Rise Amid U.S. Dollar Weakness
The global financial landscape is shifting as a softening U.S. dollar breathes new life into the precious metals sector. Early February 2026 trading shows gold and silver reclaiming ground after a period of intense volatility. International gold prices are currently navigating a broad range between $2,100 and $2,300 per ounce, while silver holds a steady recovery near $28 to $30 per ounce. In regional markets, the impact of currency fluctuations is even more pronounced. In India, retail 24-karat gold has stabilized at approximately 156,600 INR per 10 grams. Silver has shown a resilient rebound to 285,000 INR per kilogram. These levels follow a significant corrective phase, where metals faced pressure from a briefly resurgent dollar following the nomination of a more hawkish future Federal Reserve leadership. The U.S. Dollar Index (DXY) is currently testing the 97.50 to 98.00 range. While the dollar saw a temporary boost from geopolitical tensions and leadership changes at the Fed, it is now showing signs of stalling. Recent labor data previews have indicated unexpected weakness, fueling expectations that the currency may continue its gradual downward trend through the remainder of the first quarter. Investor focus has shifted entirely to the upcoming U.S. Non-Farm Payrolls report. This labor market data is critical for determining the Federal Reserve’s interest rate trajectory for 2026. Current market sentiment suggests a "low-hire, low-fire" environment, which may force the Fed to maintain steady rates at 5.25% unless a significant deterioration in employment becomes evident. Asian equity markets have mirrored this cautious optimism. While technology stocks have faced pressure from high valuations and rising capital expenditure forecasts, mining and energy sectors have rallied. Japan’s Nikkei 225 recently saw a surge of nearly 3%, while markets in South Korea and Australia have posted strong gains, buoyed by de-escalating international tensions and new trade agreements. The broader outlook for the month suggests continued two-way volatility. Precious metals are increasingly viewed as a necessary hedge against high global debt and inflationary pressures. Silver, in particular, is gaining traction due to a structural supply deficit and rising industrial demand from the clean energy sector, which now accounts for over 15% of its global consumption. As the week progresses, the interplay between a weakening dollar and the resilience of the U.S. labor market will remain the primary driver for global asset classes. Markets are currently pricing in a high probability of a rate hold in the near term, keeping the window open for further gains in the bullion market if the dollar’s retreat continues.

Indian Stock Market Gains as GIFT Nifty and Asian Indices Rise
Market Overview The global financial landscape entered February 2026 defined by a sharp "K-shaped" divergence. While blue-chip indices have reached historic milestones, the broader market faces persistent pressure from tech valuation resets and shifting geopolitical sands. Volatility has spiked recently, with the VIX rising above **18** as investors grapple with the sustainability of massive infrastructure spending. Despite these headwinds, the global economy is projected to grow by **3.3%** this year, supported by a resilient U.S. consumer and steady fiscal stimulus in major jurisdictions. Equities and Benchmarks The Dow Jones Industrial Average made history on February 6, closing above the **50,000** threshold for the first time. This rally, fueled by a **1,200-point** surge in a single session, was driven by traditional industrials and specific hardware leaders like Nvidia, which jumped nearly **8%**. In contrast, the tech-heavy Nasdaq has struggled, extending its losing streak to four weeks. The index is down approximately **2%** for the year as of early February. This "AI hangover" stems from massive capital expenditure plans; major hyperscalers like Amazon have forecasted 2026 spending at **$200 billion**, a **50%** year-over-year increase that has rattled some shareholders. Commodities and Energy Commodities are witnessing extreme price swings. Gold remains a preferred safe-haven, trading near **$4,980** per ounce. Analysts anticipate a potential climb toward **$6,200** by mid-year if geopolitical tensions in the Middle East persist and central bank demand remains robust. Silver has been significantly more volatile, hitting a low of **$64** per ounce before recovering toward **$76**. This follows a period where the metal nearly halved from its previous record highs within a single week. The energy sector is seeing stabilization, with Brent crude forecasted to hover between **$65** and **$67** per barrel through the first half of 2026. This outlook is supported by a growing global oil surplus despite temporary supply disruptions in Central Asia and the U.S. Digital Assets The cryptocurrency market has entered a period of "extreme fear," with the sentiment index dropping as low as **14**. Total market capitalization has shrunk to **$2.4 trillion**, down from **$3 trillion** at the start of the year. Bitcoin has retreated roughly **45%** from its November peak of **$126,000**, recently sliding below the **$70,000** mark. Ethereum has faced even steeper declines, falling below key support at **$2,300**. This sector-wide correction is linked to a rotation into traditional havens and hawkish signals regarding U.S. monetary policy. Economic Indicators Inflation remains a central theme, hovering near **3%** globally. While the Federal Reserve implemented cumulative cuts of **75 basis points** in 2025, the target range is expected to hold steady at **3.5%** to **3.75%** throughout 2026 to combat sticky price pressures. China continues to play a dominant role in global trade, recording a surplus of **$1.2 trillion**. However, domestic demand in the region remains weak, with growth projected to decelerate toward **5.0%**. In the Eurozone, growth is expected to strengthen slightly to **1.6%**, underpinned by increased military spending and labor market resilience.
Yen Weakens Following Takaichi Victory and Prospect of Increased Stimulus
In a historic political shift, the Japanese Yen has faced renewed downward pressure against the US Dollar following a landslide victory for Prime Minister Sanae Takaichi’s Liberal Democratic Party (LDP). The LDP, alongside its coalition partner, has secured a decisive two-thirds supermajority in the lower house, capturing approximately 300 of the 465 available seats. This victory grants the administration an unprecedented mandate to execute its "responsible and proactive" fiscal agenda without the need for significant legislative compromise. The currency market responded immediately to the news. The Japanese Yen fell by 0.3% in early Asian trading on February 9, reaching 157.72 against the dollar. This marks the seventh consecutive day of decline for the currency, which is currently hovering near its weakest levels in two weeks. While the yen softened, the Japanese equity market surged on expectations of continued fiscal support. The Nikkei 225 stock average made history by breaking the 55,000 mark for the first time, eventually climbing past 57,000 in early trading. This represents a rally of over 5% in a single session, as investors bet on the administration's commitment to aggressive stimulus and semiconductor infrastructure investment. The Takaichi administration has already signaled its fiscal intentions through a record 122.3 trillion yen budget proposal for the 2026 fiscal year. This plan includes a massive 10 trillion yen framework for AI and semiconductor support, aimed at sparking 50 trillion yen in private-sector investment. Despite the heavy spending, the government projects a basic fiscal surplus of 1.34 trillion yen for the coming fiscal year—the first such surplus since 1998. This projection relies on a record tax haul of 83.7 trillion yen, driven by high corporate earnings and persistent inflation. The Bank of Japan remains a focal point for market stability. While fiscal policy is expansionary, central bank officials have indicated that normalization of interest rates will continue. Traders currently see a 74% probability of a rate hike by April 2026, with the benchmark rate expected to reach 1.00% later this year. Long-term borrowing costs are already reacting to this shift. The 10-year Japanese Government Bond (JGB) yield has exceeded 2%, reflecting market concerns over the sheer volume of outstanding debt, which is estimated to reach 1.15 quadrillion yen by the end of fiscal 2026. Global observers are closely watching the yen's trajectory. There is growing speculation that Japanese authorities may coordinate with international partners to stabilize the currency if the current slide persists. However, with a supermajority now in hand, the Takaichi government holds a clear path to prioritize domestic economic growth and infrastructure resilience over short-term currency strength.

Asian Stocks and Nikkei Rise Following Takaichi Victory
Asian markets are displaying a decisive upward trend this morning, following a strong recovery on Wall Street. Investors have begun rotating capital away from the high-growth technology sector, which has dominated for years, and into "old economy" cyclical stocks. This shift is driven by a critical reassessment of artificial intelligence valuations as the market moves from speculative excitement toward practical corporate adoption. In Japan, the Nikkei 225 remains in technical bull market territory, having crossed a 20% gain threshold in recent weeks. Despite some near-term stalling around the 38,940 level, the index continues to anchor regional sentiment. Similarly, the Hang Seng in Hong Kong has outperformed expectations, entering a bull market with a rally of 27.8% since its April lows, recently clearing a key resistance level at 23,770. The broader market rotation is particularly evident in the United States, where the Russell 1000 Value Index recently outperformed its growth counterpart by a significant 400 basis points. While the tech-heavy Nasdaq shed 1.84% during a recent volatile stretch, the Dow Jones Industrial Average has consistently hit new records. Sectors such as energy, real-asset businesses, and regional banks are now taking the lead. The focus on artificial intelligence has shifted toward companies that apply the technology to boost productivity rather than just infrastructure providers. While leaders like Nvidia have seen sharp corrections, the "old economy" sectors—including oil and gas, chemicals, and transportation—are benefiting from more attractive valuations and accelerating earnings. Economic indicators are also playing a major role in shaping this new dynamic. U.S. manufacturing activity recently expanded at its highest level since 2022, with the ISM PMI jumping to 52.6. This signals a potential rebound in factory demand that supports cyclical stocks. Conversely, a softening labor market and declining job openings are fueling expectations for continued interest rate adjustments by central banks. Looking ahead, the week is defined by a "great rebalancing." Markets are navigating a complex mix of geopolitical tensions and evolving trade policies, with a particular focus on how new tariffs might impact global supply chains. Despite these headwinds, the transition toward a broader range of market leaders is viewed by many as a healthy normalization of the global bull run.

Elevate Campuses Receives SEBI Approval for Rs 2,550 Crore IPO
Elevate Campuses, an integrated education infrastructure platform backed by Hillhouse Investments, has received formal approval from SEBI to proceed with its ₹2,550 crore initial public offering. This milestone, reached in early February 2026, clears the path for the company to tap into the primary market during a period of significant institutional interest in alternative real estate assets. The public issue is structured entirely as a fresh issue of equity shares. Unlike many recent market debuts, there is no offer-for-sale component from existing investors, indicating a strong commitment from Hillhouse to remain invested in the platform’s long-term growth. The company plans to list its shares on both the BSE and NSE. Capital allocation from the proceeds is highly specific. Elevate Campuses intends to deploy approximately ₹1,100 crore toward the acquisition of K-12 educational entities and campuses throughout the 2026 fiscal year. An additional ₹750 crore is earmarked for the repayment or prepayment of outstanding debt, with the remaining capital reserved for further inorganic growth and strategic corporate purposes. The company's financial performance shows steady upward momentum. For the fiscal year ending March 2025, revenue from operations reached ₹369.81 crore, reflecting a 6.6% increase. Profitability surged more aggressively, with net profit rising 32.7% to ₹52.65 crore. Operational efficiency is further highlighted by an EBITDA of ₹259.32 crore for the same period. As of August 2025, the platform manages a substantial portfolio across 21 cities in India and the UAE. Its capacity includes 94,758 student beds across 21 cities, making it a leading player in the organized student housing market. The business operates through high-profile brands such as Good Host Spaces and ScholarZ, catering to both Higher Education Institutions and the K-12 segment. The student housing sector in India is currently valued at approximately ₹1,072 billion as of 2026 and is projected to maintain a compound annual growth rate of over 7%. This expansion is fueled by a severe supply-demand gap, as existing on-campus hostels can only accommodate 20% of the total student population. Managed providers like Elevate are filling this void with professionally operated, amenity-rich facilities. The IPO comes at a strategic time as private unaided schools now account for 36.3% of total K-12 enrollments in India, representing roughly 90 million students. By integrating student housing with K-12 asset ownership, Elevate Campuses is positioning itself as a diversified infrastructure provider in a sector historically dominated by unorganized local players.

Domestic Institutional Investor Ownership in Indian Equities Reaches Record High
Domestic institutional investors (DIIs) have officially established themselves as the bedrock of the Indian equity market. For the first time in history, domestic ownership has surged to 18.72%, successfully overtaking foreign portfolio investors (FPIs). Foreign ownership has simultaneously retreated to 16.6%, marking a 14-year low. This reversal underscores a structural shift in India's financial landscape, where local capital is now powerful enough to counterbalance global volatility and heavy foreign sell-offs. The primary engine behind this dominance is the retail revolution. Systematic Investment Plans (SIPs) hit a staggering all-time high of 31,002 crore in monthly inflows as of late 2025. This steady stream of capital from household savings provides a resilient buffer that foreign investors no longer provide. Mutual funds are leading this charge, with their share in NSE-listed companies reaching double digits for the first time. Total industry Assets Under Management (AUM) reached 80.23 lakh crore by early 2026, a six-fold increase over the last decade. Pension funds and insurance giants, including LIC, have also ramped up their equity exposure. LIC alone increased its stake significantly, contributing to a total insurance sector ownership of 5.39%. This institutional participation is supported by over 261 million mutual fund folios. While foreign investors have been selective sellers—concentrating 31% of their remaining 867 billion USD holdings in just five major stocks—domestic institutions are diversifying across banking, capital goods, and healthcare. The Nifty 50 and Sensex reflect this domestic strength, trading near 25,693 and 83,580 respectively. Despite global headwinds, the consistent 25,000 crore to 30,000 crore in monthly domestic inflows ensures that Indian markets remain largely self-reliant and stable.