Bullish News
Collection
US Consumer Confidence Rebounds Amid Labor Market Concerns
US consumer confidence reached **91.2** in February 2026, surpassing the revised **89.0** recorded in January. While this signals a modest recovery from the 11-year lows seen earlier this year, the index remains significantly below the **112.8** peak achieved in late 2024. The rebound was primarily fueled by a jump in the Expectations Index, which rose **4.8 points** to reach **72.0**. This suggests that consumers are becoming less pessimistic about the short-term outlook for income and business conditions. However, the Present Situation Index, which tracks current sentiment, softened to **120.0**. Labor Market Duality The employment landscape is showing sharp contradictions. The share of consumers stating that jobs are "plentiful" rose to **28%**, a three-month high. Conversely, the number of respondents claiming jobs are "hard to get" climbed to **20.6%**, the highest level since February 2021. This "low-hire, low-fire" environment has pushed the labor market differential to **+7.4%**. Economists warn that while current unemployment remains stable at **4.3%**, the rising difficulty in finding new roles for some demographics suggests a potential rebound in the unemployment rate in upcoming reports. Demographic & Political Shifts Optimism is heavily segmented by age and affiliation. Consumers under age **35** remain the most optimistic group, driving much of the moving average upward. In contrast, confidence among those aged **35** and older edged lower. Sentiment also diverged along political lines. Confidence revived among Republican and Independent voters during February, while Democrats reported becoming less optimistic about the economic trajectory. Inflation and Spending Trends Despite the headline improvement, inflation concerns remain the top priority for households. Median 12-month inflation expectations are currently held at **4.4%**. Write-in responses frequently cited high prices, trade policy uncertainty, and political shifts as primary stressors. Spending intentions are shifting toward "necessary services" and smaller discretionary purchases. * **Buying Plans:** Interest in used cars, furniture, and smartphones is trending upward. * **Housing:** Homebuying plans continue to retreat as consumers expect interest rates to remain elevated for the next year. * **Travel:** Vacation plans saw a slight dip for both domestic and international trips. Wall Street Outlook Investors are processing these mixed signals as the Federal Reserve weighs future rate cuts. While the fourth-quarter GDP growth was a modest **1.4%**, recent hiring of **130,000** jobs in January suggests underlying resilience. Markets remain sensitive to tariff risks and the persistent gap between consumer expectations and the reality of current business conditions. The Expectation Index has now spent **13 consecutive months** below the **80** mark, a level historically associated with heightened recession risk.
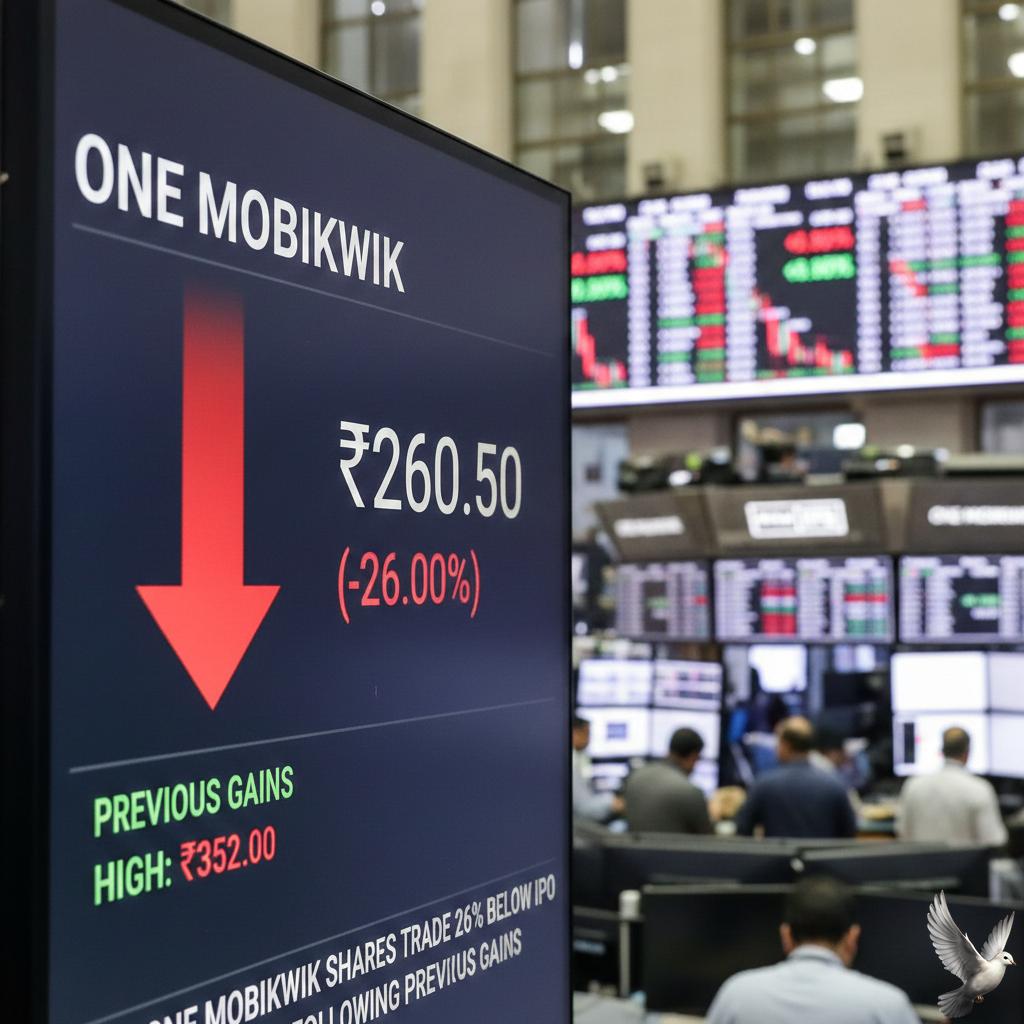
One Mobikwik Shares Trade 26% Below IPO Price Following Previous Gains
One MobiKwik Systems Ltd (MOBIKWIK) saw significant market movement following the formal activation of its stockbroking subsidiary on the Bombay Stock Exchange. The company’s wholly-owned unit, MobiKwik Securities Broking Private Limited, officially commenced operations on **February 24, 2026**. This milestone allows the firm to offer full-scale equity trading, clearing, and settlement services to its base of over **186 million registered users**. Market Response and Stock Action Investor reaction was immediate but volatile. On the day of the announcement, the stock surged as much as **12.6%** to hit an intraday high of **227.37** on the NSE. However, the gains were partially pared back. As of **February 25, 2026**, the share price is trading near **199.45**. Despite the recent momentum, the stock remains approximately **28%** below its IPO issue price of **279**. Market analysts identify a crucial support zone between **190 and 195**, noting that consistent execution in the crowded broking sector is now essential for a long-term trend reversal. Financial Turnaround The regulatory breakthrough coincides with a return to profitability. For the third quarter of FY26, MobiKwik reported a consolidated net profit of **40 million** (4 crore), a sharp recovery from the **552 million** loss recorded in the same period last year. Total income for the quarter reached **2,972 million**, marking an **8%** year-on-year growth. This turnaround was driven by a reduction in payment processing costs and improved margins in the digital credit segment. Operational Highlights The company is seeing record-level engagement across its core platforms. * **Payments GMV:** Reached an all-time high of **481 billion**, up **63%** year-on-year. * **UPI Transactions:** Surged **3.2 times** compared to the previous year. * **Digital Credit:** The ZIP EMI product saw GMV grow by **126%**, hitting **9,000 million**. Strategic Outlook The activation of the broking license transforms MobiKwik from a digital wallet into a diversified financial services hub. By integrating stockbroking, the firm aims to capture the rising wave of retail investor participation in India, particularly in Tier-3 and Tier-4 cities. While the new vertical opens a fresh revenue stream, the company faces stiff competition from established discount brokers. Future performance will depend on the platform's ability to convert its high-frequency payment users into active investors while maintaining the cost discipline that led to its recent quarterly profit.

Gold and Silver Prices Surge Amid Tariff Concerns and Geopolitical Uncertainty
Precious Metals Market Update: February 25, 2026 Gold and silver markets are experiencing significant upward momentum as investors react to a complex mix of legal rulings, trade policy shifts, and geopolitical risks. **Gold Price Performance** MCX Gold futures have firmly reclaimed the **Rs 1,62,000 per 10 grams** level. This represents a recovery of more than **Rs 7,500** from mid-February lows near **Rs 1,54,350**. In major retail hubs like Delhi and Hyderabad, 24K gold is trading at approximately **Rs 16,200 per gram**. **Silver Market Surge** Silver has delivered an even more aggressive catch-up rally. After plunging to **Rs 2,55,000 per kg** earlier this month, MCX Silver futures have surged back toward the **Rs 3,00,000 per kg** mark in spot markets. On the MCX, active contracts recently recorded single-day jumps of over **Rs 7,200**, supported by industrial demand from the solar and EV sectors. Key Market Drivers The primary catalyst for the current rally is the sudden spike in safe-haven demand. This follows a high-profile U.S. Supreme Court ruling that struck down specific "reciprocal" trade measures. In immediate response, the U.S. administration signaled a move toward a flat **15% global tariff** on all trading partners, fueling fears of a renewed trade war. * **Geopolitical Jitters:** Markets are on edge ahead of critical nuclear talks between the U.S. and Iran scheduled for late February in Geneva. * **Dollar and Yields:** While the U.S. Dollar Index remains steady near **97.00**, the uncertainty regarding the Federal Reserve's June rate path—currently seen as a **52% probability** for a cut—has kept bullion attractive. * **Physical Demand:** Domestic markets are benefiting from robust wedding season buying, while the reopening of Chinese markets after festival holidays has provided a secondary floor for global spot prices. Technical Outlook Analysts note that gold is successfully holding above its short-term moving averages. The immediate resistance for gold is pegged at **Rs 1,63,300**, with a potential extension toward **Rs 1,65,000** if trade tensions escalate. Silver’s volatility remains high. The metal has seen a massive **27% swing** within the month of February alone. While it has recovered sharply, it still remains below its January peak of **Rs 4,10,000**, suggesting room for further catch-up if the gold-silver ratio continues to narrow from its current **85:1** level. Traders are advised to watch the **Rs 1,60,000** support zone for gold. A sustained hold above this level is considered essential for maintaining the current bullish structure. For silver, support is building near the **Rs 2,60,000** mark, with resistance expected as it approaches **Rs 3,10,000**.
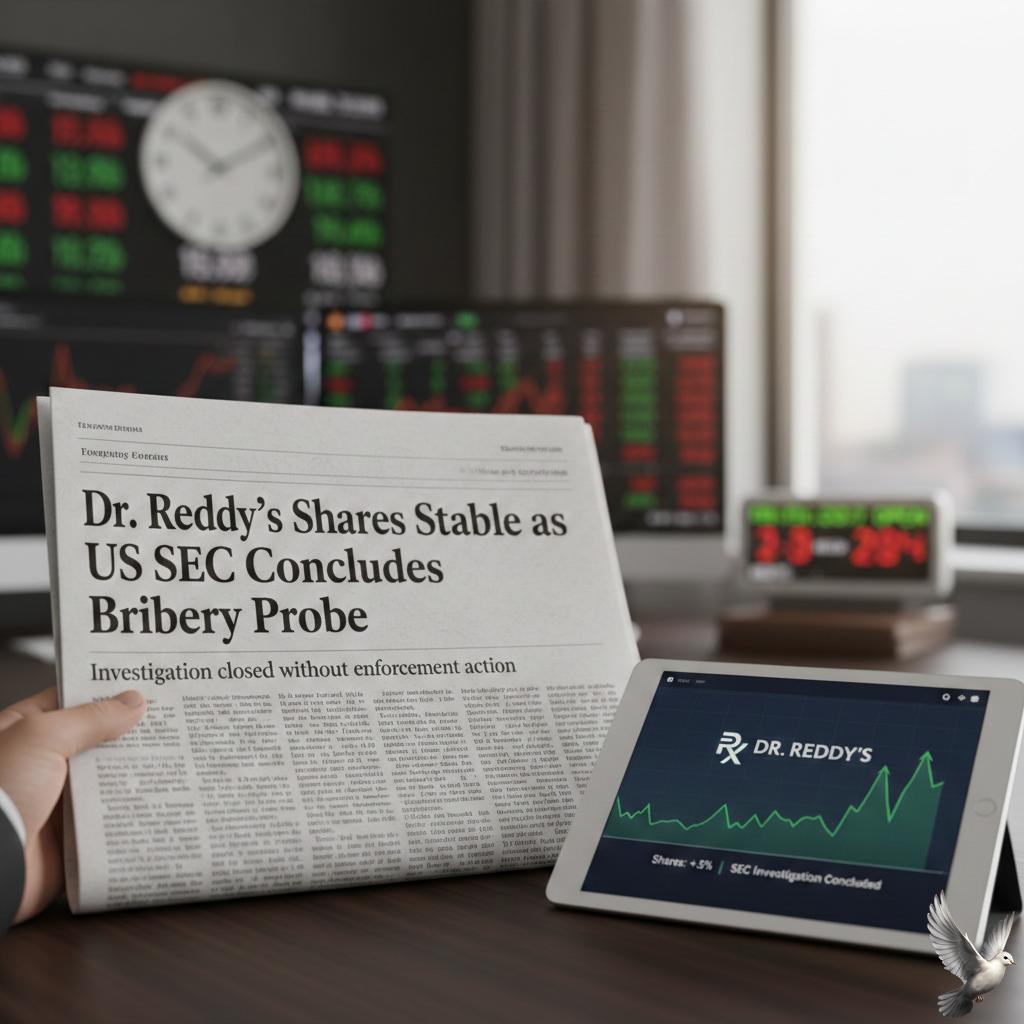
Dr. Reddy’s Shares Stable as US SEC Concludes Bribery Investigation
Dr. Reddy's Laboratories is in sharp focus today following a major regulatory breakthrough in the United States. The U.S. Securities and Exchange Commission has officially concluded its long-standing investigation into the company regarding allegations of improper payments to healthcare professionals in Ukraine and other markets. The SEC issued a formal letter on February 23, 2026, confirming it does not intend to recommend any enforcement action against the pharmaceutical giant. This decision marks the end of a high-stakes probe that began in November 2020 after an anonymous complaint suggested potential violations of the U.S. Foreign Corrupt Practices Act. Market performance for Dr. Reddy's remains steady as the regulatory overhang clears. The stock is currently trading around 1,304.40 on the National Stock Exchange. Despite a marginal intraday dip of 0.23% in recent sessions, the stock has maintained a positive trajectory with a one-month return of approximately 5.45% and a one-year gain of 15.25%. The company’s financial health provides a strong foundation for this recovery. In its most recent quarterly report for the period ending December 2025, Dr. Reddy's posted a consolidated revenue of 8,727 crore. While net profit for the quarter stood at 1,190 crore—a 15.3% year-on-year decline due to higher R&D and operating costs—the results exceeded several analyst expectations. Key financial metrics highlight the company's significant scale: - Market Capitalization: Over 1.08 lakh crore - Price-to-Earnings Ratio: Approximately 19.81 - Q3 Revenue Growth (India): 19% year-on-year - Q3 Revenue Growth (Europe): 20% year-on-year The broader Indian pharmaceutical sector continues to show resilience, growing by 7.5% in early 2025. Dr. Reddy's has outpaced many peers with a month-on-month value growth of 9.4%, driven by strong demand in the cardiac and gastrointestinal segments. Strategic advancements are also keeping the firm in the headlines. The U.S. FDA recently accepted a review for the company's biosimilar Abatacept, further strengthening its pipeline. Additionally, the firm secured manufacturing licenses for semaglutide injections in India, positioning itself in the high-growth weight loss and diabetes treatment market. The closure of the SEC probe removes a significant legal risk that has persisted for over five years. While the SEC noted that the notice is not a formal "exoneration," the decision to skip enforcement action allows Dr. Reddy's to focus entirely on its global expansion and its target of reaching a 120-130 billion dollar market valuation for the Indian pharma industry by 2030.

Analysis of Eternal's Six-Month Stock Performance and Market Trends
Eternal Market Update: February 2026 Eternal shares have faced significant volatility following a high-profile leadership transition and intensifying sector rivalry. As of **February 25, 2026**, the stock is trading near **255.30**, marking a decline of approximately **10%** since the start of the year. The price is currently resting below its **50-day and 200-day** moving averages, reflecting a loss of momentum after reaching a peak of **368.45** in late 2025. Strategic Leadership Shift A major catalyst for recent market uncertainty is the resignation of the founder from the CEO position, effective **February 1, 2026**. The former CEO has transitioned to the role of Vice Chairman to focus on external ventures. The leadership of the group has been handed to the head of the quick commerce division, a move designed to centralize the company’s focus on its fastest-growing vertical. Performance and Profitability Despite the stock price slump, the company’s Q3 FY26 financials showed fundamental strength. Consolidated net profit jumped **73%** year-on-year to reach **102 crore**. Revenue from operations witnessed a massive surge, climbing over **200%** to **16,315 crore**, though analysts noted this figure was partially boosted by a shift to an inventory-led accounting model in the quick commerce segment. Segment Breakdown The quick commerce arm reached a significant milestone by achieving adjusted EBITDA breakeven with a **4 crore** profit. The network expanded aggressively, ending the quarter with **2,027 stores**, with management targeting up to **4,000 stores** by March 2027. Meanwhile, the core food delivery business remains the primary profit engine, reporting an all-time high adjusted EBITDA margin of **5.4%**. Competitive Landscape and Outlook The broader market remains cautious as competitors like Swiggy and Zepto escalate spending to capture market share. While Eternal maintains a robust cash position of **17,820 crore**, the capital-intensive nature of the 10-minute delivery model continues to weigh on overall margins. Analysts view the current correction as a valuation reset, suggesting a period of cautious accumulation as the market awaits more predictable earnings under the new leadership structure.

PNGS Reva Diamond Jewellery IPO: Day 2 Subscription Status, GMP, and Expert Reviews
**PNGS Reva Diamond Jewellery: Market Performance and IPO Insights** The initial public offering (IPO) for PNGS Reva Diamond Jewellery has entered its second day of bidding, maintaining a steady pace with a 59% subscription rate. The 380 crore INR issue is attracting focused attention as grey market activities suggest a premium of 4 INR to 5 INR. This indicates expectations for modest listing gains as the market processes the company's valuation against its current growth trajectory. Institutional participation has emerged as a primary driver, showing robust interest from large-scale investors. In contrast, retail demand has remained moderate, reflecting a cautious approach among individual traders who are weighing the issue’s pricing against broader market volatility. Brokerage firms are currently divided on the stock; while many acknowledge the company’s healthy profit margins, others highlight potential execution risks and the challenges of maintaining high valuations in a competitive retail landscape. The broader Indian jewellery sector is navigating a transformative phase in early 2025. The domestic gems and jewellery market is now valued at approximately 105.8 billion USD. Demand remains resilient, particularly in the gold segment which was valued at 58.6 billion USD recently. Analysts expect the sector to grow at a compound annual rate of over 8%, potentially reaching 231.9 billion USD by 2034. Current financial data for related players like PNGS Gargi Fashion Jewellery provides a relevant benchmark. That entity recently reported a 15.85% rise in quarterly net profit to 10.60 crore INR, with sales growing by 27.10% to 46.06 crore INR. These figures underscore the high-growth environment within the branded jewellery space, where consolidated net profit margins are hovering around 22.21%. Investor sentiment is further influenced by favorable regulatory shifts and international trade developments. A recent framework for a US-India trade deal has proposed reducing tariffs on jewellery to 18% and abolishing duties on loose diamonds. Such macro-economic tailwinds, combined with a 15% year-over-year increase in consumer spending on premium branded products, provide a supportive backdrop for new market entrants like PNGS Reva. As the bidding process continues, the focus remains on whether retail participation will accelerate to match institutional confidence. The company's ability to leverage its established brand heritage while executing store expansions in Tier-2 and Tier-3 cities will be critical for long-term value creation.

**IRFC Shares in Focus as Government Plans 4% Divestment via Offer for Sale**
The Indian government is set to offload a significant stake in the Indian Railway Finance Corporation (IRFC), launching an Offer for Sale (OFS) that aims to raise approximately **5,430 crore**. The divestment involves a base offer of **2%** of the company’s equity, with an additional **2%** "green shoe" option to accommodate oversubscription. In total, the government may sell up to **52.27 crore** shares, reducing its current holding from **86.36%** to **82.36%**. The floor price for the offer has been fixed at **104** per equity share. This represents a discount compared to the stock's recent market performance; IRFC shares ended the most recent trading session at **109.40**, reflecting a **2.19%** daily decline as the market adjusted to the news. The bidding window opens today, February 25, exclusively for institutional and non-retail investors. Retail investors and eligible employees will be able to participate starting Thursday, February 26. IRFC serves as the primary funding arm for Indian Railways, raising capital for rolling stock and infrastructure projects. The company’s financial health remains robust, having recently reported a record quarterly profit after tax (PAT) of **1,802 crore**, a year-on-year increase of **10.5%**. Total assets under management (AUM) are currently nearing the **4.62 lakh crore** mark. Looking ahead, the corporation has outlined a strategic roadmap to grow its AUM beyond **5 lakh crore** within the next three to five years. To achieve this, IRFC is diversifying its portfolio by funding other government-linked infrastructure projects and exploring lower-cost foreign debt, including Japanese yen-denominated loans. The company maintains a notable credit profile with a **zero-NPA** (Non-Performing Asset) track record. It also continues to reward shareholders, recently declaring its highest-ever interim dividend of **1.05** per share. This stake sale is part of the government's broader strategy to meet minimum public shareholding norms while generating non-tax revenue for fiscal targets. Analysts are monitoring the retail response closely, given the stock's role as a cornerstone of India’s railway modernization program.

Union AMC's Harshad Patwardhan on the Outlook for Lumpsum Investments in Multi-Cap and Flexi-Cap Funds
Market Brief: Strategic Equity Positioning and Macro Outlook Indian equity markets are entering a period of renewed interest as corporate earnings visibility improves and valuations return to historically reasonable levels. After a volatile start to 2026, the Nifty 50 has recently stabilized near the 25,571 level, while the BSE Sensex trades around 82,814. These benchmarks have shown resilience, supported by strong domestic institutional inflows which have cushioned the impact of foreign selling. Current market dynamics suggest a favorable risk-reward balance for deploying fresh capital. The Nifty 50 is trading at approximately 20.5x one-year forward earnings, a normalization from previous peaks. Analysts expect a mid-teen growth in earnings per share for the 2026 fiscal year, with sectors like financials, metals, and consumer staples leading the charge. Multi-cap and flexi-cap strategies remain the primary recommendation for investors seeking broad-based exposure. Multi-cap funds, which maintain a structured allocation across large, mid, and small-cap stocks, have delivered a category average three-year CAGR of 19.20%. Flexi-cap funds offer more tactical flexibility, averaging 16.99% over the same period while providing a smoother experience during market swings. The macroeconomic landscape is bolstered by significant policy breakthroughs. A landmark interim trade deal with the United States has reduced reciprocal tariffs from 25% to 18%, a move expected to provide an annual 0.2 percentage point boost to GDP. Real GDP growth for 2026 is projected to remain robust at 6.9%, driven by consistent government capital expenditure and a recovery in both urban and rural consumption. Fiscal discipline remains a cornerstone of the domestic environment. The government has set a fiscal deficit target of 4.4% for the current year, with a further reduction to 4.3% projected for next year. Public capex is slated to grow by 9%, with a strategic pivot toward defense and infrastructure, ensuring long-term capacity creation. Sectoral performance is increasingly diverse. Financials, particularly state-owned banks, have shown strength with weekly gains of 1.64% in February, while the FMCG sector rose 1.71% due to resilient demand. In contrast, the IT sector has faced headwinds from global tech spending uncertainty. Investors are encouraged to adopt a "buy-on-dips" strategy to navigate near-term volatility. With inflation moderating toward the 3.9% mark and the Reserve Bank of India maintaining a policy rate of 5.25%, the environment supports a steady transition into diversified equity strategies. High-frequency indicators suggest that the current broad-based growth trajectory is well-positioned to capture evolving opportunities across all market segments.

IT Sector Decline Leads to Rs 1.2 Lakh Crore Market Value Loss for LIC and Mutual Funds
The Indian IT sector is currently navigating its most volatile period since the 2008 global financial crisis. As of February 25, 2026, the Nifty IT index has plummeted more than 21% in a single month, reflecting a localized "tech panic" primarily driven by rapid advancements in generative AI. The downturn reached a flashpoint this week following reports that new AI tools can now automate up to 70% of legacy system maintenance. This development directly threatens the traditional labor-arbitrage model that has long sustained Indian software giants. Major heavyweights have seen their market values eroded, with companies like TCS and Infosys shedding between 17% and 22% of their share price in February alone. Institutional investors are feeling the immediate impact of this structural shift. The Life Insurance Corporation of India (LIC) has seen its IT portfolio value drop by approximately 42,500 crore rupees over the last two months. Mutual funds have fared similarly, with the notional value of their top ten IT holdings shrinking by over 50,000 crore rupees as fund managers pivot toward more resilient sectors like financials. Despite the equity market turmoil, the industry’s broader fundamentals show signs of a painful but steady transition. Nasscom projections for fiscal year 2026 estimate industry revenue will grow by 6.1% to reach 315 billion dollars. This growth is increasingly fueled by AI-led services, which are expected to contribute 10 billion to 12 billion dollars this year as enterprises move from AI experimentation to full-scale execution. Valuations have now hit an eight-year low relative to the broader Nifty 500, tempting contrarian investors. The Nifty IT index is currently trading at a price-to-earnings ratio of approximately 27x, down from its five-year average of 32x. However, analysts caution that cheap valuations may not be a sufficient "buy" signal until firms prove they can monetize AI effectively and protect their margins against automated competition. The workforce landscape is also evolving. While net hiring has moderated, the industry is projected to add 135,000 jobs in 2026, bringing the total headcount to nearly 6 million. The focus has shifted toward high-end skills, with over 2 million professionals already upskilled in AI. Organizations are moving away from uniform salary hikes, with 2026 increments stabilizing at 9.1% and focusing heavily on specialized AI talent premiums. In summary, the sector remains at a critical inflection point. While short-term sentiment is dominated by the fear of revenue deflation, the long-term outlook depends on how quickly India’s IT leaders can replace declining traditional billable hours with high-value, AI-integrated consulting and engineering services.
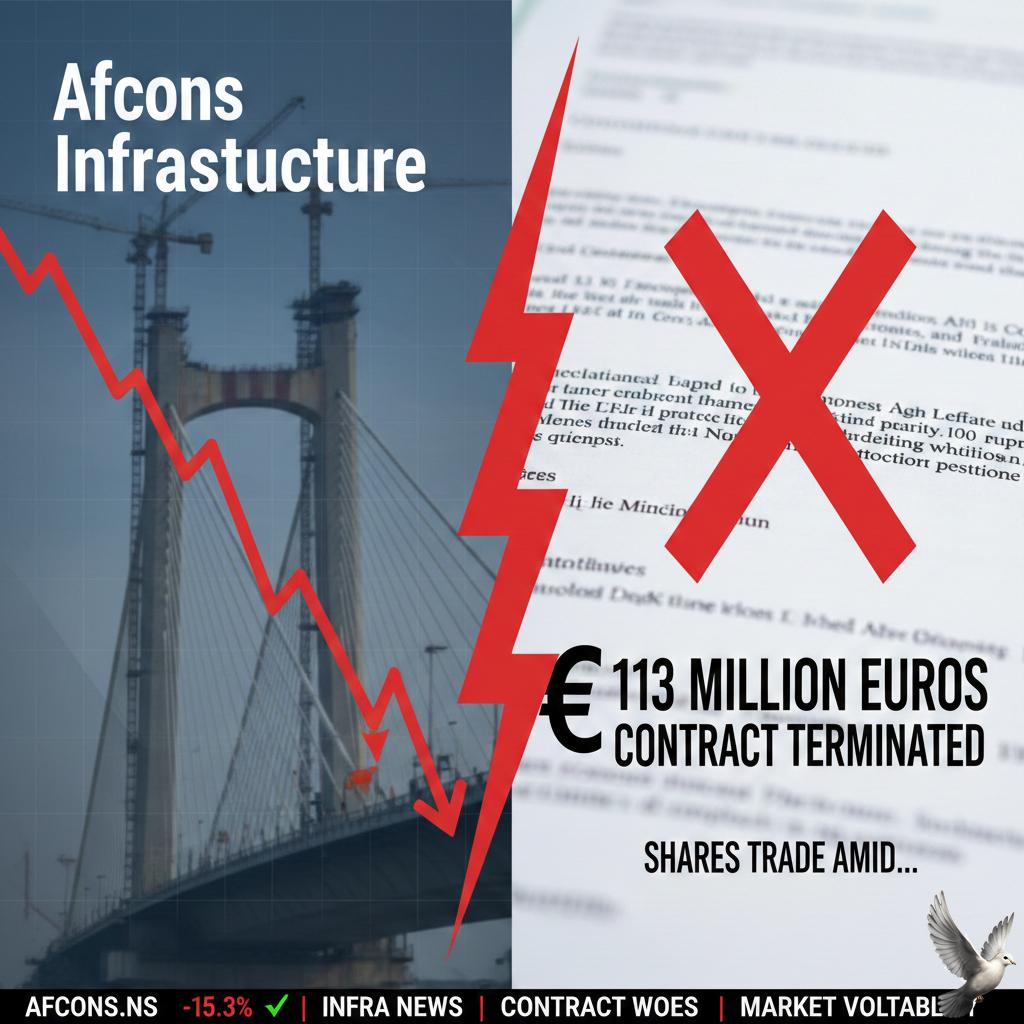
Afcons Infrastructure Shares Trade Amid Termination of €113 Million Contract
**AFCONS INFRASTRUCTURE | MARKET BRIEF** Afcons Infrastructure is navigating a significant operational challenge following the termination of a major road project in Gabon. On February 24, 2026, the company formally notified stock exchanges that Société Autoroutière du Gabon (SAG) issued a termination notice for the NR1 National Road contract. The project, valued at approximately **€113.03 million (₹1,210 crore)**, involves the construction and rehabilitation of a **117 km** highway. Despite the termination notice, Afcons reports that **93.47%** of the work was already completed as of December 31, 2025. In fact, the road has been open to public traffic for nearly two years. **Financial Impact & Market Reaction** The stock experienced immediate pressure, closing at **₹308.00** on February 24, a decline of **1.57%**. The shares have touched a 52-week low of **₹302.50**, reflecting a year-on-year drop of over **31%**. A critical point of financial friction is the invocation of performance bonds worth **€17.8 million (₹191 crore)** by the client. Afcons has contested this move and the termination, describing them as inconsistent with contractual terms. The company has already initiated arbitration proceedings under the International Chamber of Commerce (ICC). **Quarterly Performance Metrics** The Gabon dispute coincides with a period of consolidated financial cooling. In its Q3 FY26 results: - Net profit fell **34.8%** year-on-year to **₹97 crore**. - Revenue declined **7.3%** to **₹2,975 crore**. - EBITDA rose **12.3%** to **₹409.5 crore**, with margins expanding to **13.8%**. **Order Book & Outlook** Management maintains that the Gabon issue is project-specific and does not threaten the company’s broader stability. The total order book remains robust at **₹31,543 crore**, providing a book-to-bill ratio of **2.5 times**. The remaining **7%** of the Gabon project is reportedly stalled due to the client's failure to hand over required land. While legal proceedings may be lengthy, the company asserts its operational capability and overall business outlook remain unchanged. [Afcons Infrastructure Contract Dispute](https://www.youtube.com/watch?v=2wW5x0KRWLo) This video provides broader context on the evolving economic and infrastructure partnership between India and African nations as of early 2026. http://googleusercontent.com/youtube_content/0
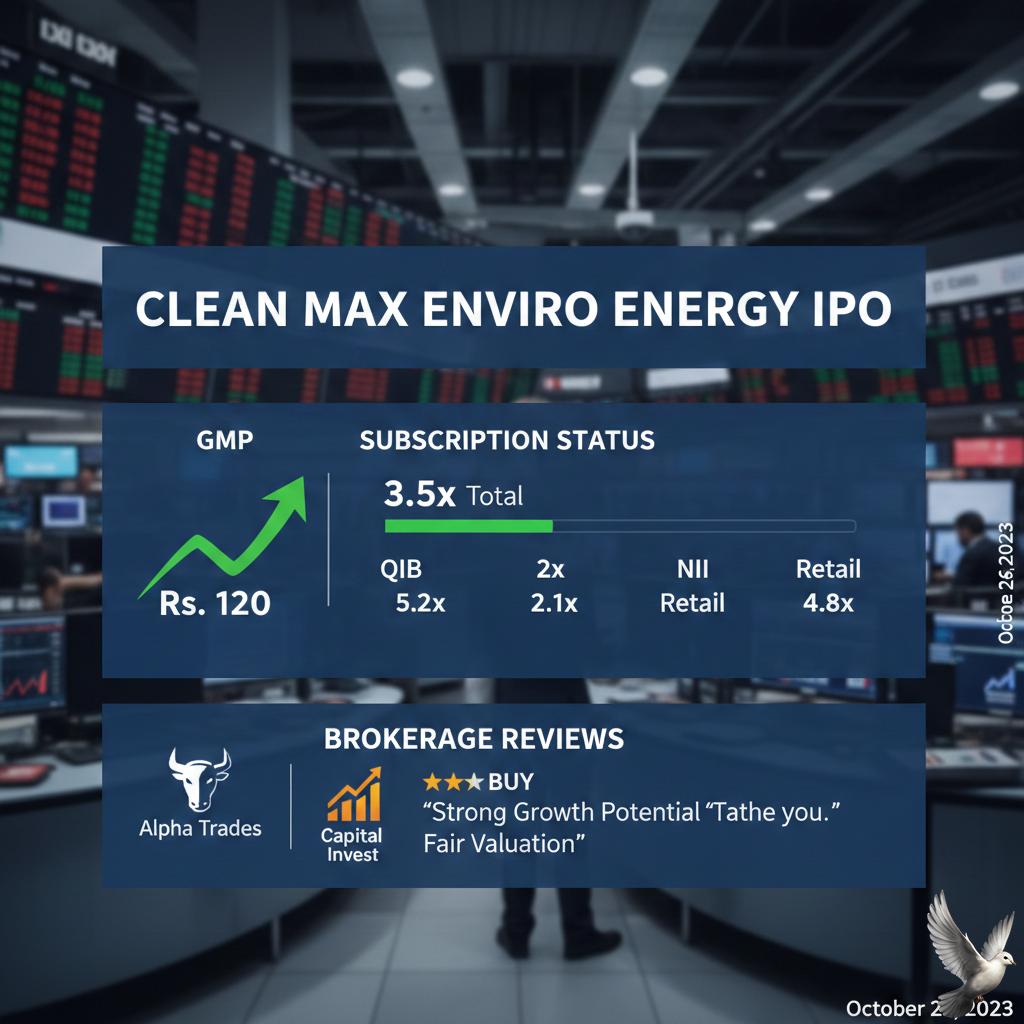
Clean Max Enviro Energy IPO: GMP, Subscription Status, and Brokerage Reviews
**CLEAN MAX ENVIRO IPO BRIEF** The Rs 3,100 crore Clean Max Enviro Energy Solutions IPO has reached its final day of bidding on February 25, 2026. Despite its position as India’s leading renewable energy provider for the commercial and industrial (C&I) segment, the issue has seen a cautious reception from the broader market. **Subscription and Market Sentiment** As the bidding window nears its close, the overall subscription stands at approximately 45%. A stark divide exists between investor classes: - Qualified Institutional Buyers (QIB) have fully booked their portion, showing over 1.03x subscription. - Non-Institutional Investors (NII) have covered roughly 31% of their quota. - Retail participation remains notably muted at just 3% to 4%. **Pricing and Gray Market Activity** The price band is fixed between Rs 1,000 and Rs 1,053 per share. In the gray market, the premium (GMP) has been hovering near a flat Rs 1, representing a negligible 0.09% upside. This suggests the market is pricing in a very lean listing, providing little incentive for short-term gain seekers. **Company Financials and Valuation** Clean Max reported a significant turnaround in FY25, posting a net profit of Rs 19.43 crore compared to previous losses. Revenue grew to Rs 1,610 crore with a robust EBITDA margin of 63.1%. However, the company carries a substantial net debt of approximately Rs 5,938 crore. The valuation at the upper price band reflects an EV/EBITDA multiple of roughly 17.5x. While lower than some listed peers, analysts remain divided on whether this pricing leaves enough on the table for new investors given the high capital intensity of the business. **Sector Context and Outlook** The IPO comes at a time of rapid expansion in the Indian renewable sector. National capacity reached 254 GW by late 2025, with non-fossil fuels now contributing over 51% of India's total power mix. Clean Max currently manages 2.80 GW of operational capacity and has a pipeline of 3.17 GW under execution. A primary objective of the Rs 1,200 crore fresh issue component is to repay approximately Rs 1,122 crore of debt. Strengthening the balance sheet is viewed as critical for the company to capitalize on the rising demand for green power from data centers and heavy industries aiming for net-zero targets. **Key Dates to Watch** The final allotment status is expected to be finalized on February 26, 2026. Following the credit of shares to demat accounts on February 27, the company is tentatively scheduled to debut on the BSE and NSE on March 2, 2026.

**Anthropic Partnerships Ease Disruption Fears for Infosys, TCS, and Other IT Stocks**
Market dynamics for the Indian Information Technology sector have entered a critical phase following a period of intense volatility and structural reassessment. **Sector Performance and Benchmarks** The Nifty IT index has experienced a significant correction, recently sliding to approximately 30,053. This represents a steep decline of nearly 21% within a single month and a 23% drop over the last year. The index reached a 52-week low of 29,875 during this period, reflecting the heavy selling pressure that has dominated market sentiment. **AI Disruption and Strategic Shifts** Fears of AI-led disruption have been a primary catalyst for recent sell-offs. Concerns spiked after Anthropic introduced new programming capabilities through tools like "Claude Code," which target the modernization of legacy systems. This development initially triggered anxiety regarding the future of traditional IT outsourcing. However, sentiment is beginning to shift as Indian IT majors pivot from defense to active collaboration. Infosys and Anthropic recently announced a strategic partnership to deploy Claude AI for enterprise clients, focusing on sectors like telecom and finance. This move suggests that Indian firms are repositioning as AI enablers rather than victims of automation. **Individual Stock Movements** Major industry players have seen significant price adjustments: - Tata Consultancy Services (TCS) is trading near 2,573 - Infosys has settled around 1,275 - HCL Tech is hovering at 1,328 - Wipro has touched levels near 200 **Technical Indicators and Oversold Territory** Heavy liquidations have pushed the majority of the sector into deep oversold territory. The Relative Strength Index (RSI) for several blue-chip IT stocks has dropped well below the 30 threshold, with some reaching extreme lows between 17 and 22. While these levels often attract contrarian buyers looking for a rebound, analysts maintain a cautious outlook. **Future Growth and Revenue Outlook** Revenue growth for FY2026 is projected to be moderate, ranging between 4% and 6% in USD terms. Despite the current turbulence, the industry is expected to reach a 350 billion USD valuation by 2026. This growth is anticipated to be driven by high-margin segments including cybersecurity, data centers, and specialized AI integration services. **Investment Sentiment** Institutional flows remain a key monitorable. While foreign portfolio investors (FPIs) have been net sellers in the IT space during early 2026, domestic institutional investors have shown interest in the sector at these lower valuations. The market is currently navigating a transition where legacy managed services may shrink, while high-value AI consulting and implementation are expected to expand the addressable market to an estimated 400 billion USD by 2030.

US Imposes Preliminary 126% Import Duty on Solar Cells and Modules From Southeast Asia
The US Commerce Department has sent shockwaves through the renewable energy sector by imposing preliminary countervailing duties of 126% on solar imports from India. This move follows a determination that Indian manufacturers benefit from unfair subsidies, allowing them to undercut American producers. The decision effectively makes the US market inaccessible for many Indian exporters who had recently seen a surge in demand. India, Indonesia, and Laos combined to supply 57% of US solar module imports in the first half of 2025. For India, the stakes are high as the US remains its primary export destination, accounting for roughly 97% of all solar module shipments. In 2024 alone, Indian solar exports to the US were valued at 792.6 million dollars—a nine-fold increase from 2022. Market leaders like Waaree Energies and Premier Energies are now in the spotlight as they navigate this trade barrier. Waaree Energies, with a market capitalization of approximately 83,873 crore rupees, has moved to mitigate such risks by establishing manufacturing capacity within the US. In contrast, Premier Energies maintains a smaller export footprint to the US but faces increased competition in the domestic market as export-diverted supply grows. The timing of this duty is particularly significant. It comes just weeks after a bilateral trade framework aimed to reduce tariffs on Indian solar products to 18%. Instead, the new 126% levy, coupled with a baseline 10% global tariff recently issued by the US administration, creates a formidable wall for Indian solar hardware. Analysts note that these duties may lead to a supply glut within India. Domestic manufacturing capacity has expanded rapidly, reaching 55 GW for modules and 52 GW for cells by late 2025. With the US market closing, manufacturers may be forced to aggressively target domestic projects or seek new markets in Europe and Africa. Despite the export hurdle, India's internal solar market remains robust. The country added a record 37.9 GW of solar capacity in 2025, a nearly 55% increase year-on-year. Government initiatives like the PM Surya Ghar program, which targets solar for 10 million households, continue to provide a critical safety net for domestic manufacturers. A final determination on these subsidy investigations is expected by July 2026. Until then, Indian solar stocks are likely to experience heightened volatility as firms recalibrate their global sales strategies and accelerate local deployment to offset international losses.
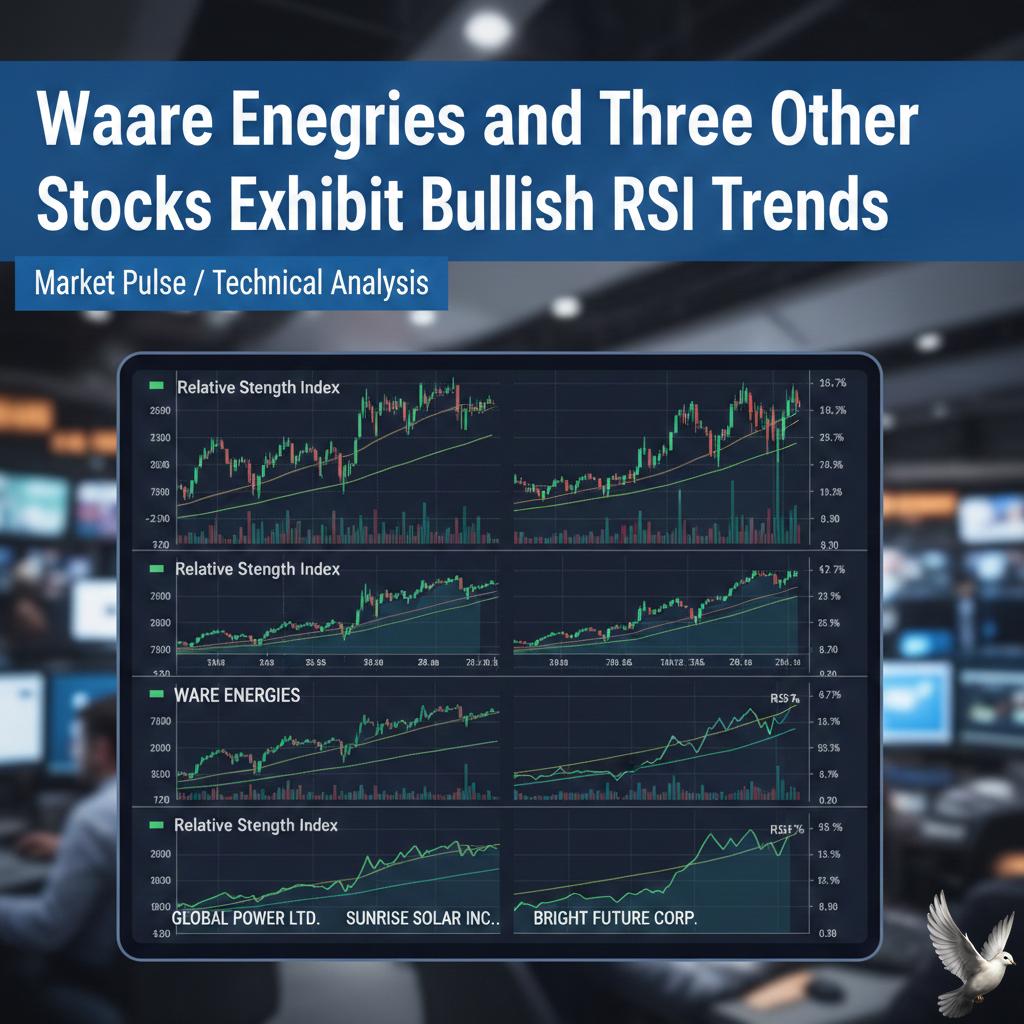
Waaree Energies and Three Other Stocks Exhibit Bullish RSI Trends
The Indian equity markets witnessed a notable technical shift as several Nifty 500 constituents signaled a surge in price momentum. On February 24, four specific stocks—including Waaree Energies and AU Small Finance Bank—cleared the crucial RSI 50 threshold. This crossover from below 50 indicates that buying pressure is beginning to outweigh selling interest, often serving as a precursor to sustained uptrends. Waaree Energies emerged as a primary focus following its 3.69% climb to 3,023.50. The solar PV module giant’s RSI jumped from 48.43 to 55.05, bolstered by a significant new order for 500 MW solar modules. The company also strengthened its green hydrogen footprint through an agreement for a 2.5 MW alkaline electrolyzer project. Currently, the firm maintains a robust market capitalization of approximately 84,500 crore. AU Small Finance Bank also exhibited a bullish RSI upswing, rising from 44.25 to 51.71. The stock closed near the 1,002 level, reflecting a 2.8% gain. The bank continues to display fundamental strength with a 5-year profit CAGR of 25.6% and a market valuation exceeding 74,900 crore. Other notable momentum gainers in the technical scan included Cholamandalam Investment and Finance, which saw its RSI reach 55.52, and Vishal Mega Mart at 50.62. These technical breakouts occurred against a backdrop of broader market volatility. While specific mid-cap stocks found support, the frontline indices faced heavy pressure on Tuesday. The BSE Sensex plummeted 1,069 points to end at 82,226, while the Nifty 50 dropped 288 points to close at 25,425. This downturn was largely driven by a sharp sell-off in the IT and banking sectors, with major players like Tech Mahindra and HCL Tech sliding over 6%. The divergence between the broad market decline and the RSI breakouts in the Nifty 500 highlights a shift toward selective stock picking. Traders are increasingly monitoring these 50-level crossovers as a filter to identify resilient stocks that are gaining internal strength despite the negative sentiment surrounding large-cap benchmarks. Key support for the Nifty remains at 25,400, while these trending stocks move toward higher resistance zones.

Natco Pharma and Six Other Stocks Show Technical Indicators Suggesting Potential Uptrend
Market Brief: Bullish Signals Amidst Broader Volatility The Indian equity market witnessed a significant divergence on February 24, 2026. While benchmark indices faced a steep correction, select mid-cap and small-cap stocks flashed rare technical strength. Seven stocks within the Nifty 500 universe formed a "White Marubozu" candlestick pattern, a signal often indicating intense buying pressure and a potential near-term uptrend. Natco Pharma emerged as a standout performer, surging 5.81% to settle at 944.85. The stock opened at 886.90 and reached an intraday high of 950.00, demonstrating consistent demand throughout the session. This bullish momentum comes as the company maintains a robust return on equity of 24.78%, outperforming its historical five-year average. Bandhan Bank also mirrored this technical strength, rising 3.98% to close at 180.55. Despite general pressure in the financial sector, the bank’s stock opened at 172.95 and touched a high of 181.70. Trading volume for the counter hit 20.48 million shares, significantly higher than its typical daily average, signaling strong conviction among buyers. This localized bullishness occurred against a backdrop of broader market weakness. The Nifty 50 index plunged 288.35 points, or 1.12%, to close at 25,424.65. Simultaneously, the BSE Sensex plummeted 1,068.74 points to end at 82,225.92. The downturn was primarily fueled by a 4% crash in the IT sector, triggered by global concerns over trade tariffs and regional geopolitical tensions. Macroeconomic pressures further weighed on the sentiment. Brent crude oil prices climbed toward 72.00 per barrel, raising inflation concerns for the domestic economy. Additionally, the Indian Rupee weakened to 90.00 against the US Dollar, tracking a rise in the US Dollar Index toward the 98.00 mark. While heavyweights like Tech Mahindra and HCL Technologies dragged the main indices down with losses exceeding 6%, the Nifty 500 breadth showed 305 stocks ending in the red. However, the emergence of White Marubozu patterns in counters like Natco and Bandhan Bank suggests that investors are rotating capital into specific value-driven pockets. Market participants are closely watching these technical breakouts. A White Marubozu indicates that the opening price was the day's low and the closing price was the high, showing that buyers maintained control without any significant pullback. This often precedes continued upward movement if the broader market stabilizes.
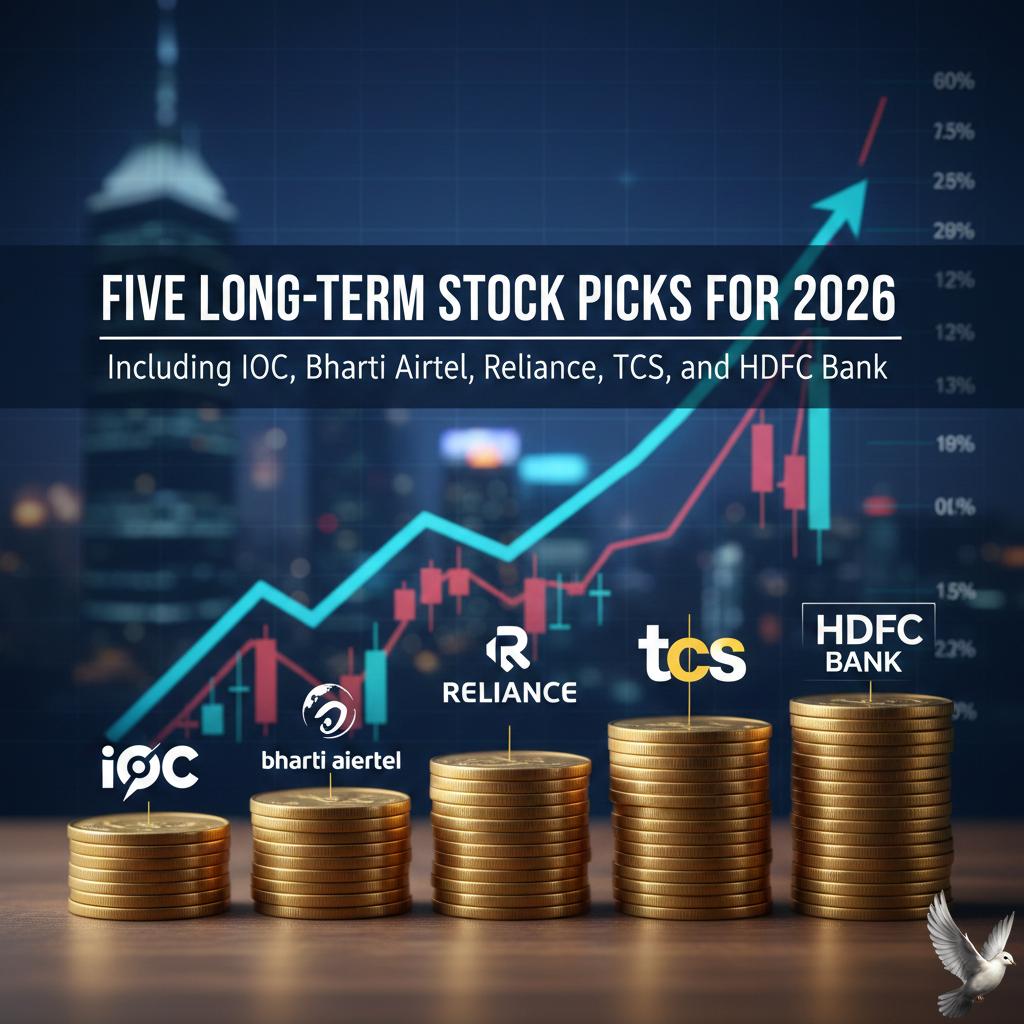
Five Long-Term Stock Picks for 2026 Including IOC and Bharti Airtel
Market Overview The Indian equity benchmarks faced significant downward pressure in the latest sessions. The **Nifty 50** declined **288.35 points** or **1.12%** to settle at **25,424.65**. The **BSE Sensex** saw a sharper drop, plummeting **1,069 points** or **1.28%** to close at **82,226**. This volatility resulted in a loss of approximately **2.85 lakh crore** in investor wealth in a single day. A massive sell-off in information technology stocks was the primary driver of the decline. Market sentiment was dampened by global tech uncertainty, AI-led disruption fears, and potential U.S. tariff policy changes. Sector Performance The **Nifty IT** index hit a **30-month low**, with major heavyweights like **Tech Mahindra** and **HCL Tech** falling more than **5.8%**. **TCS** and **Infosys** also declined by approximately **3.5%**. In contrast, the **Nifty Bank** showed resilience earlier in the week, rising **1.64%** behind strong buying in state-owned lenders. **PSU Banks** added about **1.3%** in recent gains, outperforming the broader market. The **Energy** and **FMCG** sectors provided some cushioning. **NTPC** led gainers with a **2.4%** rise, while **Hindustan Unilever** and **Coal India** also traded in the green. Economic Indicators India’s **GDP growth** remains robust, with projections for **Q3 FY26** estimated at **8.1%**. This is supported by strong rural and urban consumption. The **First Advance Estimates** project a total growth of **7.4%** for the full fiscal year **2026**. A major revision of the GDP base year to **2022-23** is scheduled for release on **February 27, 2026**. **Headline inflation** has moderated significantly, averaging **1.7%** between April and December. The **RBI** has revised its inflation projection for **FY26** downward to **2.0%**. The **Indian Rupee** recently appreciated slightly to **90.66** against the US dollar, bolstered by foreign investment inflows despite equity market volatility. Top Brokerage Recommendations **UPL** **Elara Capital** maintains a **Buy** rating with a target price of **980**. With a current price of **676**, the brokerage anticipates a potential upside of **44%**. **IndusInd Bank** **Emkay Global** recommends a **Buy** with a target of **1,100**. At the current market price of **925**, this implies an **18%** upside potential. **PTC India** **Elara Securities** reiterates a **Buy** call. The target is set at **210** against a current price of **168**, suggesting a **25%** gain. **VIP Industries** A **Buy** rating is assigned by **Elara Securities** with a target of **430**. This reflects a potential **16%** increase from the current level of **368**. **Bharti Airtel** **Anand Rathi** identifies a buying range between **2,020 and 2,035**. The target is set at **2,100** with a stop loss maintained at **1,985**. **Coal India** Technical analysts suggest buying in the **415–425** zone. The stock has a target price of **470**, supported by strong confluence at the **200 DEMA**.

Yaap Digital IPO: GMP and Key Details as Subscription Opens
Yaap Digital has officially launched its Initial Public Offering today, February 25, 2026, marking a significant entry into the NSE SME platform. The company seeks to raise 80.11 crore through a fresh issue of 55.25 lakh equity shares. The price band is set between 138 and 145 per share. The issue is open for subscription until February 27. Retail investors can participate with a minimum lot size of 1,000 shares, requiring a base investment of 2,90,000 at the upper price limit. Following the bidding process, the basis of allotment is expected to be finalized on March 2, with the official listing on the NSE Emerge platform scheduled for March 5. Investor interest is bolstered by the presence of marquee names. Ace investors Mukul Agrawal and Sunil Singhania, through the India Ahead Venture Fund, secured minority stakes prior to the launch. Each investor holds approximately 4.68% of the company, signaling high institutional confidence in Yaap’s data and AI-led marketing model. Financially, the company has demonstrated a strong upward trajectory. Revenue from operations reached 152.54 crore in FY25, up from 112.55 crore the previous year. For the nine-month period ending December 2025, the company reported a total income of 91.42 crore and a profit after tax of 9.21 crore. Key performance indicators are robust, with a Return on Equity (ROE) of 74.11% and a Return on Capital Employed (ROCE) of 45.07% for the last full fiscal year. The capital raised is earmarked for strategic expansion and infrastructure. Specifically, 34 crore is allocated for the acquisition of GoZoop Online Private Limited, a move aimed at consolidating market share. Additionally, 4.01 crore will fund the establishment of a specialized AI-led short-form content production hub to capitalize on the surge in digital consumption. Remaining funds will address incremental working capital and general corporate purposes. Yaap Digital operates across India, the UAE, and Singapore, positioning itself as an "AI-first" agency. It services over 90 major clients across the BFSI, FMCG, and technology sectors. The company’s growth coincides with a broader shift in the Indian digital advertising market, which is projected to grow by 15% to reach 56,400 crore in FY2026. This momentum is driven by the rise of 806 million internet users and an increasing corporate shift toward ROI-measurable, technology-enabled marketing strategies.

Omnitech Engineering IPO: Subscription Details, Brokerage Reviews, and Grey Market Premium
Omnitech Engineering officially launched its initial public offering (IPO) today, **February 25, 2026**, marking a significant milestone for the Gujarat-based precision manufacturing specialist. The firm seeks to raise **Rs 583 crore** through a book-building process that remains open for subscription until **February 27, 2026**. The issue is priced in a band of **Rs 216 to Rs 227** per share. Investors can participate with a minimum lot size of **66 shares**, requiring a retail investment of **Rs 14,982** at the upper price limit. The offering is a strategic mix, featuring a fresh issue of **Rs 418 crore** alongside an offer for sale (OFS) of **Rs 165 crore** by the company’s promoter. Market sentiment ahead of the listing appears cautiously optimistic. As of today, the grey market premium (GMP) is hovering around **Rs 7 to Rs 8** per share, suggesting a modest listing gain of approximately **3.5%**. This follows a period of softening in grey market activity, down from earlier highs of **Rs 15** seen last week. Omnitech’s financial trajectory has shown explosive growth leading into this IPO. Revenue for **FY25** surged by over **92%** to **Rs 342.9 crore**, while profit after tax (PAT) jumped an impressive **132%** to **Rs 43.9 crore**. This momentum has carried into the current fiscal year, with the company reporting revenue of **Rs 228.1 crore** for the first half of **FY26**. The company’s order book is a primary highlight for investors. As of **September 2025**, it stood at a robust **Rs 1,764.7 crore**, a massive leap from the **Rs 283.6 crore** recorded in March of the same year. This growth is largely fueled by a global footprint, with exports to **24 countries** accounting for roughly **75%** of total revenue. Proceeds from the fresh issue are earmarked for aggressive expansion. The company plans to deploy **Rs 233.5 crore** to establish two new manufacturing facilities in Rajkot, while **Rs 50 crore** will be utilized to pare down existing debt, which currently stands at **Rs 382.9 crore**. Operating in the high-precision components and automation sector, Omnitech serves critical industries including automotive, aerospace, and pharmaceuticals. While the growth figures are strong, analysts point to high customer concentration and geographical risks as factors to watch, with the top 10 clients contributing nearly half of the revenue. The shares are scheduled to be finalized for allotment on **March 2, 2026**, with the official listing on the BSE and NSE slated for **March 5, 2026**. This IPO offers a direct entry point into India’s expanding role as a global precision engineering hub, supported by a compound annual market growth rate of **5.5%** projected through 2030.

Yashhtej Industries IPO: BSE SME Listing Preview and Grey Market Premium Trends
Yashhtej Industries Makes BSE SME Debut **Listing Performance** Yashhtej Industries officially listed on the **BSE SME platform** today, February 25, 2026. The stock debuted at a price of **110 per share**, aligning exactly with its issue price. This flat opening reflects the **0% Grey Market Premium (GMP)** observed leading up to the listing, signaling a cautious but stable entry into the public market. **IPO Subscription and Demand** The fixed-price issue, which aimed to raise **88.88 crore**, saw a total subscription of **1.37 times**. Retail investor interest was notably stronger, with the segment subscribed **2.35 times**. In contrast, the non-institutional investor portion saw more muted participation, reaching only **0.39 times** the offered shares. Operations and Growth Drivers **Revenue and Profitability** The company has demonstrated rapid financial expansion over the last fiscal year. For **FY25**, Yashhtej reported a total income of **324.96 crore**, a significant jump from previous years. More impressively, Profit After Tax (PAT) surged to **11.57 crore** in FY25, compared to just **1.13 crore** in FY24. **Strategic Business Model** Yashhtej operates a B2B model focused on the processing of soybean crude oil and the production of **De-Oiled Cake (DOC)**. DOC is a high-protein byproduct essential for the animal feed industry. The company currently supplies crude oil to major refiners and has begun diversifying into renewable energy with a **5MW solar project**. Market Context and Future Outlook **Forward Integration** A primary objective of this IPO is to fund a new **200 TPD Soya Solvent Refinery Plant** and a **50 TPD Bottling Plant**. This move allows Yashhtej to move into the higher-margin B2C edible oil segment, reducing its reliance on supplying crude oil to third-party refiners. **Industry Trends** The listing comes at a time of tightening domestic supply. India's soybean crop for the **2025-26** season is estimated at **105.36 lakh tonnes**, down from **125.82 lakh tonnes** the previous year. While this puts pressure on raw material availability, it has supported a bullish trend in soybean prices, which recently averaged around **4,704 per quintal** in key markets like Indore. **Capital Allocation** The company plans to deploy **63.88 crore** of the fresh issue proceeds toward capital expenditure for its refinery expansion. An additional **6.11 crore** is earmarked for working capital to support its intensified processing activities and the rollout of its branded edible oil products.

12 Stocks Trade Below 200-Day Moving Average
The Indian stock market faced a significant downturn on February 24, 2026, as benchmark indices snapped a two-day winning streak. The Nifty 50 tumbled 288.35 points, or 1.12%, to close at 25,424.65. Simultaneously, the BSE Sensex plummeted 1,068.74 points, or 1.28%, finishing the session at 82,225.92. Technical scans from StockEdge revealed a notable shift in long-term momentum, as 12 prominent stocks from the Nifty 500 pack slipped below their 200-day Daily Moving Average (DMA). This indicator is widely used by institutional investors to separate long-term uptrends from potential bearish reversals. Among the high-profile names crossing below this critical threshold was Hyundai Motor India, which closed at 2,159.90 against its 200 DMA of 2,251.04. Real estate major Sobha followed suit, ending at 1,455.60, while telecom giant Bharti Airtel slipped to 1,941, falling under its long-term average of 1,975.65. The technology sector faced the steepest selling pressure, fueled by global concerns over AI-driven disruptions to traditional outsourcing models. Tech Mahindra led the laggards with a 6.3% drop, while HCL Technologies fell 5.8%. Other major IT firms like Infosys and TCS also saw declines exceeding 3.5%. Financial and insurance sectors were not immune to the volatility. One97 Communications (Paytm) settled at 1,131.70, dropping below its 200 DMA of 1,150.33. Other notable technical breaches included ICICI Lombard, Metropolis Healthcare, and IIFL Finance, all of which finished the day below their long-term trend lines. Market sentiment was further weighed down by persistent geopolitical tensions in the Middle East and uncertainty regarding global trade policies. These factors pushed oil prices higher, compounding concerns over cost pressures for Indian industries. Despite the broad-based sell-off, defensive rotation was visible in select pockets. NTPC gained 2.1% and Hindustan Unilever rose 0.8%, as investors sought safety in utilities and consumer staples. Gold prices also reacted to the global risk-off sentiment, with MCX Gold trading near 159,849 per 10 grams. Currency markets remained relatively stable, with the USD/INR pair hovering around 90.95. Institutional activity showed a divergence, with Domestic Institutional Investors (DIIs) providing some support against foreign outflows, though it was not enough to prevent the sharp correction in the primary indices.