Bullish News
Collection
Standard Chartered India 2025 Profit Increases Amid Lower Expenses and Provisions
Standard Chartered India recorded a robust 15% growth in profit before tax for the 2025 calendar year, reaching $542 million. This double-digit expansion was achieved despite a 3% decline in operating income, which settled at $1.49 billion. The performance highlights a strategic shift toward cost efficiency and improved risk management within the region. Operational expenses in India were reduced by 5%, falling to $912 million. Even more significant was the 59% drop in total provisions and credit impairments, which plummeted to $45 million from the previous year’s $109 million. These figures reflect a high-quality credit environment and disciplined balance sheet management, even as total loans and advances saw a minor contraction of 5% to $12.28 billion. India has now climbed to the fourth-largest contributor to the bank’s global profits. This rise comes as the contribution from China saw a 24% decline, dropping to $376 million. Globally, the group’s pre-tax profit rose 16% to $7.9 billion, supported by a 24% surge in wealth management solutions and strong momentum in global banking. The broader Indian banking sector continues to show exceptional resilience. As of early 2026, the industry has achieved record aggregate net profits, with public sector bank profits rising to ₹1.78 lakh crore. Gross non-performing assets across the sector have reached a multi-decade low of approximately 2.31%, while capital adequacy ratios remain strong at over 17%. Economic indicators support this financial stability. India’s GDP growth for the current fiscal is projected at 7.4%, the fastest among G-20 economies. While retail inflation saw a slight uptick to 2.75% in January 2026, it remains well within the central bank's target range. This has allowed the Reserve Bank of India to maintain a stable policy rate environment, with the 10-year benchmark bond yield recently softening to 6.68%. Standard Chartered’s strategy for the coming year focuses heavily on the "Global Indian" and "Global Chinese" wealth corridors. The bank is leveraging its position as a leading international manager to capture increasing cross-border wealth flows. Following a $1.5 billion share buyback and a 65% increase in full-year dividends, the institution is positioned to capitalize on India’s role as a primary engine of global growth through 2026.

Vivriti Promoter Increases Stake Amid Strategic Shift Toward Fee Income
Vivriti Group has announced a significant corporate restructuring, launching Vivriti Next as a new unified holding and operating entity. This strategic move, effective April 1, 2026, centralizes the group’s core businesses—Vivriti Capital and Vivriti Asset Management—under a single platform to streamline operations and expand into new financial verticals. Promoter and Managing Director Vineet Sukumar has underscored his commitment to this transition by infusing 200 crore INR in fresh personal equity. This investment increases his ownership stake to 11.5%, up from under 7% previously. The capital injection is part of a broader roadmap to scale the business ahead of an initial public offering (IPO) projected before 2029. The new structure is designed to transition the company beyond traditional lending. Vivriti Next will offer a diversified suite of services for mid-market clients, including capital markets solutions, technology-led services, and specialized advisory in capital structuring, risk management, and ESG compliance. Financially, the group maintains a robust growth trajectory. As of late 2025, total assets under management reached 15,333 crore INR. The lending book alone stands at 10,784 crore INR, characterized by a highly focused mid-market strategy with an average ticket size of 25 crore INR. The restructuring also aims to shift the group's revenue profile. Leadership targets an increase in fee-based income to approximately 7% to 8% of total revenue, rising from the current 3% level. Overall profit is expected to grow by 25% in the short term as these new service lines gain traction. Major global and domestic institutional investors continue to hold the majority of the equity. Creation Investments remains the largest shareholder with a 48% stake, followed by Lightrock at 20%, with TVS Capital Funds also maintaining a significant position. Collectively, these institutional backers hold roughly 75% of the entity. The private credit arm, Vivriti Asset Management, continues to see strong demand from high-net-worth individuals and family offices seeking yields with lower volatility. The firm is currently managing nearly 5,000 crore INR and plans to launch a 3,000 crore INR Diversified Bond Fund in 2026 to capitalize on the expanding Indian debt market. This evolution comes at a time of high activity in the Indian financial sector. NBFC assets under management are projected to grow by 15-17% through 2026, while total bank credit has recently surpassed the 200 lakh crore INR milestone. Vivriti Next is positioned to leverage this momentum by providing integrated, tech-enabled financial solutions to mid-market enterprises that have historically lacked access to sophisticated capital market tools.
AMD Shares Climb Following Chip Supply Agreement With Meta
Advanced Micro Devices (AMD) has finalized a transformative $60 billion partnership with Meta Platforms, securing a primary role in building the social media giant’s next-generation artificial intelligence infrastructure. The five-year agreement includes a strategic equity component, granting Meta the option to purchase up to 10% of the chipmaker. This depth of collaboration mirrors a similar multi-billion-dollar deal AMD recently established with OpenAI, signaling a shift in the AI hardware landscape. **Infrastructure and Hardware Deployment** AMD will supply 6 gigawatts of compute capacity to Meta, beginning with a massive rollout in the second half of 2026. The initial phase features custom-designed Instinct MI450 GPUs, which are optimized specifically for Meta’s unique workloads and built on the new Helios rack-scale architecture. In addition to flagship graphics processors, Meta is integrating AMD’s 6th Gen EPYC "Venice" CPUs into its data centers. This diversified approach aims to reduce the industry's reliance on single-source suppliers and provide the raw power needed for Meta's "personal superintelligence" projects. **Market Performance and Financial Outlook** AMD shares reacted with significant volatility to recent news, closing at $196.60 on February 23, 2026. While the stock has seen a 20% pullback from its January highs of $267, the Meta deal provides strong long-term revenue visibility. Wall Street remains focused on AMD's data center segment, which is projected to maintain a compound annual growth rate exceeding 60%. Analysts have set a wide range for 12-month price targets, with an average of approximately $260.91, reflecting optimism about the firm's expanding footprint in the inference market. **Spending Trends in the Sector** Meta has substantially increased its capital expenditure forecast for 2026, targeting a range between $115 billion and $135 billion. A significant portion of this budget is dedicated to high-performance AI silicon and specialized networking hardware. While competitors like Nvidia remain dominant with over 90% of the training market, AMD is successfully capturing share in AI inference. The broader industry trend shows "Big Tech" firms—including Microsoft and Alphabet—investing over $630 billion annually to secure the hardware necessary for the global AI race.

Jeff Bezos on Risk-Reward Asymmetry: Why a 10% Chance of a 100x Payoff Is Always Worth the Investment
The modern investment landscape increasingly mirrors the asymmetric risk philosophy pioneered by Jeff Bezos. This strategy focuses on "optionality"—investing in high-variance opportunities where the cost of failure is fixed and low, while the potential for success is limitless. Amazon remains the primary case study for this approach. Its cloud division, AWS, began as an internal experiment and has evolved into a dominant market force. In the fourth quarter of 2025, AWS reported a 24% year-over-year revenue increase to $35.6 billion. This segment now operates at an annualized run rate of $142 billion, maintaining a massive 35% operating margin. The current market is defined by a massive "Capex explosion" as companies take bold bets on infrastructure. Amazon’s capital expenditures reached $125 billion in 2025, with projections climbing toward $150 billion for 2026. This spending is primarily directed at artificial intelligence and custom silicon, such as the Trainium2 and Graviton chips, which offer 40% better price-performance than traditional processors. Beyond the cloud, asymmetric bets are scaling in the aerospace and satellite sectors. Blue Origin successfully debuted its New Glenn heavy-lift rocket in early 2025 and is now planning the deployment of over 5,400 satellites for its TeraWave network. This initiative aims for data speeds of 6 Tbps, targeting high-capacity government and enterprise markets by 2027. Global technology spending is forecasted to grow 7.8% in 2026, reaching a total of $5.6 trillion. Data center systems alone are seeing growth rates above 23% as the industry shifts toward specialized AI hardware. Analysts note that while these investments squeeze short-term free cash flow—which dropped to $11.2 billion for Amazon in 2025—they provide the foundational infrastructure for the next decade of growth. The core of this philosophy is resilience through experimentation. By spreading risk across high-upside ventures like satellite internet, autonomous logistics, and AI-driven healthcare, organizations build a portfolio that can withstand individual project failures while capturing transformative market shifts. The shift toward "Agentic AI" and reasoning models represents the next frontier of this strategy. Decision-makers are moving away from general-purpose tools toward tailored, custom silicon architectures to gain a competitive edge. This reflects a broader trend where the most successful entities are those willing to fund uncertain, long-term innovations in pursuit of massive, non-linear returns. [Jeff Bezos: The Power of Asymmetric Bets](https://www.youtube.com/watch?v=7BW37SRnBnA) This video provides a deep dive into the specific mental models Bezos uses to evaluate risk and identify opportunities with limited downside. http://googleusercontent.com/youtube_content/0

Canara Bank to Raise Rs 5,000 Crore via Bonds
Canara Bank is set to tap the debt market on February 26, 2026, to raise up to 5,000 crore via Basel III-compliant Tier-2 bonds. This capital raise includes a base issue of 2,000 crore and a greenshoe option of 3,000 crore, aimed at supporting credit growth and maintaining a robust capital buffer. The lender enters this issuance from a position of financial strength. For the quarter ended December 2025, the bank reported a significant 25.6% year-on-year surge in net profit, reaching 5,155 crore. This growth was largely driven by a sharp 36% rise in non-interest income and a steady 1.1% increase in Net Interest Income, which stood at 9,252 crore. Operational metrics show a clear focus on credit expansion. Global advances increased by 13.6% year-on-year to 11.92 lakh crore, with the bank specifically targeting a 13% growth rate for the current fiscal. This expansion is heavily supported by the "RAM" sectors—Retail, Agriculture, and MSME—which witnessed a nearly 19% jump. Asset quality has improved significantly, reducing the bank's risk profile. The Gross Non-Performing Asset (GNPA) ratio dropped to 2.08% from 3.34% a year ago, while the Net NPA ratio improved to a healthy 0.45%. This recovery momentum has helped the bank maintain a high Provision Coverage Ratio of 94.19%. Capital adequacy remains well above regulatory requirements. As of December 31, 2025, the Capital to Risk Weighted Assets Ratio (CRAR) stood at 16.50%, with a Common Equity Tier-1 (CET-1) ratio of 12.37%. The new bond issuance will further strengthen these levels as the bank prepares for rising loan demand in a shifting interest rate environment. Market sentiment reflects this stability. Shares of Canara Bank recently traded around 157.15, marking a 5% gain over the past week. With a market capitalization of approximately 1.43 lakh crore and a price-to-earnings ratio of 7.7, the bank remains a key focus for institutional investors looking at the public sector banking space. The bank’s liquidity remains superior, supported by a 12.9% growth in global deposits to 15.21 lakh crore. This deep deposit franchise, coupled with a wide network of over 10,000 branches, provides the necessary scale to absorb fresh capital and deploy it efficiently across high-yield retail and agricultural portfolios.

Citigroup Hedge Fund Clients Trimmed Dollar Positions Following Supreme Court Tariff Ruling
Market Brief: Hedge Funds Pivot Following Tariff Ruling Citigroup's hedge fund clients recently moved to sell the U.S. dollar, following a landmark Supreme Court decision on Friday, February 20, 2026. The 6-3 ruling struck down President Donald Trump’s sweeping "Liberation Day" tariffs, which had relied on the International Emergency Economic Powers Act (IEEPA). The court determined that the administration had exceeded its authority, leading to immediate volatility in foreign exchange markets. The U.S. dollar experienced downward pressure shortly after the ruling as traders unwound "long" positions—bets that the currency would rise. Hedge fund activity saw a shift into other currencies, with the Australian dollar emerging as the most bought major pair. Emerging market currencies in Asia and Latin America also recorded notable inflows. Market indicators show the U.S. dollar index softened as investors reassessed the economic trajectory. As of February 24, 2026, the dollar is trading around 90.93 against the Indian rupee, down from early February highs above 91.60. Despite this selling pressure, Citigroup notes that overall positioning remains "moderately long" on the dollar, suggesting many investors are still holding onto the currency despite the recent legal setback for trade policy. In response to the ruling, the White House has already shifted strategy. President Trump announced a new 10% global tariff on most imported goods, utilizing Section 122 authority as a 150-day stopgap. This move aims to maintain trade protection while the administration prepares more permanent investigations. The persistence of these trade barriers has kept market sentiment tentative, as the legal pathway changes but the broader trend of protectionism remains intact. Broader financial markets have seen a mixed reaction. U.S. stock indices like the S&P 500 rose 0.7% following the ruling, while gold prices surged more than $100 over two days to trade near $5,182 per ounce. This flight to safety reflects ongoing uncertainty regarding the $175 billion in potential tariff refunds the U.S. government may now owe importers. Economic data continues to influence the landscape alongside trade news. Recent figures show U.S. GDP growth for the fourth quarter slowed to 1.4%, significantly below the 2.8% estimate. Meanwhile, core inflation remains sticky at 3%, complicating the Federal Reserve’s path. Governor Christopher Waller recently indicated that while tariff effects should be viewed separately, the Fed remains prepared to support a 25-basis-point rate cut in March if the labor market shows further signs of weakening.

Indian Bond Prices Rise Amid Strong State Debt Demand
Indian government bonds gained momentum on Tuesday, February 24, 2026, as robust buying interest drove yields lower across the curve. The rally was primarily concentrated in longer-duration securities, fueled by optimistic projections for the upcoming fiscal year. The benchmark 10-year bond yield eased to 6.67%, dropping from the previous session's close of 6.72%. This movement reflected a broader cooling of yields as market participants reacted to favorable domestic supply dynamics and stabilized global cues. A key catalyst for the day's performance was a high-demand auction for state development loans. Sixteen Indian states successfully raised 461 billion rupees, surpassing the initial target of 445.50 billion rupees. Despite the higher volume, cut-off yields for most states remained lower than market expectations, signaling strong institutional appetite. Investor sentiment remains bolstered by expectations of reduced long-term debt issuance in the next fiscal year. Market participants are positioning for a lighter supply of longer-maturity notes, which has incentivized insurance companies and pension funds to increase their holdings at current levels. The Reserve Bank of India also played a vital role in stabilizing the environment. The central bank recently maintained the repo rate at 5.25% with a neutral stance, emphasizing a "wait and watch" approach. This stability, paired with a surplus in banking system liquidity of nearly 3 trillion rupees, has provided ample funds for banks to replenish their portfolios. Global factors added a layer of support as U.S. Treasury yields softened, making domestic debt relatively more attractive. While geopolitical tensions and oil price volatility remain on the radar, the immediate focus is on the federal government’s upcoming sale of 320 billion rupees in benchmark bonds scheduled for later this week. Traders expect the 10-year benchmark to trade within a range of 6.65% to 6.78% in the near term. The focus now shifts to final inflation data and the conclusion of the current fiscal year’s borrowing calendar in March, which continues to shape favorable demand-supply dynamics for the sovereign debt market.

Srijan Realty Enters Organized Fashion Retail with Rs 500 Crore Investment Plan over 4 Years
Kolkata-based real estate leader Srijan Group has officially entered the organized fashion retail sector. This strategic move marks a significant diversification for the group, shifting focus toward India’s rapidly expanding consumption and apparel markets. The company has launched its new retail vertical under the brand Srijan Style. This venture is backed by a committed initial investment of over 500 crore rupees, which will be deployed over the next 3 to 4 years. The funding for this expansion is being managed entirely through internal accruals. Srijan Style aims to establish itself as a national chain with a primary focus on Tier 2, Tier 3, and Tier 4 markets. These regions are currently witnessing a surge in disposable income and a growing demand for formal retail experiences. The group is positioning the brand as a family destination, focusing on high-efficiency retail formats and affordable fashion. The immediate rollout plan is aggressive. The company intends to open 10 stores within the first quarter of the year. By the end of the 2026-27 fiscal year, the goal is to reach a total of 50 operational stores. The initial phase of growth is concentrated in Eastern India, with a flagship store planned for Gariahat in South Kolkata. Additional outlets are scheduled for West Bengal locations, including Asansol, Serampore, and Sodepur. In the long term, the group envisions a massive pan-India footprint of 1,000 stores. Each outlet will average approximately 8,000 square feet to optimize inventory and store-level profitability. The merchandise strategy targets high-volume categories. Product pricing is set between 99 and 1,999 rupees, with the majority of items priced below 999 rupees. This approach aims to capture the value-conscious segment of the Indian apparel market. The move comes at a time of significant growth for the industry. The Indian apparel retail market is projected to reach approximately 108 billion dollars by the end of 2026. Experts indicate that organized value fashion currently accounts for 15 percent of the market, with expectations to grow to 35 percent by 2030. Srijan Group’s expansion follows other major corporate milestones. The group recently finalized a 670 crore rupee acquisition of a technology park and land parcel in Kolkata from DLF. This highlights the company's dual strategy of strengthening its real estate portfolio while aggressively pursuing new revenue streams in the retail economy. This video provides an in-depth analysis of the current trends in the Indian fashion retail market. [Market update: Srijan Group enters fashion retail](https://www.youtube.com/watch?v=jHRdGvVdgHI) http://googleusercontent.com/youtube_content/0

Tata Investment Shares Fall 3% Following Deferral of Tata Sons Leadership Reappointment Discussions
Tata Investment Corporation shares experienced a sharp decline on Tuesday, dropping over **3%** to trade near **₹667** on the National Stock Exchange. The stock saw significant volatility, fluctuating between an intraday high of **₹685.30** and a low of **₹663.15**. This downward movement follows a period of heightened activity where the market capitalization stood at approximately **₹34,819 crore**. The primary driver for this slump is the reported friction within the Tata Sons board. Executive Chairman N Chandrasekaran requested a postponement of discussions regarding his reappointment for a third term. This request came after disagreements surfaced during a high-stakes board meeting held on Tuesday. Tata Trusts Chairman Noel Tata raised critical concerns regarding the financial performance of the group’s newer ventures. Specifically, he highlighted losses stemming from high-profile acquisitions and digital platforms, including Air India and BigBasket. Noel Tata reportedly outlined four specific conditions for the Chairman’s extension, emphasizing debt reduction and the containment of losses in these "new-age" businesses. While other board members supported Chandrasekaran, attributing the losses to the natural gestation period of greenfield investments, the Chairman opted for deferment. He stated that the institution must move forward with a unified decision between Tata Sons and Tata Trusts. Chandrasekaran’s current term is not set to expire until February **2027**. However, the proposal for a third five-year term would extend his leadership until **2032**. Such an extension would require a special resolution, as it involves a waiver of the group's traditional retirement age of **65** for non-executive roles. Chandrasekaran will turn **63** this June. Investors are closely watching these developments as they signal potential shifts in capital allocation and governance. Despite the recent dip, Tata Investment Corporation has shown resilience over the past year, supported by a **1:10** stock split in late **2025** aimed at boosting retail liquidity. The company recently reported a net profit of **₹75 crore** for the third quarter, a substantial jump from **₹20 crore** in the previous year. However, the current leadership uncertainty at the holding company level continues to weigh on the stock's immediate sentiment. Clearer alignment between the Trusts and the Board will be essential to stabilizing the market outlook.

Natco Pharma and Eris Lifesciences Partner to Launch Semaglutide in India
Shares of **Natco Pharma** and **Eris Lifesciences** surged on Tuesday, February 24, 2026, following the announcement of a strategic partnership to commercialize **Semaglutide** in the Indian market. The collaboration aims to leverage Natco’s manufacturing and regulatory capabilities alongside Eris's extensive commercial reach in the diabetes and metabolic care segments. Natco Pharma recently secured approval from the Central Drugs Standard Control Organization (**CDSCO**) to manufacture the generic version of the blockbuster GLP-1 drug, which is widely used for Type 2 diabetes and chronic weight management. Market Reaction and Price Action The announcement triggered a strong rally in both stocks during Tuesday's trading session: * **Natco Pharma:** Shares jumped **5.8%** to reach **₹944.75** on the NSE. This marked the stock's highest level since early January, with heavy trading volumes exceeding **10.3 million** shares. * **Eris Lifesciences:** The stock climbed **2.83%** to finish at **₹1,391.00**, extending its winning streak to a third consecutive session. The Semaglutide Opportunity The partnership is timed to capitalize on the patent expiry of the innovator molecule in India, scheduled for **March 2026**. Generic entry is expected to drastically reduce treatment costs. While innovator brands currently retail between **₹8,800** and **₹11,175** per month, market estimates suggest generic versions could eventually retail for approximately **₹5,000**, making the therapy accessible to India's vast middle-class population. Sector Outlook The Indian GLP-1 receptor agonist market is projected to grow at a **19.1% CAGR** from 2026 to 2033, potentially reaching a revenue of **$730.8 million**. India currently houses approximately **135 million** pre-diabetic adults and is the world’s largest sugar consumer. The shift toward more affordable, locally manufactured Semaglutide is seen as a major catalyst for the domestic pharmaceutical sector, as firms like Natco and Eris position themselves to lead the next generation of metabolic care. Eris has invested nearly **₹4,000 crore** over the last three years to strengthen its chronic therapy portfolio, including its recent acquisition of Biocon’s domestic branded formulations business. For Natco, the deal provides a high-volume commercial outlet for its complex generic pipeline.

Eternal Shares Fall 6% Amid Broad Market Sell-Off
Eternal Market Update Shares of **Eternal Limited** faced intense selling pressure today, February 24, 2026, dropping **5.28%** to close at **₹254**. This sharp decline positions the stock as a primary drag on the Sensex, which struggled to maintain momentum amidst a volatile session. The stock reached an intraday low of **₹251.80**, marking a significant retreat from its 52-week high of **₹368.45**. Technical indicators confirm a weakening trend as the price has slipped below key short-term and long-term benchmarks. Eternal is currently trading below its **50-day EMA of ₹285** and its **200-day EMA of ₹278**, signaling a bearish crossover. The relative strength index (RSI) has dipped toward **41**, reflecting a shift in investor sentiment from optimistic to cautious. Q3 Performance and Growth Engines Despite the current market correction, the company’s Q3 FY26 earnings revealed significant operational scale. Consolidated revenue surged **201% year-on-year** to **₹16,315 crore**, while net profit grew **73%** to reach **₹102 crore**. Much of this top-line jump is attributed to a structural shift in the quick commerce accounting model. **Blinkit** continues to serve as the primary growth driver. The quick commerce arm achieved a critical milestone by reaching **Adjusted EBITDA breakeven** for the first time with a profit of **₹4 crore**. The segment added **211 stores** during the quarter, bringing the total network to **2,027 dark stores**. Management remains committed to a target of **3,000 stores** by March 2027. The food delivery vertical remains a stable contributor to the bottom line, with a net order value growth of **17%**. However, the **Going-out** segment reported widened losses of **₹121 crore** as the company aggressively invests in its new "District" platform and live events. Market Sentiment and Outlook Investor sentiment has been dampened by recent leadership changes. The transition of founder Deepinder Goyal from Group CEO to Vice Chairman on February 1, 2026, has introduced near-term uncertainty. The stock has now declined roughly **23%** from its October peaks. While analysts maintain a long-term bullish outlook with targets near **₹340**, immediate pressure persists due to rising competition in the instant delivery space and broader macro headwinds affecting the high-valuation tech sector. Current support is anticipated in the **₹240–₹250** zone. A failure to hold these levels could invite further technical selling toward the **₹230** mark. Conversely, a sustained move back above **₹280** is required to invalidate the current bearish setup.
HSBC Analysis of the Structural Relationship Between Artificial Intelligence and the Software Sector
Market Brief: The AI Integration Shift Enterprise software is undergoing a fundamental transformation as Artificial Intelligence shifts from a standalone tool to a core, embedded layer. Recent data indicates that the "AI-as-a-layer" model is stabilizing the sector, with total global AI spending projected to reach $2.5 trillion in 2026, a 44% increase year-over-year. Legacy software giants are emerging as primary winners in this transition. Major providers like Salesforce, Oracle, and Microsoft are successfully integrating "agentic AI" into their existing ecosystems. These autonomous agents handle high-value tasks that were previously difficult to automate, such as complex research and service-desk management. The software sector is currently navigating a period of valuation correction. The S&P 500 Software & Services Index has seen significant volatility, recently trading down 12.6% over a one-month period as of late February 2026. However, demand remains robust, with large enterprises leading the charge. Approximately 59% of IT professionals at large firms have confirmed active AI deployment. Market trends suggest AI is becoming a supporting infrastructure rather than a replacement for enterprise platforms. This "subordinated AI" approach reduces risks like non-deterministic errors by keeping intelligence within the guardrails of proven software stacks. This method is driving a massive increase in AI inference demand, justifying the global expansion of data centers. Cloud solutions remain the dominant delivery model, accounting for over 71% of the AI market share. Meanwhile, the generative AI software segment is expanding at a 29% compound annual growth rate. This growth is increasingly fueled by specialized, domain-specific tools rather than broad, general-purpose models. Industry sentiment is shifting from "AI euphoria" to a focus on operational efficiency. While 88% of organizations now use AI in at least one business function, only about one-third have scaled these programs across the entire enterprise. This gap provides a significant runway for legacy vendors to expand their footprint as they roll out mature, embedded agents to their global customer bases. Strategic independence and "Sovereign AI" are also becoming priorities, with more companies factoring a solution’s country of origin into their vendor selection. This ensures that AI deployment remains compliant with local laws and infrastructure, further cementing the role of established software providers who have existing trusted relationships and robust compliance frameworks in place.
Indian Rupee Declines Amid Equity Weakness and NDF Maturities as RBI Intervention Limits Losses
Indian Rupee Market Brief: February 24, 2026 The Indian rupee faced downward pressure during Tuesday's trading session, closing lower at **90.87** against the US dollar. The currency remains caught between conflicting forces as global trade policy shifts and domestic equity sell-offs dictate market sentiment. Renewed uncertainty regarding US trade policy has weighed heavily on emerging market assets. Markets are currently digesting a series of tariff adjustments following a US Supreme Court ruling, with a temporary **15%** levy on various imports causing concern. While India's effective tariff rate is projected at a more favorable **11% to 13%** compared to regional peers, the broader climate of unpredictability has spurred dollar demand. Equity Market Drag The domestic equity market experienced a significant downturn, which directly impacted the rupee’s performance. The BSE Sensex plunged by **1,068.73** points to end at **82,225.92**, while the Nifty 50 dropped **288.35** points to settle at **25,424.65**. A sharp **4.74%** crash in the Nifty IT index was a primary driver for the sell-off. Concerns over automation and shifts in the global labor-arbitrage model led to heavy selling in major technology stocks. This sparked an outflow of capital as foreign investors turned cautious, increasing the local demand for the greenback. Central Bank and Reserves The Reserve Bank of India (RBI) continued its strategy of active intervention to prevent excessive currency volatility. Despite the rupee’s slip toward the **91** level, central bank actions helped cap deeper losses. India’s foreign exchange reserves remain a robust buffer, currently standing at **$725.7 billion**. This high level of reserves provides the RBI with significant ammunition to manage sharp fluctuations, even as the national trade deficit for January widened to **$34.7 billion**. Global Factors External pressures remain elevated as Brent crude oil prices hovered near **$72** per barrel. As a major oil importer, rising energy costs put additional strain on India's trade balance and the value of the rupee. The US Dollar Index (DXY) showed signs of resilience, trending toward the **98** mark. This strength, coupled with strong dollar demand in the non-deliverable forwards (NDF) market, created a challenging environment for local currency gains. Investors are now looking toward upcoming domestic GDP data and the evolving trade relationship with Washington to determine the rupee's trajectory in the coming weeks.

Indian Investors Gain Direct Access to Global Metals and Mining Stocks
Market volatility has intensified as of **February 24, 2026**, driven by a combination of shifting trade policies, stubborn inflation data, and heightened geopolitical tensions in the Middle East. Global equities are under pressure as investors recalibrate expectations for interest rate cuts following a recent string of economic reports. Equity Markets and Indices The major Wall Street indices have retreated sharply. The **Dow Jones Industrial Average** fell **1.66%** to close at **48,804**, while the **S&P 500** declined **1.04%** to **6,837**. The tech-heavy **Nasdaq Composite** also finished lower, shedding **1.13%** to end the session at **22,627**. Sentiment was further dampened by a **10%** surge in the **VIX**, which reached **21.01**, signaling increased fear among market participants. In Europe, the **DAX** in Germany dropped **1.06%**, even as manufacturing data showed its first expansion since 2022. Conversely, the **Hang Seng** in Hong Kong provided a rare bright spot, gaining **2.53%** as Chinese traders returned from the Lunar New Year holiday. Inflation and Interest Rates Recent macro data has complicated the path for monetary policy. The **Core PCE inflation** rate rose to **3.0%**, exceeding the previous **2.8%** and moving further from the Federal Reserve's target. Simultaneously, **Q4 GDP** growth slowed significantly to **1.4%** on an annualized basis. This "stagflationary" signal has led markets to price out a spring rate cut. The **Federal Reserve** held interest rates steady in the **3.5% to 3.75%** range during its last meeting. Current projections now suggest the first potential reduction may not arrive until **July 2026**, as policymakers wait for clearer evidence of cooling prices. Commodities and Digital Assets Commodity markets are reacting to the "risk-off" environment. **Gold** has surged **2.35%** to **$5,227** per ounce, hitting its highest level in weeks as investors seek safety amid trade uncertainty. **Crude Oil (WTI)** has also climbed, rising to **$66.51** per barrel, supported by a risk premium related to military assets moving into the Middle East. In the digital asset space, **Bitcoin** has struggled to maintain momentum. The cryptocurrency fell to a two-week low near **$64,000** before stabilizing. Analysts point to **ETF outflows** and a general lack of conviction-driven buying as the primary factors keeping prices below the **$67,000** resistance zone. Technology and Sector Trends The technology sector is undergoing a transition from hype to practical application. Industry forecasts for **2026** suggest a shift toward "Cloud 3.0," where cloud infrastructure is being redesigned as the operational backbone for sovereign and private AI systems. In India, the tech sector is projected to grow by **6.1%** this fiscal year, reaching **$315 billion** in revenue. While hiring in traditional software services has slowed, demand for specialized AI-led services and automotive camera modules—critical for autonomous driving—continues to expand, with the latter market entering a decade-long transformation.

IDFC First Bank Shares Edge Up 3% Following Refund of Rs 556 Crore to Haryana Government
Market Brief: IDFC First Bank Recovery and Performance IDFC First Bank shares experienced significant volatility today, February 24, 2026, following critical updates regarding a fraud case involving Haryana government-linked accounts. The stock managed a partial recovery, trading around **70.80** after a sharp **16%** slump in the previous session. Intraday movement saw the scrip hit a low of **68.50** before momentum shifted. High trading activity was recorded with a volume of over **5.79 crore** shares, reflecting a traded value of approximately **405.76 crore**. This liquidity spike came as investors reacted to confirmation of fund recovery. Fraud Recovery and Government Action Haryana Chief Minister Nayab Singh Saini informed the State Assembly today that the government has successfully recovered nearly **556 crore**, including **22 crore** in interest. The recovery was processed within **24 hours**, significantly easing immediate concerns over capital loss. The incident was localized to a single branch in Chandigarh and involved four to five middle-and-lower-rung employees. These individuals allegedly colluded with external parties to process forged physical cheques. The bank has officially clarified that no digital breach occurred and the issue is confined to this specific account cluster. Financial Safeguards and Outlook IDFC First Bank has paid **100%** of the principal and interest, totaling **583 crore**, to the Haryana Government departments. Despite this payout, the bank maintains that it will remain profitable. Management has indicated that provisions will be taken, supported by an employee-fraud insurance cover of up to **35 crore**. To ensure transparency, the bank appointed KPMG to conduct an independent forensic audit, expected to conclude within four to five weeks. Four officials have been suspended, and a police FIR has been filed to pursue criminal action against all involved parties. Sector Context and Indicators The broader banking sector remains robust, with the Nifty Bank index rising **1.64%** recently. While IDFC First Bank faces specific headwinds, its fundamentals as of late 2025 showed a Capital Adequacy Ratio of **16.22%** and a CASA ratio of approximately **50%**. The bank's current market capitalization stands near **60,000 crore**. Investors are now focusing on the forensic audit results and the bank's ability to maintain its **5.76%** Net Interest Margin amidst these localized operational challenges.

Sify Infinit Seeks $4.2 Billion Valuation in India IPO
Sify Infinit Spaces is preparing to launch India’s first pure-play data center initial public offering. The company is reportedly seeking a valuation of up to 4.2 billion USD as it begins investor meetings this month. The 37 billion rupee offering is structured to support massive infrastructure expansion. It consists of a fresh issue of shares worth 25 billion rupees and a secondary sale of 12 billion rupees from existing investors, including the Kotak Data Center Fund. This capital influx is vital for the company’s ambitious roadmap. Approximately 13.25 billion rupees are earmarked for completing data center towers in Chennai and Navi Mumbai. Additionally, 6 billion rupees will be used to reduce existing debt, which stood at 27.39 billion rupees as of mid-2025. The parent company, Nasdaq-listed Sify Technologies, has seen significant market movement recently. Its share price reached a 52-week high of 17.85 USD, reflecting growing global interest in Indian digital infrastructure. While the parent group has faced profitability hurdles, Sify Infinit remains a profitable entity, reporting a net profit of 1.26 billion rupees for fiscal 2025. Operational metrics show a strong reliance on high-scale clients. Hyperscalers currently contribute 67.81% of total revenue. As of June 2025, the company operates 14 facilities across six major cities, providing a total IT power capacity of 188.04 megawatts. Market tailwinds are driving this aggressive valuation. India’s data center sector is projected to grow from 9.79 billion USD in 2025 to over 21 billion USD by 2031. This expansion is fueled by a 33% annual growth rate in AI-ready capacity and government mandates on data localization. Major global players like Microsoft and Google have already committed billions to the Indian market, validating the sector’s potential. Sify Infinit is positioning itself at the center of this boom by certifying its newest facilities for high-density AI workloads using advanced liquid cooling technologies. Investors are closely watching this IPO as a benchmark for the industry. If successful, it will set the valuation standard for other Indian data center operators looking to tap into public markets. The offering provides a direct avenue for backing the physical infrastructure that powers India’s rapidly evolving digital economy.

Zinc Market Outlook: Analyzing Post-Surge Consolidation and Strategic Entry Points
Zinc prices are demonstrating resilience as of February 24, 2026, with the Multi Commodity Exchange (MCX) witnessing a 2% climb to **Rs 332** per kilogram. This upward movement is mirrored on the London Metal Exchange (LME), where futures are trading near a three-year high of **$3,403** per tonne. The rally is fundamentally driven by a tightening supply chain. Global exchange inventories have seen significant depletion, with LME stocks currently hovering around **103,500 tonnes**, down from over **230,000 tonnes** at the start of last year. This low-stock environment is compounded by persistent mine disruptions and smelter output curbs in key regions such as Japan and Kazakhstan. In the domestic market, the tone remains positive as zinc outperforms other base metals like copper. Technical indicators suggest that the current momentum is sustainable as long as prices remain above the critical support level of **Rs 322**. Analysts anticipate a fresh surge in trading volume and price action as Chinese markets fully resume operations following recent holiday closures. Demand remains anchored by the global push for electrification and substantial investments in data center infrastructure. These sectors are offsetting broader macroeconomic headwinds, maintaining steady consumption for galvanizing processes. While mine output is projected to grow by **2.4%** later this year, the immediate market remains characterized by a supply deficit and low treatment charges. Market participants are currently focused on the upcoming "Two Sessions" meeting in China for cues on further economic stimulus. Any policy shifts regarding infrastructure or the property sector are expected to provide additional tailwinds for the metal. For now, the prevailing strategy among traders continues to favor "buy-on-dips," supported by the metal's strong position above major moving averages.
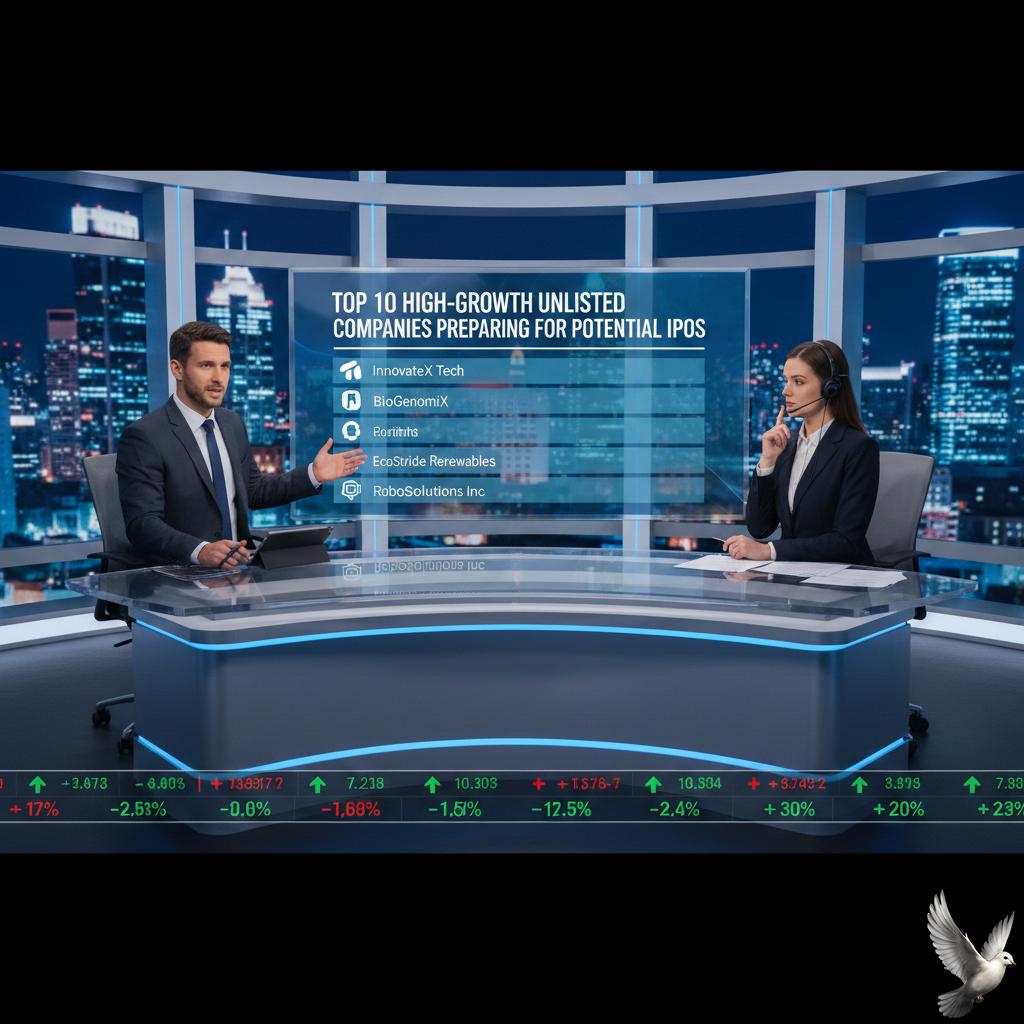
Top 10 High-Growth Unlisted Companies Preparing for Potential IPOs
India’s unlisted corporate sector has reached a historic scale, with the top 100 private giants generating a staggering ₹8.9 lakh crore in combined revenue during 2025. This massive financial engine is now fueling a robust IPO pipeline that is projected to exceed ₹2.5 lakh crore in total fundraising throughout 2026. Reliance Retail holds the definitive top spot as the country's largest unlisted company. It reported a massive annual revenue of ₹2.7 lakh crore for 2025, supported by an expansive footprint of over 19,300 stores. The retail powerhouse achieved an EBITDA of ₹25,094 crore, reflecting an 8.6% year-on-year growth. Flipkart follows as a primary contender in the e-commerce space, recording ₹83,105 crore in revenue for the recent fiscal year. The company has significantly narrowed its losses and is actively shifting its domicile to India to prepare for a public debut. Analysts estimate Flipkart’s potential valuation between $60 billion and $70 billion. The financial landscape is also dominated by the National Stock Exchange (NSE), which remains the most valuable unlisted entity with an estimated market valuation of ₹4.7 lakh crore. Other key players include Serum Institute of India, valued at ₹2.1 lakh crore, and tech-leader Zoho Corporation, which maintains a valuation of approximately ₹1.04 lakh crore. Sectoral shifts show that traditional retail is now being joined by new-economy leaders. Tata Electronics reported revenues of ₹66,601 crore, while the electric vehicle arm, Tata Passenger Electric Mobility, clocked ₹15,247 crore. Fintech giants like PhonePe are also advancing, with a planned $1.5 billion IPO targeting a valuation of up to $15 billion in 2026. Investor sentiment remains high after a record-breaking 2025, which saw 93 mainboard IPOs raise over ₹1.76 lakh crore. While retail participation has moderated, domestic mutual funds have emerged as a dominant force, overtaking foreign portfolio investors in anchor allocations. The upcoming wave of listings is expected to transition from speculative growth stories to mature, profitable enterprises. With over 190 companies currently in the regulatory pipeline, the focus has shifted toward firms with transparent governance and clear paths to profitability.

NBFC Earnings Premium Moderates Requiring Selective Investment Approach
Market Overview: NBFC Sector Outlook 2026 The Non-Banking Financial Company (NBFC) sector is entering a high-stakes phase as 2026 unfolds. While credit growth remains robust, the premium that NBFCs once held over traditional banks is narrowing. Investors are currently prioritizing selective positioning as valuations remain elevated and margin pressures intensify across the board. Industry assets under management (AUM) are on a trajectory to cross the ₹50 lakh crore milestone by March 2027. Despite this scale, the sector is navigating a complex landscape of tighter regulations and shifting profitability. The era of easy growth is being replaced by a focus on diversified liability franchises and digital efficiency. Growth and Credit Performance NBFC credit expansion is projected at 15–17% for FY26, consistently outpacing the 12–13% growth seen in the banking system. Total NBFC credit is expected to expand by up to ₹2.4 trillion this year alone. However, this growth is increasingly uneven across sub-sectors. Gold loans and vehicle finance are emerging as the primary engines of momentum. Gold loan providers are seeing AUM growth as high as 30–35% as they formalize unorganized market shares. Meanwhile, vehicle finance remains a structural stronghold, expected to maintain 16–17% growth through 2027, driven by GST-related demand and a rising used-vehicle market. Margin Pressures and Valuation Risks Profitability is under scrutiny as Net Interest Margins (NIM) face headwinds. Systemic NIMs for NBFCs currently hover around 6.6%, but the cost of funds remains high. While recent repo rate cuts in late 2025 provided some relief, the benefits are only expected to fully manifest in the latter half of 2026. Valuations for large NBFCs continue to command a premium, yet the earnings growth gap over banks is shrinking. This has led to a "guarded" market bias. In the recent trading week ending February 20, 2026, financial stocks helped the Sensex recover to 82,814.7, but volatility remains high as institutional investors weigh the risks of margin compression against high entry prices. Regulatory and Digital Transformation The Reserve Bank of India (RBI) is tightening the screws with new frameworks effective in 2026. Stricter co-lending rules now mandate a 10% risk retention for all partners and enforce a 15-day settlement window. Furthermore, new gold loan guidelines effective April 2026 will require detailed credit assessments for loans exceeding ₹2.5 lakh, ending the era of simplified processing for large tickets. Digital lending is no longer a peripheral trend but the core driver of sector evolution. Digital-first NBFCs are projected to see personal loan portfolios grow at a CAGR of 26–28% through 2030. Success is increasingly tied to AI-powered "real-time" underwriting, which can reduce disbursement times by 50% and lower operational costs. Strategic Positioning Larger, diversified NBFCs with strong liability advantages are best positioned to withstand current pressures. Smaller players remain heavily dependent on bank funding, making them vulnerable to liquidity shifts. The market is rewarding entities that can leverage "RegTech" for automated compliance and those shifting toward secured retail assets. Affordable housing finance remains a key pocket of resilience, growing at 22–23%, supported by government interest subsidies and a focus on ticket sizes below ₹25 lakh. [Financial Sector Outlook 2026](https://www.youtube.com/watch?v=tBvstdNcrvw) This analysis provides expert commentary on the bottoming of margins and the specific NBFC segments poised to lead the next credit cycle. http://googleusercontent.com/youtube_content/0

Nikkei Gains on AI Strength While China Export-Linked Stocks Trade Mixed
Japan’s stock market demonstrated significant resilience on Tuesday, February 24, as the Nikkei 225 surged following a long holiday weekend. The index gained 571 points, closing 1.00% higher at 57,396. This rally effectively erased losses from previous sessions, driven by a powerful rebound in technology and infrastructure-related shares. Investor sentiment was primarily buoyed by reports of a strategic evolution in the partnership between Nvidia and OpenAI. The two AI giants are reportedly finalising a 30 billion dollar investment deal. This arrangement, which positions Nvidia as a key participant in OpenAI’s latest massive fundraising round, has reignited expectations for sustained capital flows into global AI infrastructure. Japanese tech leaders capitalized on this momentum. Advantest, a critical supplier in the semiconductor testing space, saw its shares rise 4.5%. Kioxia Holdings recorded an 8.3% jump, while Fujikura surged 11.16%. These gains highlights a broader "risk-on" shift in Tokyo, even as Wall Street faced volatility from geopolitical concerns and shifting trade policies. Beyond the AI sector, industrial and manufacturing stocks posted standout performances. Furukawa Electric led the market gainers with a 15.83% increase, and Murata Manufacturing rose 9.06%. These moves reflect a robust domestic outlook, supported by recent data showing Japanese machinery orders rising at a record pace. Economic indicators provide a stabilizing backdrop for the current market trajectory. Japan’s GDP growth accelerated to 0.7% in the final quarter of last year, while the manufacturing PMI for February 2026 showed marginal improvement to 48.9. Although inflation rose to 4.0% in January, the market remains focused on corporate resilience and the potential for increased dividends and share buybacks. The yen's movement remains a critical variable for export-oriented firms. While recent appreciation caused brief corrections in late January, the Nikkei has maintained an upward bias throughout February. Analysts point to a 38% rise in the market over the past 12 months, with annual earnings in the tech sector forecasted to grow by 16% over the next five years. Market participants continue to monitor external factors, including United States trade rulings and geopolitical tensions in the Middle East. However, the immediate focus remains on the semiconductor and AI sectors, which are increasingly viewed as the primary engines for Japan’s continued equity growth in the 2026 fiscal year.