Bullish News
Collection
Larsen & Toubro and Five Other Stocks Reach 52-Week Highs Following Monthly Gains of Up to 16%
Market Brief: Large-Cap Momentum Benchmark indices maintained their upward trajectory on Wednesday, February 18, 2026, as the Sensex advanced 283 points to settle at 83,734. The Nifty 50 also climbed 0.35%, closing at 25,819. This steady performance marks the third consecutive session of gains for the Indian markets. Amid this broader upswing, six heavyweights within the BSE 100 index surged to hit fresh 52-week highs. Strong institutional interest and a shift toward defensive and industrial sectors have fueled this large-cap rally. Industrial Leaders Hit Record Highs Larsen & Toubro emerged as a primary driver, hitting an all-time high of 4,335 during intraday trade. The construction major has delivered a 12% gain over the last month and currently boasts a market capitalization of 5,88,693 crore. Technical indicators show the stock trading comfortably above all its major moving averages. Cummins India recorded a sharp move to a new peak of 4,786.4. The stock has outperformed its sector with a 16% jump in just 30 days. Rising delivery volumes—up 27% recently—suggest sustained buying rather than short-term speculation. Broad-Based Participation Several other key players across diverse sectors reached significant milestones during the session. Indus Towers climbed to a fresh 52-week high of 480.7, supported by a 10% gain over the past month. JSW Steel followed suit, touching 1,264.55 as metal stocks saw renewed demand following global trade signals. In the consumer and auto segments, Bajaj Auto breached the 10,000 mark for the first time, hitting a high of 10,005.9. FMCG major Marico also joined the list of top performers, reaching a peak of 798.6. Sectoral Trends and Indicators The rally was notably led by metals, PSU banks, and FMCG stocks. The Nifty PSU Bank index touched a record high of 9,647 during the day. This strength helped offset continued weakness in the IT sector, which has faced selling pressure due to shifting global technology trends. Market breadth remained positive, with the Nifty Midcap 100 and Smallcap 100 both rising over 0.40%. Domestic institutional investors continue to provide a cushion to the market, with net purchases of 1,667 crore in recent sessions, balancing out intermittent foreign fund outflows. Foreign institutional investors remained net sellers of approximately 972 crore, but the aggressive domestic buying in large-cap heavyweights has kept the benchmark indices resilient near their psychological peaks.

Indian Sovereign Bonds Gain Following Robust Demand at State Debt Auction
Indian government bonds extended their positive momentum this week, supported by robust demand for state debt and favorable liquidity conditions. Market sentiment was bolstered by a successful State Development Loan (SDL) auction where states raised 394.50 billion rupees ($4.35 billion). The auction saw cut-off yields fall below market expectations for the second consecutive week, reflecting strong appetite for sovereign and quasi-sovereign papers. This demand has helped stabilize the yield curve following a period of volatility in early 2026. The benchmark 10-year government bond yield is currently hovering around 6.67% to 6.68%. While yields briefly rose during Wednesday’s session, they remain near three-week lows. The 6.48% 2035 bond recently settled at a yield of 6.66%, marking a decline of approximately 11 basis points over the last six trading sessions. Liquidity remains a primary driver for the bond market's performance. The banking system is currently operating with a significant liquidity surplus, averaging 2.70 trillion rupees daily throughout February. This surplus, comfortably exceeding 1% of total bank deposits, has pushed overnight lending rates lower and encouraged banks to deploy funds into government securities. External factors are also providing a supportive tailwind. U.S. Treasury yields have trended downward, with the 10-year U.S. yield cooling to 4.03% following slower-than-expected retail inflation data. This narrowing of global yields has increased the relative attractiveness of Indian debt, particularly as foreign portfolio investors (FPIs) return to the market. After record selling in January, FPIs turned net buyers in early February, infusing over 8,100 crore rupees into the financial markets. This shift in capital flows is largely attributed to a stabilizing rupee—currently trading near 90.68 against the dollar—and the recent announcement of an Indo-US trade deal. The Reserve Bank of India’s proactive stance has further anchored the market. Through a series of debt-switch operations and open market purchases totaling nearly 4 trillion rupees between late 2025 and early 2026, the central bank has effectively managed redemption pressures and reduced the gross borrowing burden for the upcoming financial year. Despite the recent rally, some disconnect remains as the 10-year yield stays elevated relative to the repo rate, which was held steady at 5.25% in the February policy meeting. However, with headline inflation projected to remain muted at 2.1% for the 2025-26 fiscal year, the outlook for the bond market remains cautiously optimistic as investors eye further stabilization in borrowing costs.

Neelkanth Mishra: India Potential Beacon of Stability Amid Global Volatility
**India Market Brief: February 2026** India continues to cement its position as a pillar of global economic stability. Amid international fragmentation, the nation’s commitment to fiscal discipline and open-market policies is successfully attracting a broad base of global partners and institutional capital. **Macroeconomic Indicators** The Reserve Bank of India has maintained the policy repo rate at 5.25% as of February 2026. This decision follows a neutral stance designed to balance strong growth with benign inflation. Real GDP growth for the 2025-26 fiscal year is estimated at a robust 7.4%. Inflation remains well-managed, with headline CPI projected at 2.1% for the current fiscal year. Fiscal consolidation is also a high priority, with the government setting a deficit target of 4.3% for the 2026-27 period, down from 4.4% in the previous year. **Equity Market Performance** Domestic stock markets are reflecting this stability through consistent gains. As of February 18, 2026, the BSE Sensex settled at 83,734.25, while the NSE Nifty 50 closed at 25,819.35. Market sentiment is buoyed by steady asset quality in the banking sector and a late-session surge in metal and FMCG shares. While the IT sector has seen some volatility due to global margin pressures, the broader market indices—including midcap and smallcap—have outperformed, rising 0.5% in recent sessions. **Sectoral Drivers: Real Estate and Power** Private investment is seeing a significant revival, particularly in infrastructure and housing. The real estate sector is transitioning toward sustainable and premium assets. Notably, warehousing has emerged as a high-conviction asset class, often outperforming traditional office spaces due to the expansion of e-commerce and logistics networks. The power sector is another critical growth engine. India’s installed capacity reached 505 GW by late 2025. There is an estimated investment opportunity of 40 lakh crore over the next decade. Renewable energy is leading this charge, with a record 20.1 GW of capacity added in the first half of the current fiscal year. **Investment Outlook** A strong domestic demand base and increased capital expenditure are fueling a durable growth runway. Foreign institutional investors remain active, recently purchasing equities worth over 995 crore in a single day. Government focus on ease of doing business and infrastructure creation, supported by a budgeted capital outlay of 12.22 lakh crore for the coming year, provides a clear roadmap for long-term investors. India’s transition toward a debt-to-GDP ratio of 55.6% further reinforces its reputation for macroeconomic prudence.

Key Stocks in Focus on Wednesday: E2E Networks, Godfrey Phillips, and Others
Indian equity markets maintained positive momentum on February 18, 2026, marking a third consecutive session of gains. The BSE Sensex rose **283.29 points** (0.34%) to finish at **83,734.25**, while the NSE Nifty 50 climbed **93.95 points** (0.37%) to close at **25,819.35**. Trading was characterized by a late-session surge. While IT stocks faced pressure due to concerns over industry-wide disruption, metals and state-owned banks provided significant support. Investor wealth grew by approximately **₹2 lakh crore** during the session. AI Infrastructure and Tech Partnerships Small-cap technology firms stole the spotlight following high-profile updates involving Nvidia. E2E Networks hit its **20% upper circuit** intraday, reaching **₹3,068.20**, before settling at **₹2,887**. The rally followed news of a collaboration to build advanced "AI factories" in India using Blackwell GPU clusters. Netweb Technologies also saw a sharp **8.9%** jump, closing at **₹3,374**. The company announced the launch of "Make in India" AI supercomputing solutions powered by Nvidia's latest architecture. These moves contrast with the broader Nifty IT index, which slipped **1.23%**. Consumer and Travel Movers Godfrey Phillips emerged as a top performer in the FMCG space, surging **20%** to hit **₹2,478**. The rally was fueled by reports of cigarette price hikes intended to offset recent excise duty increases. This move helped the stock significantly outperform its sector peers. Easy Trip Planners continued its volatile streak, rising **11%** during the session to reach **₹10.57**. The stock has gained nearly **60%** over the last three days. The momentum is supported by heavy volume in bulk deals and a newly announced plan to raise up to **₹500 crore** to expand its hotel and holiday segments. Electric Mobility and Recovery Ola Electric shares saw a brief reprieve, climbing nearly **5%** to an intraday high of **₹29.35**. The uptick followed a legal stay on an arrest warrant against its CEO. Despite the daily gain, the company’s fundamentals remain under scrutiny. Recent filings show a **55%** year-on-year revenue drop to **₹470 crore** for the December quarter, although net losses narrowed slightly to **₹490 crore**. Sectoral Highlights The Nifty Metal index led the charge with a **1.33%** gain, buoyed by shifting global trade signals regarding steel and aluminum tariffs. PSU Banks followed closely, rising **1.31%** to reach a fresh record high. Market breadth remained positive, with over **2,200** stocks advancing on the BSE against **1,900** declines. Total market capitalization of BSE-listed firms now stands near **₹472 lakh crore**.

RITES, Ahluwalia Contracts, and Two Small-Cap Stocks Projected for Up to 30% Upside
The Indian small-cap segment is currently navigating a period of selective volatility. As of February 18, 2026, the BSE Smallcap index has shown a modest five-day decline of **2.75%**, reflecting a cautious mood among investors despite a positive advance-decline ratio of **2.0x**. Against this backdrop, infrastructure and real estate picks are gaining attention due to robust order books and strategic pivots. The Union Budget 2026-27 has further bolstered sentiment with a **9%** increase in capital expenditure, totaling **₹12.22 lakh crore**. Kalpataru Projects International (KPIL) Kalpataru Projects is currently trading near **₹1,118**, maintaining a market capitalization of approximately **₹19,100 crore**. The company recently reported a massive **89%** year-on-year jump in net profit for the latest quarter, reaching **₹237 crore**. Its execution visibility is underpinned by a record-high consolidated order book of **₹64,682 crore**. Recent wins include a **₹719 crore** metro rail project in Thane and international T&D contracts worth **₹989 crore**, bringing its FY26 order intake to **₹14,951 crore**. RITES Ltd RITES is trading at approximately **₹221**, with a dividend yield of **3.41%**. Analysts maintain a positive outlook on this transport consultancy, with a consensus price target of **₹282.40**, suggesting a potential upside of over **27%**. The company continues to leverage its status as a leading engineering consultant. While revenue growth has faced recent headwinds, its operational margins remain healthy at **23.36%**, supported by a steady flow of domestic and international infrastructure consultancy assignments. Ahluwalia Contracts (India) Ahluwalia Contracts recently delivered a strong Q3 performance, with revenue from operations growing **11.43%** to **₹1,060.72 crore**. The company’s net profit for the nine-month period ending December 2025 surged by **55.6%**, reaching **₹184 crore**. A major catalyst for the firm is the recent securing of a contract worth **₹3,070 crore** in early 2026. Additionally, the board has approved the amalgamation of five subsidiaries to streamline its real estate and rental income operations, effective April 2026. Signature Global India Signature Global is pivoting toward the luxury and commercial segments in Gurugram. The company has formed a **₹1,283 crore** joint venture with RMZ Group to develop a massive mixed-use project on the Southern Peripheral Road, with a projected capital value of up to **₹16,000 crore**. Despite a reported Q3 consolidated net loss of **₹453 million** due to construction halts during pollution bans, the company is accelerating operations. It aims for sales bookings of **₹10,300 crore** this fiscal year, supported by a new luxury project expected to generate **₹5,000 crore** in revenue.

India Sotheby's International Realty and Interiors with Art Partner for Design Consultancy
India Sotheby’s International Realty (India SIR) has officially entered a joint venture with London-based Interiors with Art (IWA) to launch a specialized design and architecture consultancy. This strategic alliance targets India’s surging population of High Net Worth Individuals (HNIs) and Ultra-High Net Worth Individuals (UHNIs) who are increasingly seeking globally benchmarked, turnkey residential solutions. The partnership arrives as the Indian luxury housing sector shifts from volume-based growth to a focus on "experience-led" value. The market is maturing rapidly, with premium housing expected to account for 40% of all new residential launches by the end of 2026. This move allows India SIR to provide end-to-end services beyond property transactions, covering bespoke interiors and architectural excellence. Market data for February 2026 highlights a resilient appetite for high-end assets despite global economic headwinds. Recent surveys indicate that 67% of India’s wealthy remain bullish on the country’s growth story, with 72% expecting GDP to maintain a steady 6-7% range. Physical real estate remains a cornerstone of these portfolios, with 64% of affluent investors maintaining or increasing their property allocations this year. The demand for luxury is now spreading beyond traditional hubs like Mumbai and Delhi-NCR. Major transaction activity is currently concentrated in Gurugram, which hosted 87% of luxury launches in late 2025, alongside emerging high-growth zones in Hyderabad, Bengaluru, and lifestyle destinations like Goa. Annual residential price appreciation in these prime corridors is projected to hold steady between 5% and 10%. The collaboration with IWA brings over 24 years of experience serving royal families and global billionaires to the Indian market. This expertise addresses a critical trend where 60% of buyers now prioritize wellness amenities, privacy-centric layouts, and "service-led" living over sheer square footage. On the investment front, the luxury segment is outperforming the broader market. The Sotheby’s network reported a massive USD 157 billion in transaction volume globally in the last fiscal year, reflecting the strength of the brand. In India, the luxury residential market is forecasted to grow at a compound annual rate of over 6%, potentially reaching a value of USD 44.82 billion by the early 2030s. Wealthy buyers are also moving toward professionalization, with 20% now using specialized advisors for their property decisions. By integrating IWA’s architectural consultancy, India SIR positions itself to capture this demand for "wealth-preservation" assets that offer both aesthetic superiority and long-term capital stability.

Indian Rupee appreciates to 90.67 per US Dollar
The Indian rupee maintained a resilient stance in mid-February 2026, closing at **90.67** against the US dollar. This marginal gain of **5 paise** reflects a delicate balancing act between robust domestic fundamentals and persistent global headwinds. The local unit found significant support from the domestic equity markets, where the Sensex climbed by over **280 points** to settle at **83,734.25**, while the Nifty 50 advanced toward the **25,820** level. Investor sentiment remains bolstered by recent trade agreements and steady corporate earnings, which have encouraged foreign institutional investors to remain active participants, contributing over **₹995 crore** in net purchases during recent sessions. External Pressures and Constraints Despite these inflows, the rupee’s appreciation was capped by a strengthening US Dollar Index, which rose to **97.22**. Market participants are closely monitoring the Federal Reserve’s upcoming policy cues, as US interest rates are expected to remain at **3.50%-3.75%** for the near term. This keeps the greenback attractive to global investors, limiting the upside for emerging market currencies. Energy costs also continue to weigh on the rupee's outlook. Brent crude prices have trended higher, trading near **$67.57** per barrel. As India relies heavily on imported oil, these price fluctuations increase the demand for dollars among importers, creating a natural resistance level for the rupee near the **90.75** mark. Liquidity and Central Bank Action The Reserve Bank of India has been active in managing volatility, keeping the currency within a narrow range of **90.60 to 90.71**. To support the banking system, the central bank has injected significant liquidity through Open Market Operations, totaling more than **₹6.39 trillion** so far in the current fiscal year. While absolute cash in circulation has reached a record **₹40 lakh crore**, the growing adoption of digital payments has kept the cash-to-GDP ratio stable at approximately **11.2%**. This structural shift, combined with a narrowing fiscal deficit target of **4.3%**, provides a stable macroeconomic backdrop even as global geopolitical tensions persist. Forex traders expect the rupee to remain range-bound in the coming weeks. The interplay between sustained foreign fund inflows and the central bank's intervention strategy will likely define the currency's trajectory as it navigates the final quarter of the fiscal year.

Sensex Gains 283 Points and Nifty Surpasses 25,800 Amid Mixed Sectoral Performance
Market Brief: Benchmark Indices Extend Gains The Indian equity markets demonstrated resilience on Wednesday, marking a third consecutive session of gains. Domestic benchmarks were propelled by heavy buying in the metal and banking sectors, effectively neutralizing a localized drag in technology stocks. The **S&P BSE Sensex** jumped **283.29 points**, or **0.34%**, to settle at **83,734.25**. Simultaneously, the **NSE Nifty 50** rallied **93.95 points**, or **0.37%**, closing above the psychological hurdle at **25,819.35**. Sectoral Performance and Gainers Buying was broad-based as the midcap and smallcap segments outperformed the headline indices. Market capitalization for all BSE-listed firms rose by approximately **₹2 lakh crore**, reaching a total of nearly **₹472 lakh crore**. * **Nifty Metal:** The top-performing sector, surging **1.33%**. Key movers included **Tata Steel**, which rose **2.93%**, and **Hindustan Copper**, up **3.63%**. * **PSU Banks:** Public sector lenders maintained their record-breaking streak for a third day, with the index rising **1.31%**. **Punjab National Bank** and **Union Bank** were among the leaders hitting fresh **52-week highs**. * **FMCG & Heavyweights:** Strong support came from **ITC**, which climbed **2.21%**, and **Reliance Industries**, adding **1.26%**. Technology Sector Drag The **Nifty IT index** was the sole sectoral outlier, declining **1.23%**. Investors rotated out of software stocks following a brief relief rally earlier in the week. Major losers in this space included **Wipro (-1.73%)**, **Tech Mahindra (-1.60%)**, and **Infosys (-1.40%)**. Cautious sentiment persists in this sector as firms adjust to evolving shifts in service delivery frameworks. Global Cues and Geopolitics Global markets provided a mixed but supportive backdrop. In the U.S., the **Dow Jones** and **S&P 500** futures pointed toward a positive opening as investors parsed upcoming federal policy minutes. The commodities market reacted sharply to diplomatic shifts. **Brent crude** prices fluctuated near **$67.83 per barrel** as traders weighed ongoing negotiations between the **U.S. and Iran** in Oman. While earlier sessions saw a "war premium" due to military drills in the **Strait of Hormuz**, recent progress in de-escalation talks has eased immediate supply disruption fears, causing crude prices to edge lower from their January peaks. Currency and Fixed Income The Indian rupee saw a marginal appreciation, closing at **90.68** against the U.S. dollar, compared to its previous close of **90.72**. In the bond market, the yield on the **10-year benchmark federal paper** rose slightly to **6.676%**, reflecting a steady domestic macro environment. Volatility expectations cooled as the **India VIX** dropped **3.55%** to settle at **12.22**.

Sula Vineyards Promoter Stake Increases to 24.5% in First Purchase Since 2022 IPO
Market Brief: Sula Vineyards Activity **Promoter Confidence Signals Rebound** Promoter activity has returned to Sula Vineyards as Founder and CEO Rajeev Suresh Samant increased his stake to **24.5%**. This represents the first such increase since the company’s IPO in December 2022. The move is widely viewed by market participants as a signal of long-term confidence from leadership, despite the stock facing significant technical and fundamental pressure in recent months. **Quarterly Financial Overview** The company reported a challenging Q3 for the fiscal year ending December 2025. Consolidated net profit plummeted by **67.6%** year-on-year, landing at **9.10 crore**. Revenue from operations also saw a decline of approximately **9.7%**, totaling **195.7 crore** for the quarter. These results underscore a difficult period for the core wine business, which has been impacted by both regulatory and demand-side shifts. **Regional and Operational Headwinds** The downturn was largely attributed to a one-time tactical destocking in Karnataka, Sula’s second-largest market. This move was intended to right-size channel inventory amidst subdued urban demand in Bengaluru. Additionally, the company faced rising operational costs, including a **1.7 crore** charge related to new labor code implementations. Consequently, EBITDA margins contracted significantly to **16.3%**, down from **24.5%** in the previous year. **Wine Tourism: The Growth Driver** While the core "Own Brands" segment faced headwinds, Sula's wine tourism wing emerged as a standout performer. The segment recorded its highest-ever quarterly revenue of **22 crore**, marking a **33.7%** year-on-year growth. This surge was fueled by a **17%** increase in visitor footfalls and the expansion of 'The Haven by Sula' resort. Wine tourism now contributes over **11%** to the total revenue mix. **Market Performance and Outlook** As of mid-February 2026, Sula Vineyards' stock is trading near its 52-week lows, hovering around the **178.00** to **180.00** range. The stock has declined roughly **40%** over the past year. However, management suggests that profitability may have bottomed out in Q3. Recovery is expected to be driven by a rebound in Maharashtra, the company's largest market, and strong festive demand in the premium segment. **Strategic Portfolio Stability** Despite volume challenges, Sula has maintained its focus on premiumization. The "Elite & Premium" category continues to account for approximately **80%** of own-brand revenue. Specifically, the 'Source' range demonstrated healthy double-digit growth, increasing its share within the portfolio to **11%**. This focus on high-margin products remains central to the company's strategy for margin normalization in the upcoming quarters.

Analyzing India's Progress Toward the 500 GW Renewable Energy Target by 2030
India is accelerating its transition to a green economy, surpassing major milestones well ahead of schedule. As of February 2026, the nation’s total installed power capacity has reached 520.5 GW. For the first time, non-fossil fuel sources—including solar, wind, hydro, and nuclear—account for more than 52% of this total, standing at 272 GW. This achievement marks the successful fulfillment of India’s COP26 pledge to derive 50% of its power from clean sources by 2030, hitting the target four years early. The current financial year 2025-26 has seen a record-breaking addition of 52,537 MW in generation capacity, with 80% of new installations coming from renewable energy. Solar energy continues to lead the sector with a cumulative capacity of 141 GW, followed by wind power at 55 GW. Strategic focus has now shifted toward offshore wind, with the identification of key zones off the coasts of Gujarat and Tamil Nadu. Recent auctions under the National Green Hydrogen Mission have also seen green hydrogen prices fall to a historic low of 279 INR per kg. A significant shift in market dynamics is the transition from plain renewable tenders to Firm and Dispatchable Renewable Energy (FDRE). To manage the intermittency of solar and wind, battery energy storage systems (BESS) are seeing a massive scale-up. Capacity is projected to surge tenfold to 5 GWh in 2026, supported by a 5,400 crore INR Viability Gap Funding scheme. Despite the rapid supply growth, power demand has shown signs of volatility. While January 2026 recorded a 5% year-on-year increase in demand reaching 143 billion units, overall growth for the fiscal year has been moderated by a prolonged monsoon. Peak demand reached a new high of 245 GW during the recent winter cold wave. Investors are closely monitoring the financial health of distribution companies (discoms), which currently carry a debt burden of 7.18 lakh crore INR. The Draft National Electricity Policy 2026 aims to address this through cost-reflective tariffs and mandatory renewable consumption obligations. The sector is moving toward a more integrated grid architecture. With over 190 GW of non-fossil capacity currently under implementation or tendered, the path toward the 500 GW clean energy goal by 2030 remains highly viable. Success now depends on the seamless integration of storage technologies and the stabilization of long-term power purchase agreements.

SBI Funds Management to File for $1.5 Billion IPO in March
SBI Funds Management Ltd., the dominant force in India’s asset management landscape, is moving toward a public listing with a planned initial public offering (IPO) expected to launch before September 2026. The firm is reportedly targeting a valuation of **$14 billion to $15 billion**, positioning it as a significant heavyweight in the financial services sector. This valuation places it just behind ICICI Prudential AMC, which currently holds a market capitalization of approximately **$17.7 billion (₹1.48 lakh crore)** as of mid-February 2026. Offering Structure and Capital The IPO is projected to raise between **$1.4 billion and $1.5 billion (₹12,500 crore – ₹15,700 crore)**. The issue is expected to be primarily an Offer for Sale (OFS), as the company maintains a robust capital position. Promoters State Bank of India (SBI) and Amundi Asset Management aim to offload a combined **10% stake**. Specifically, SBI is slated to sell **6.3%** of its holdings, while Amundi will divest **3.7%**. SBI leadership has clarified that no fresh capital infusion is required for the bank’s credit growth through 2030, given its strong capital-to-risk-weighted assets ratio of **15%**. Market Context and Sector Trends The listing comes at a pivotal moment for the Indian mutual fund industry. Total assets under management (AUM) reached a record **₹81.01 lakh crore** in January 2026, marking a **20.5%** year-on-year increase. * **Retail Momentum:** SIP inflows hit an all-time high of **₹31,002 crore** in January 2026. * **Asset Shift:** The AUM-to-bank deposit ratio has climbed to **32.6%**, nearly tripling over the last decade. * **Passive Growth:** Passive fund AUM surged **38%** over the past year, now accounting for **19%** of the total industry AUM. Strategic Outlook SBI Funds Management continues to lead with an AUM exceeding **₹12.5 trillion**. The firm is leveraging its extensive distribution network of over **22,000 SBI branches** to deepen penetration in Tier-II and Tier-III cities. While the IPO is set to unlock significant value, the market remains selective. Investors are closely watching fee structures and the impact of new SEBI regulations on expense ratios, effective April 2026, which may influence long-term margin stability for the sector.

European stocks edge higher led by defense gains ahead of ECB policy cues
European equity markets advanced on Wednesday, edging closer to record levels. The pan-European STOXX 600 index rose 0.5% to reach 626.71 points, supported by a significant rally in the defense sector. Defense stocks surged more than 2% following a standout performance from the UK’s BAE Systems. The company reported a 10% increase in full-year sales to a record £30.7 billion, while underlying operating profit climbed 12% to £3.32 billion. BAE Systems shares jumped nearly 6% as the firm highlighted a record order backlog of £83.6 billion. Investor interest in the sector was further bolstered by reports that Germany is considering a minority stake in KNDS, the manufacturer of the Leopard tank, ahead of its planned listing. The market also processed reports regarding potential leadership changes at the European Central Bank. Financial Times reports suggest President Christine Lagarde may step down before the 2027 French elections to allow for a structured succession. Despite the news, market reaction remained calm. The ECB currently maintains its benchmark interest rate at 2.0%, with inflation projections stabilizing near the 2% target for 2026. Investors do not anticipate immediate shifts in monetary policy. Wider market moves were also influenced by earnings in other sectors. Carrefour shares dropped 5% after the retailer reported a decline in operating profit. Conversely, the German DAX climbed 0.8% and the UK's FTSE 100 gained 0.3%. Investor focus now shifts to the release of Federal Reserve minutes for further signals on the global interest rate outlook. In the UK, factory gate inflation eased to 2.5% in January, its lowest level in seven months, providing some relief to the broader economic narrative.

EaseMyTrip Shares Surge 60% Over Three Trading Sessions
EaseMyTrip: Market Brief February 2026 Shares of Easy Trip Planners (EaseMyTrip) witnessed a significant surge this week, climbing nearly **60%** across three trading sessions. The rally pushed the stock to an intra-day high of **₹10.57** on February 18, 2026. This momentum was largely triggered by a series of high-volume bulk deals and a major corporate announcement regarding capital infusion. The company's Board of Directors has provided in-principle approval to raise up to **₹500 crore**. This capital is slated to be raised through various instruments, including equity shares, rights issues, or Qualified Institutions Placement (QIP). The move is designed to provide the travel-tech platform with the financial flexibility required to scale high-margin segments and invest in long-term infrastructure. Strategic Growth Drivers The primary focus for the new capital includes a massive expansion into the hotels and holiday packages market. While air passage remains the company's largest revenue contributor, the hotel segment showed a robust **40.74%** year-on-year growth in the most recent quarter. The company aims to capitalize on this momentum to diversify away from its core ticketing business. Technology investments also remain a priority. The firm plans to utilize a portion of the **₹500 crore** to upgrade its digital platform and enhance user experience through advanced data analytics and AI-driven personalization. These upgrades are intended to keep the platform competitive as the Indian travel sector moves toward "micro-cations" and experience-led tourism. Financial Performance Review Recent earnings for Q3 FY26 presented a mixed picture. The company achieved its highest-ever quarterly revenue from operations at **₹151.7 crore**, representing a **28.2%** sequential increase. Additionally, its Dubai operations showed remarkable growth, with Gross Booking Revenue (GBR) jumping **133.2%** year-on-year to **₹397.6 crore**. However, profitability faces significant headwinds. Net profit for the quarter plummeted to **₹5.85 crore**, an **82.6%** decline compared to the previous year. This drop was driven by a sharp compression in operating margins, which fell to **2.82%** from over **31%** a year ago, largely due to rising employee costs and increased marketing spend. Sector Outlook and Trends The broader Indian travel market is entering a high-demand phase in February 2026. Trends indicate a shift toward short, 2-to-4-day itineraries and event-based travel. Domestic hotspots such as Gulmarg and Auli are seeing heavy bookings, while international interest is focused on short-haul destinations like the UAE and Thailand. EaseMyTrip is positioning itself to capture this "micro-cation" boom by strengthening its supply partnerships and expanding its holiday package portfolio. Despite the current pressure on margins, the massive **₹500 crore** fundraise signal's management’s intent to double down on market share and technological leadership in a rapidly evolving travel landscape.

Nithin Kamath on the Risks of Margin Trading and the Importance of Tracking Key Metrics
Market Brief: The Rising Cost of Leverage The Margin Trading Facility (MTF) in India has seen an explosive five-fold growth since 2019, with the total book value now exceeding **₹1.10 lakh crore**. While retail participation remains high, a critical shift in the regulatory and cost landscape is fundamentally altering the math for leveraged traders. Hidden Costs and Breakeven Pressure Nithin Kamath has issued a fresh caution to investors who focus solely on interest rates while ignoring the compounding effect of brokerage and taxes. In a leveraged trade, every cost is magnified because the investor's actual capital contribution is only a fraction of the total trade value. Current market data shows that for a typical **₹11 lakh** trade, the points required to break even can more than quadruple depending on the frequency of trades and the fee structure. For short-term traders, brokerage alone can be the difference between a minor profit and a net loss. Regulatory Squeeze and Liquidity Risks The Reserve Bank of India has introduced a major policy shift effective **April 1, 2026**. Banks are now mandated to provide credit to market intermediaries only on a **100% fully collateralised** basis. This move is expected to: * Reduce overall system leverage * Increase capital blockage for brokers * Raise the cost of bank guarantees significantly Under the new framework, equity shares used as collateral will face a minimum haircut of **40%**, further tightening the available liquidity for active traders. Current Market Benchmarks As of **February 18, 2026**, market indicators reflect a cautious but stable environment: * **Sensex:** **83,428.13** * **Nifty 50:** **25,722.40** * **10-Year G-Sec Yield:** **6.67%** * **USD/INR:** **90.67** Institutional activity remains mixed, with Foreign Portfolio Investors (FPIs) buying approximately **₹995 crore** in the latest session, while Domestic Institutional Investors (DIIs) showed marginal buying of **₹187 crore**. Strategy for Leveraged Positions With the structural risks of MTF rising, the "breakeven math" has become more punishing. Traders are encouraged to treat leverage as a high-precision tool rather than a capital substitute. Success in the current high-cost environment requires capturing larger price moves to offset the interest—which typically ranges between **10% and 18% annually**—and the inevitable friction of statutory taxes and brokerage fees.

Blackstone-Backed Liftoff Mobile Refiles for US IPO Following Initial Withdrawal
Liftoff Mobile, the adtech giant backed by Blackstone, has shifted its strategy by filing for a confidential initial public offering. This move follows the official withdrawal of its previous listing plans on Tuesday, February 17, 2026. The company had originally targeted a **$711 million** raise with a valuation reaching **$5.17 billion**. The offering was structured for **25.4 million shares** priced between **$26 and $30**. However, a sharp sell-off in software and tech stocks forced a postponement earlier this month. Current market conditions are shaped by investor caution regarding artificial intelligence. Fears that AI tools could disrupt margins for established software firms have triggered a broad industry rout. Despite these headwinds, the adtech sector remains resilient, with the global market projected to reach **$1.12 trillion** in 2026. Liftoff’s financial health provides a strong foundation for its eventual debut. The company reported revenue of **$634 million** for the **12 months** ending September 2025. While it faces a net loss of approximately **$66 million**, its core advertising revenue saw a **40% increase** in the most recent nine-month period. The platform's scale is significant, reaching **1.4 billion** daily active users globally. This reach is a key asset as the mobile segment of the adtech market is expected to see the highest growth rates this year. Blackstone, which formed the current entity through a 2021 merger with Vungle, is expected to remain the majority shareholder. The pivot to a confidential filing allows the company to wait for a more stable window later in **2026**. This approach offers flexibility as the market digests the impact of AI and shifts in Federal Reserve leadership. The move is seen as a tactical delay rather than an abandonment of the public markets. Goldman Sachs, Jefferies, and Morgan Stanley continue to lead the underwriting syndicate. The firm’s decision reflects a broader trend among high-value startups choosing to delay listings until tech valuations recover from recent lows.

Comparative Analysis of Gold and 20–30% U.S. Portfolio Allocations as Inflation Hedges
**MARKET BRIEF: ASSET ALLOCATION UPDATE FEBRUARY 2026** Gold and US equities have emerged from a transformative 2025 with strong momentum, though recent weeks have introduced tactical volatility. As of mid-February 2026, the investment landscape is defined by record-breaking gold prices and a tech-driven US equity market facing fresh structural questions. **Gold Performance and Outlook** Gold has delivered exceptional returns, surging approximately **65%** during 2025. In the first six weeks of 2026, the metal scaled **12 all-time highs**, briefly breaching the **$5,400 per ounce** mark in late January. Despite a subsequent correction toward the **$4,900 – $5,000** range in mid-February, the structural bull case remains intact. In the Indian market, the price per 10 grams hit a record **INR 175,231** in January before easing by roughly **7%** in February. Institutional forecasts remain bullish, with year-end 2026 targets ranging from **$5,055** to **$5,600 per ounce**. Demand is currently driven by central bank accumulation, which is expected to reach up to **800 tonnes** this year, and strong inflows into gold ETFs. **US Equity Markets and Tech Volatility** US markets started February with resilience but have recently entered a "paused" phase. The S&P 500 is hovering near **6,850 points**, while the Nasdaq Composite sits around **22,600**. While January payroll data showed a robust addition of **130,000 jobs** and unemployment fell to **4.3%**, markets are grappling with "AI disruption fears." Heavyweight tech stocks, including Alphabet and Nvidia, have seen localized pullbacks as investors reassess valuations. Despite this, corporate fundamentals remain solid with **76%** of S&P 500 companies beating earnings estimates in the latest quarter. **Strategic Implications for Indian Investors** The case for US equities remains anchored in a potential currency kicker. The US dollar is estimated to be roughly **15% overvalued** on a fair-value basis, suggesting that any further rupee depreciation could boost the effective returns for Indian holders of US assets. A strategic allocation of **20–30%** to US equities is recommended to capture global innovation and hedge domestic currency risk. Conversely, a measured gold allocation of **10–15%** continues to serve as an essential "shock absorber." This balance protects portfolios against geopolitical flare-ups—such as recent US-Iran tensions—while maintaining exposure to the compounding power of the US tech and manufacturing sectors. Current market levels suggest that while gold offers a resilient floor, US equities provide the necessary growth engine for long-term wealth creation. Investors should prioritize systematic entries during the current February pullbacks to build efficient, diversified positions for the remainder of 2026.

Shreyash Devalkar Discusses Investment Trends Amid Market Volatility in AI and IT Sectors
Indian Market Brief: Sectoral Shifts and AI Realignment The Indian equities landscape is undergoing a structural transformation as of February 2026. Heavyweight sectors are trading places in influence, driven by technological disruption in software and a robust credit cycle in finance. IT Services: The AI Recalibration The Nifty IT index has faced a significant reset, declining more than 13% since the start of 2026. This sell-off is rooted in shifting growth expectations as Artificial Intelligence moves from experimental phases to large-scale deployment. Investors have recalibrated valuations, reflecting a 22.4% drop over the last 12 months. The sector's weightage in the benchmark Nifty 50 has contracted to 8.7%, down from 13.05% at the start of the previous year. While the India AI Impact Summit 2026 highlights massive infrastructure scaling, including 38,000+ GPUs, the software services model is under pressure to evolve beyond traditional maintenance. Banking and Finance: The New Growth Anchor Financials have emerged as the primary market driver, with the banking sector's weight in the key index rising to a record 27.6%. This rotation is supported by healthy credit growth, which is projected to expand by approximately 10.8% for FY2026. Asset quality remains a core strength as the non-performing asset (NPA) cycle bottoms out. Gross NPAs are expected to remain controlled between 2.3% and 2.5% by the fiscal end. Despite high credit-to-deposit ratios and a minor decline in net interest margins, the Bank Nifty has gained roughly 24% over the past year, significantly outperforming broader benchmarks. Manufacturing and Capex: Policy-Driven Momentum The manufacturing and capital expenditure themes are reinforced by the Union Budget 2026-27, which allocated ₹12.2 trillion to public capex—an 11% year-on-year increase. Manufacturing GVA growth reached 9.13% in the second quarter of the current fiscal, signaling strong industrial momentum. Infrastructure and defense remain the primary beneficiaries, with defense allocations rising 18% to ₹2.19 trillion. While the fundamental outlook for electronics and semiconductor manufacturing is at an all-time high, high valuations in capital goods stocks remain a point of caution for new entries. Automobiles: Recovery in Commercial Segments The automotive sector is witnessing a "tale of two halves." While overall volume growth is expected to moderate to 3-6% in the coming fiscal, the commercial vehicle (CV) segment shows resilience with a projected 4-6% growth. Bus volumes are a specific bright spot, expected to grow 7-9% due to replacement demand from state transport undertakings. Premiumization continues to drive margins in the passenger vehicle and two-wheeler segments, even as entry-level demand remains sensitive to price hikes. Consumption and FMCG: Margin vs. Volume The FMCG sector reported a 9% revenue growth in recent quarterly data, but this was largely supported by GST adjustments and price corrections rather than organic pricing power. Volume growth has stabilized at approximately 6%. Although easing inflation and falling input costs for palm oil and crude provide some relief, the risk-reward ratio remains unfavorable for many investors. High valuations in staples persist despite the completion of the earnings downgrade cycle, leading to a selective approach focusing on premiumization and wellness categories.

E2E Networks and Netweb Tech Shares Surge Following Nvidia Collaboration
Indian AI Infrastructure Brief: February 18, 2026 Market momentum in the Indian technology sector has reached a fever pitch today. Investors are reacting to landmark infrastructure deals that position domestic firms as critical nodes in the global artificial intelligence supply chain. E2E Networks Hits Upper Circuit E2E Networks witnessed an extraordinary surge of **20.0%** during today's session. The stock hit its upper circuit limit, closing at **₹3,068.20**. This massive rally follows the announcement of a strategic collaboration with Nvidia to address the soaring demand for AI compute in India. The company is currently building an Nvidia Blackwell GPU cluster on its TIR platform. This infrastructure will be hosted at the L&T Vyoma data center in Chennai. This deployment is a cornerstone for "Sovereign AI," providing the high-performance computing necessary for local enterprises to develop proprietary models in sectors like finance and healthcare. Netweb Technologies Strategic Launch Netweb Technologies also saw significant buying interest, with its shares rallying as much as **8.78%** to reach an intraday high of **₹3,371.10**. The gains were triggered by the official launch of its 'Make in India' AI supercomputing systems. Netweb unveiled the Tyrone Camarero Spark, touted as one of the world's smallest AI supercomputers. Despite its compact **5.9-inch** cube form factor, the system delivers **1 PetaFlop** of performance. It is powered by the Nvidia GB10 Grace Blackwell Superchip and is designed specifically for local model fine-tuning and inference. Broader Market Context These developments align with the ongoing India AI Impact Summit 2026. The government recently announced plans to expand the national compute capacity beyond the current **38,000 GPUs**. Recent policy updates have further fueled this sector, including a long-term tax holiday for AI data centers and a projected investment flow of over **$200 billion** into the domestic AI ecosystem over the next two years. The Indian public cloud market is maintaining a robust growth trajectory, with a projected **20–25%** CAGR. This growth is increasingly driven by specialized AI workloads, moving away from general-purpose computing toward high-density GPU infrastructure.
ECB President Lagarde may resign before end of Macron's term, report says
**EUROZONE MARKET BRIEF: LEADERSHIP STABILITY AND MONETARY OUTLOOK** The European Central Bank (ECB) remains at a critical policy junction as of February 2026. Despite recurring rumors regarding an early exit to navigate the French political landscape or to transition to global leadership roles, President Christine Lagarde has formally reiterated her commitment to completing her eight-year term. Her mandate is currently set to conclude on October 31, 2027. **Key Monetary Decisions** In its latest February 2026 policy meeting, the ECB opted to maintain its benchmark interest rates. The rate on main refinancing operations stands at **2.15%**, while the deposit facility and marginal lending rates remain steady at **2.00%** and **2.40%** respectively. This pause follows a total of **200 basis points** in cuts delivered since June 2024. **Inflation and Growth Metrics** Eurozone inflation has shown a significant downward trajectory, hitting **1.7%** in January 2026. This brings the headline figure below the bank’s medium-term target of **2.0%**. However, core inflation remains slightly more persistent at **2.2%**, driven primarily by service sector costs and steady wage growth. The economic growth outlook for the bloc remains modest. GDP is forecast to grow by **1.1%** in 2026 and **1.5%** in 2027. Domestic demand is currently the primary engine of this growth, supported by a resilient labor market, while external trade faces headwinds from global geopolitical uncertainty and shifting tariff policies. **Market Performance and Indicators** The Euro has demonstrated relative strength, trading at approximately **1.184 USD** as of February 18, 2026. While a strong currency helps dampen imported inflation, officials have noted that continued appreciation could weigh on export competitiveness, particularly for the German economy which is currently navigating structural headwinds and an aging demographic. **Strategic Shifts** The ECB is currently focusing on enhancing its financial toolkit, including updates to the Eurosystem repo facility (EUREP) to improve liquidity provision to non-euro area central banks. This move is designed to stabilize the transmission of monetary policy amid high global volatility. Additionally, the bank is monitoring the impact of new technologies and increased defense spending as significant long-term drivers of European productivity. Speculation regarding a successor continues to focus on the necessity of joint French and German backing. While potential candidates like Isabel Schnabel have been mentioned in technical discussions, the focus remains on the current leadership's ability to navigate the transition toward a neutral monetary stance without unsettling financial markets. [Watch the ECB's February 2026 Press Conference](https://www.youtube.com/watch?v=2c6h9H5LRwU) This video provides the official primary source for the ECB's latest rate decisions and President Lagarde's direct comments on the eurozone economic outlook. http://googleusercontent.com/youtube_content/0
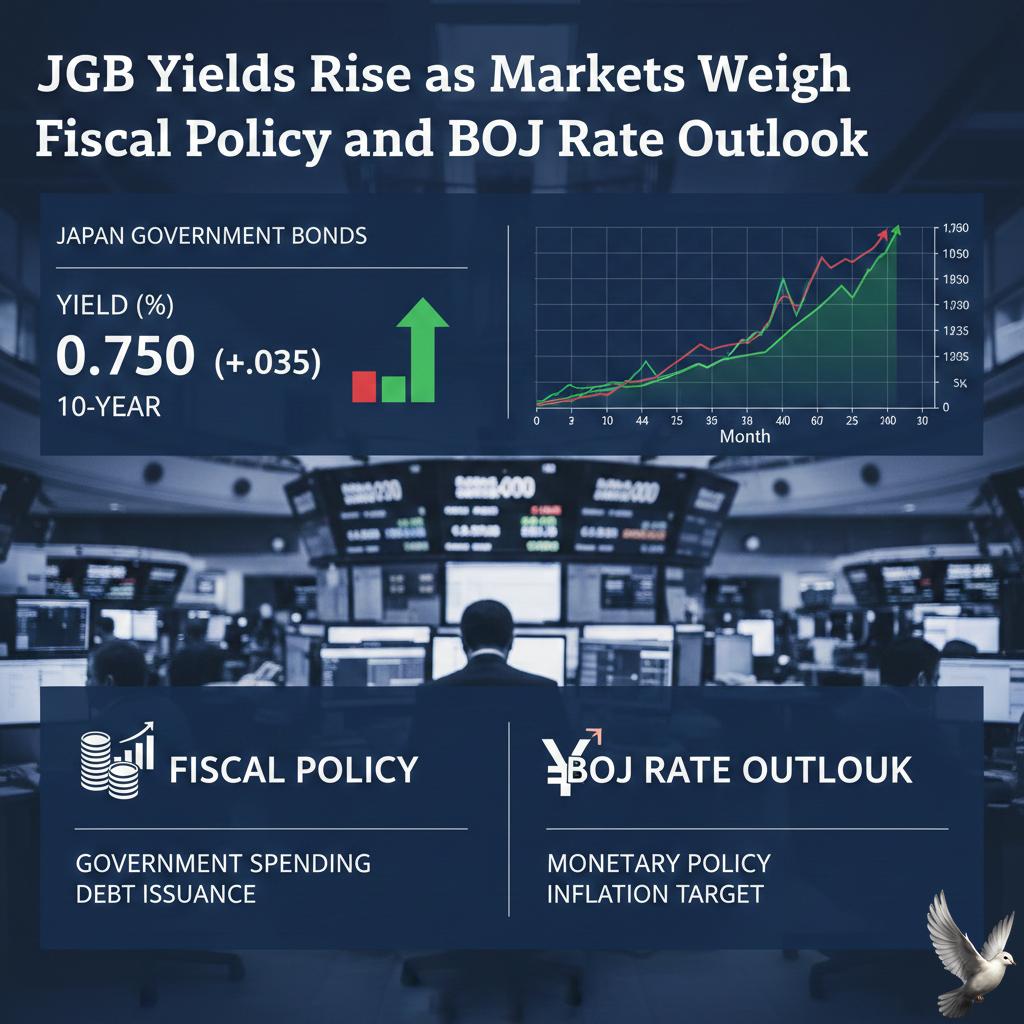
JGB Yields Rise as Markets Weigh Fiscal Policy and BOJ Rate Outlook
Japanese government bond (JGB) markets have entered a period of heightened volatility, marked by a significant sell-off in January 2026 that pushed yields to multi-year highs. The benchmark 10-year JGB yield recently touched 2.23%, a surge of approximately 100 basis points from the previous year, as investors priced in a more aggressive tightening cycle and fiscal expansion. Market sentiment is currently driven by a tug-of-war between ambitious government spending and the Bank of Japan’s (BoJ) normalization path. Prime Minister Sanae Takaichi’s administration has proposed a record 122.3 trillion yen budget for fiscal 2026. While the government has signaled it will seek non-debt revenues to fund tax cuts on food, the Ministry of Finance warns that annual bond issuance could surge 28% by 2029 due to rising debt-servicing costs. The Bank of Japan remains on a path toward higher rates, with the current policy rate sitting at 0.75%. Inflation has persistently exceeded the 2% target for nearly four years, reaching 3.1% in recent months. Analysts expect the central bank to hike rates again in April 2026, with some forecasting up to three increases this year to bring the policy rate toward a neutral stance by 2027. The super-long end of the curve has faced the most intense pressure. Yields on 40-year bonds briefly exploded to 4.0% in late January—a psychological level not seen in three decades—before retreating slightly to 2.18% in mid-February as global bond markets stabilized. This retreat followed reassurances that the BoJ would maintain a flexible approach to bond-buying operations to prevent market dysfunction. The Japanese yen has become a central factor in policy calculations. Trading around the 153 level per dollar, the currency has seen volatile swings. While the yen rallied nearly 3% in early February on safe-haven demand, it remains vulnerable to the wide interest rate gap between Japan and the United States. BoJ officials are closely monitoring the yen’s impact on import-driven inflation, which could accelerate the timing of the next rate hike. Institutional investors are beginning to recalibrate as real interest rates turn positive for the first time in two decades. Higher domestic yields are expected to encourage Japanese banks and insurers to shift a portion of their 5 trillion dollar foreign asset holdings back into JGBs. However, the transition is proving painful for regional lenders, who are already recognizing mark-to-market losses on their existing bond portfolios. Economic growth remains a complicating factor. Fourth-quarter GDP expanded by just 0.1%, falling short of the 0.4% forecast. Weak consumer spending highlights the strain high inflation is placing on households, even as nominal wages rise at a historic pace. This "soft" data provides the BoJ with a reason to remain gradual in its tightening, even as fiscal pressures urge a faster move toward higher rates.