Bullish News
Collection
**Australian and New Zealand Equities Rise as NAB Reaches Record High**
Market Overview: Trans-Tasman Equities Surge Australian and New Zealand markets recorded significant gains this week as a flurry of corporate earnings and central bank stability provided a clear path for investors. The **ASX 200** successfully reclaimed the **9,000** psychological barrier, trending toward its record high of **9,115.2** points. Positive sentiment was fueled by a dominant performance in the banking and mining sectors, which helped the index maintain its upward trajectory despite a hawkish tone from the Reserve Bank of Australia. Australia: Banking and Resources Lead the Charge National Australia Bank (NAB) emerged as a primary market mover. The lender reported a **16%** jump in first-quarter cash earnings to **$2 billion**, driven by robust business and home lending volumes. NAB shares surged as much as **5.8%** to reach an all-time record high of **$47.96**. This performance follows a trend of strong bank results, including a **17%** profit rise from ANZ and upbeat earnings from CBA, which recently posted a **$5.37 billion** half-year profit. The resources sector added further momentum. Mining giant BHP saw its shares soar over **7.5%** to a record **$54.20** following a blockbuster result. The company reported a **25%** jump in underlying EBITDA to **$15.5 billion** and lifted its dividend by **46%** to **$0.73** per share. Despite the market strength, the Reserve Bank of Australia maintains a cautious stance. The cash rate currently sits at **3.85%**, with officials signaling that inflation remains "stubbornly high" at **3.6%** to **4.2%**, potentially delaying any near-term rate relief. New Zealand: RBNZ Stability Sparks Recovery The New Zealand market experienced a significant relief rally after the Reserve Bank of New Zealand (RBNZ) opted to keep the official cash rate steady at **2.25%**. This decision met market expectations and provided a much-needed boost to local equities. The **S&P/NZX 50** showed a sharp recovery following a period of volatility. Investors responded positively to the RBNZ’s outlook, which suggests that inflation will return to the **1% to 3%** target band within the current quarter. While the central bank noted that the economy is in the early stages of recovery, it emphasized that monetary policy will remain accommodative. This stance helped offset recent drags in the healthcare sector, where stocks like Fisher & Paykel Healthcare had previously faced pressure. Key Performance Indicators * **ASX 200:** Trading near **9,031**, targeting the **9,115** record high. * **NAB Shares:** Hit record high of **$47.96**. * **BHP Shares:** Reached record high of **$54.20**. * **RBNZ Cash Rate:** Held steady at **2.25%**. * **RBA Cash Rate:** Maintained at **3.85%**. Broad-based growth in Australian business investment, projected to rise to **3.7%** by mid-2026, continues to anchor the regional growth outlook despite global trade uncertainties.
PSU Banks and Capital Goods Drive Market Growth: Dipan Mehta
Market Outlook: PSU Banks and Infrastructure Lead 2026 Growth The Indian equity market continues to show a distinct divide between cyclical strength and consumption-led caution. As of February 18, 2026, the **Nifty 50** remains in a consolidation phase near the **25,700** level, while the **Sensex** hovers around **83,300**. Despite a subdued tone in the broader indices caused by a retreat in IT counters, Public Sector Undertaking (PSU) banks and the capital goods sector are demonstrating significant technical momentum. PSU Banking Sector Re-Rating The valuation gap between PSU banks and their private peers is narrowing rapidly as state-run lenders undergo a structural revival. The **Nifty PSU Bank index** has recently surged to **9,304**, reflecting a **1.5%** gain in a single session. This outperformance is driven by improved asset quality, with top-tier PSU banks reporting Net Non-Performing Assets (NPAs) below **0.5%** to **1.0%**. **Indian Bank** hit an all-time high of **928** today, marking a **78.55%** return over the past year. **State Bank of India (SBI)** has also shown strong momentum, with its market capitalization crossing **11.14 lakh crore** and share prices reaching **1,206.5**. Investors are increasingly viewing these entities as value plays due to healthy Return on Assets (ROA) of approximately **1%** and credit growth sustained at **14%**. Capital Goods and Infrastructure Surge The capital goods sector is emerging as a primary pillar of India’s investment-led growth. The Union Budget 2026-27 has bolstered this sentiment by increasing public capital expenditure to **12.2 lakh crore**, a **9%** rise from previous estimates. This fiscal push is directly benefiting firms with robust order books and diversified engineering portfolios. **Larsen & Toubro (L&T)** continues to dominate the segment, with its market capitalization nearing the **6 trillion** milestone. The firm holds a record order backlog of **7.33 trillion**, supported by a **30%** year-on-year increase. Its stock currently trades near a 52-week peak of **4,279**, fueled by a **10%** rally over the last month. Other major players like **BHEL** have also secured significant contracts, including a recent power plant order valued between **1,200 and 1,500 crore**. FMCG Growth Deceleration In contrast to the industrial boom, the Fast-Moving Consumer Goods (FMCG) sector faces a cautious outlook. High wholesale inflation, which rose to **1.81%** in January 2026, has put pressure on margins. While volume-led growth is expected to stay between **6% and 8%** for the fiscal year, revenue realizations remain constrained by intense competition and rising input costs for manufactured products. Rural demand remains a relative bright spot, showing a **7.7%** volume expansion compared to **3.7%** in urban markets. However, the **Nifty FMCG index** has slipped as investors rotate capital away from defensive consumption stocks into high-growth infrastructure and cyclical banking themes. Selective premium offerings and quick commerce channels remain the only segments showing high-double-digit growth potential within the consumer space.
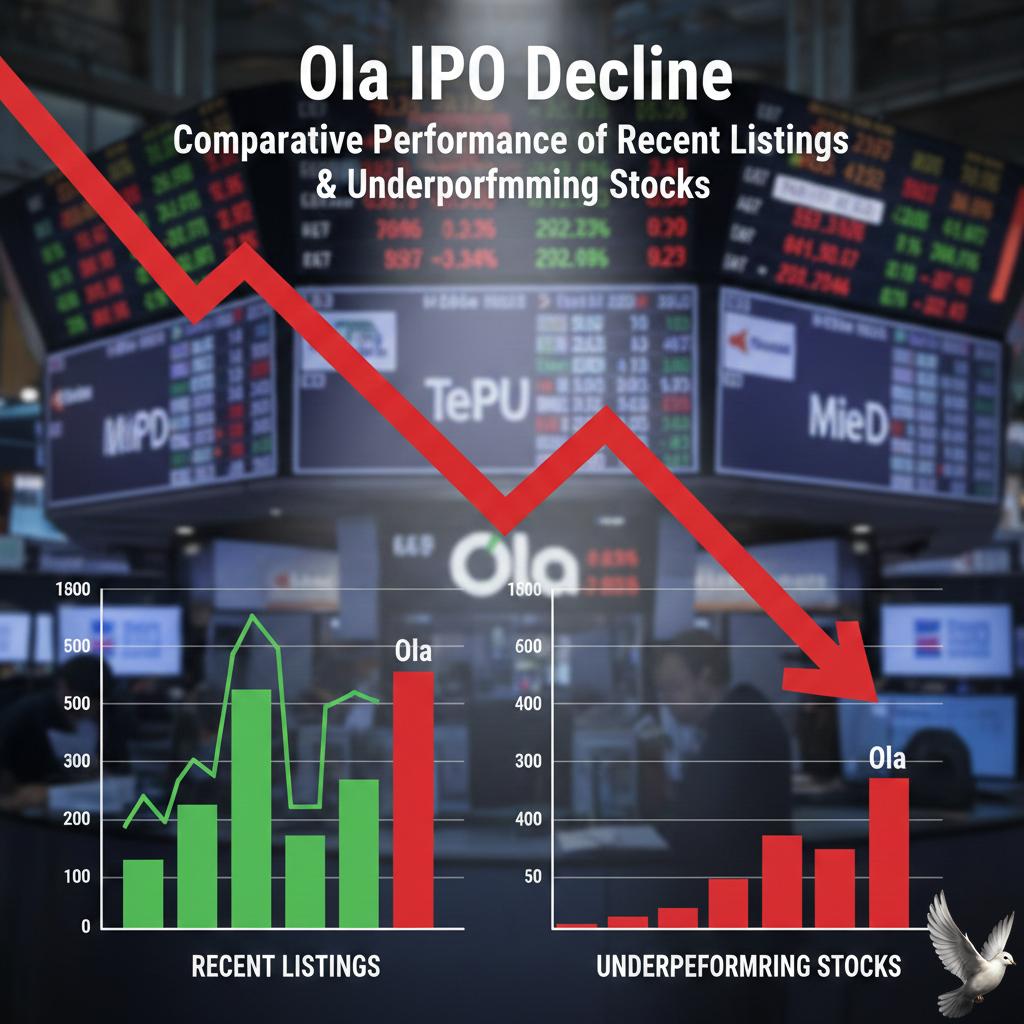
Ola IPO decline in context: Comparative performance of recent listings and underperforming stocks.
The Indian primary market is facing a significant cooling period as of February 2026, with secondary market volatility and shifting investor sentiment creating a challenging environment for new listings. While high-profile names once dominated headlines, the focus has shifted to a broader correction that has left many investors underwater. Ola Electric Mobility continues to serve as a high-profile example of this downturn. As of February 18, 2026, the stock is trading near 28.00 INR, marking a sharp decline of approximately 63% from its IPO price of 76.00 INR. This represents an even steeper 82% crash from its all-time high of 157.40 INR reached shortly after its debut. The company recently reported a narrowed net loss of 487 crore INR for the December quarter, but a 55% year-on-year drop in revenue has kept the stock under intense selling pressure. The pain is not limited to large-cap tech. Data shows that over 115 NSE-listed IPOs from the 2025–26 cycle are currently trading below their initial issue prices. The erosion of wealth is particularly visible in the SME segment, where several listings have plunged by 60% to 70%. For instance, recent listings like Narmadesh Brass Industries and Yajur Fibres have seen their market values erode by 64% and 65% respectively from their issue prices. Market indicators reflect this broader fatigue. The Nifty SME Emerge Index is currently trading around the 13,112 level, hovering near its 52-week low of 12,614. This represents a significant retreat from its 52-week high of 15,662. In recent trading sessions, market breadth has remained weak, with declines often doubling the number of advancing stocks on the SME platform. Despite the current slump, the pipeline for 2026 remains historically large. Approximately 190 companies have either received regulatory approval or are awaiting clearance to raise over 2.5 lakh crore INR. However, many issuers are choosing to delay their launches as they wait for more favorable valuations and a stabilization of foreign institutional investor (FII) flows. The current trend underscores a shift toward quality and sustainability. Investors are increasingly moving away from speculative "hype" listings, prioritizing companies with clear paths to profitability and reasonable entry valuations. Until secondary markets find a firm floor, the primary market is expected to remain in a "wait-and-watch" phase. [Ola Electric market activity](https://www.youtube.com/watch?v=c7EMGrzCD2s) This video provides an overview of the NSE market's performance and the cautious shift in the IPO landscape during the recent cycle. http://googleusercontent.com/youtube_content/0

Cigarette Stocks Surge up to 12% Led by Godfrey Phillips and ITC
Shares of major Indian tobacco manufacturers surged on Wednesday, February 18, 2026, as investors reacted to aggressive pricing strategies designed to counter a new tax regime. The rally follows reports that cigarette makers have successfully implemented steep price hikes to absorb a significant increase in excise duties that took effect earlier this month. **ITC Ltd** saw its stock price rise nearly **2%** to reach **₹331**, extending a three-day winning streak that has netted over **5.5%** in gains. **Godfrey Phillips India** led the sector with a massive **12%** jump, trading near **₹2,315**, while **VST Industries** advanced by **3.3%** to **₹247.40**. The market's optimism stems from the sector's demonstrated pricing power. By raising retail prices by **15% to 40%** across various categories, manufacturers have effectively shifted the tax burden to consumers. This maneuver is expected to limit the impact on Earnings Before Interest and Taxes (EBIT) to just **2%**, a sharp improvement from initial market fears of an **8% to 15%** decline. The new taxation framework, which launched on February 1, 2026, replaced the previous GST compensation cess with a structured excise duty ranging from **₹2,050 to ₹8,500** per **1,000 sticks**, depending on cigarette length. This is applied on top of a **40% GST** rate. Premium brands have seen the most significant adjustments. Prices for **84mm** cigarettes in the King Size Filter Tipped (KSFT) segment, such as Gold Flake and Classic, have been raised to approximately **₹24** per stick, up from **₹17**. In the more price-sensitive **64mm** and **69mm** segments, hikes have been kept minimal to protect volumes and discourage consumers from switching to illicit alternatives. Analysts note that while the price hikes protect immediate margins, the sector faces long-term challenges. Volume growth may moderate as consumers adjust to paying **₹22 to ₹55** more per pack of **10 sticks**. Additionally, the illicit trade—already estimated to account for **20% to 30%** of the market—remains a persistent threat as legal prices rise. For ITC, the cigarette business remains the primary profit engine, contributing roughly **42%** of revenue and over **75%** of its operating profit. The company's ability to maintain a **59.9%** margin in its cigarette segment during the previous quarter, despite high-cost leaf inventory, suggests underlying resilience as new pricing flows through the supply chain.
Indian Bond Yields Remain Unchanged Following Government Debt Switch Auction
Indian government bonds maintained a steady profile on Wednesday, February 18, 2026, as the market absorbed the impact of recent liquidity management and prepared for significant upcoming supply. Trading activity reflects a balancing act between domestic fiscal strategy and evolving global cues. The benchmark **10-year government bond yield** held firm near **6.67%**, hovering close to its lowest level in three weeks. This stability follows a notable decline from the **6.71%** to **6.73%** range seen earlier in the month. Market participants are closely watching the **6.64%** to **6.69%** corridor for the benchmark security. Redemption pressures for the upcoming 2026-27 fiscal year have been significantly mitigated by a successful debt switch operation. The government recently bought back **755.04 billion rupees** of securities maturing in the next financial year, issuing **694.36 billion rupees** of longer-dated **2040 bonds** in their place. A second major conversion is scheduled for February 23, involving an additional **25,000 crore rupees**. This move is designed to smoothen the redemption profile ahead of a heavy **5.47 trillion rupee** maturity pipeline. By extending maturities, the government aims to lower gross borrowing requirements for the next cycle. Inflation data remains a key anchor for market sentiment. The latest retail inflation print for January came in at **2.75%** under the newly revised **2024 base year** series. While this is an uptick from the previous month’s record lows, it remains well within the central bank's **2% to 6%** tolerance band. Liquidity remains in a comfortable surplus, averaging roughly **70,000 crore rupees** daily. This has kept short-term rates stable, with the one-year overnight index swap (OIS) rate settling near **5.50%** and the two-year rate at **5.64%**. Attention is now shifting toward Friday's major bond auction. Traders are also monitoring the **U.S. 10-year Treasury yield**, which has softened to approximately **4.05%** on expectations of global rate cuts. The combination of domestic debt management and stable inflation continues to support a neutral-to-positive outlook for Indian gilts.

Infosys Shares Decline Despite Increased Price Targets and $400 Billion AI Strategy
Infosys continues to navigate a complex structural shift as it pivots toward an AI-first future. During its February 2026 Investor AI Day, the company detailed an aggressive roadmap targeting an incremental AI services market estimated at **$300 billion to $400 billion** by 2030. Despite the long-term optimism, the market reaction has been sharp. As of February 18, 2026, Infosys shares traded near **₹1,365**, reflecting a **2.1%** intraday drop. This follows a broader period of volatility where the stock declined over **16%** since the start of February. The primary tension lies in the timing of financial impacts. Investors are currently weighing the immediate deflationary pressure on legacy revenues against the gradual ramp-up of AI-driven income. While AI is seen as a structural tailwind, it simultaneously automates traditional IT tasks, potentially squeezing traditional maintenance and development budgets. Management reported that AI-led services already contributed **5.5%** to total revenue in the third quarter of fiscal year 2026. This equates to approximately **$275 million** in quarterly AI-related income. The company is currently engaged in over **4,600** AI projects, with **90%** of its top 200 clients already adopting these solutions. Central to this strategy is the **Topaz Fabric**, a suite of over **600** pre-built AI agents designed to modernize legacy systems. A recent strategic partnership with Anthropic has further bolstered this ecosystem, integrating Claude models to automate complex industry workflows in telecommunications and financial services. Operational data shows a tangible shift toward high-value automation. The company has generated over **28 million** lines of code using AI internally, a **12%** sequential increase. Large deal momentum also remains stable, with a total contract value (TCV) of **$1.8 billion** secured in the most recent quarter. Financial guidance for the full year 2026 has been revised upward to a range of **3% to 3.5%** revenue growth in constant currency. However, operating margins remain under scrutiny, currently holding at **18.4%** due to increased investments in AI infrastructure and a commitment to hiring **20,000** new graduates to build a specialized talent pipeline. While brokerages maintain long-term buy ratings with targets reaching up to **₹2,050**, the near-term outlook is characterized by a "trust deficit." The market is waiting for evidence that AI revenue can grow fast enough to offset the inevitable compression of the traditional IT outsourcing model.

IMF Reaffirms Market Forces Will Determine Yen Valuation Amid Policy Monitoring
The Japanese yen is navigating a period of heightened volatility as global markets and domestic policy shifts reshape its trajectory. Following a recent snap election and significant political movement, the currency has seen aggressive swings. After touching levels above 159 against the U.S. dollar earlier this month, the USD/JPY pair has recently stabilized near the 153.50 mark. The International Monetary Fund (IMF) has reaffirmed its support for Japan’s flexible exchange-rate regime. Mission chief Rahul Anand emphasized that there is no "correct" level for the yen, stating that value should be determined by market forces to help the economy adjust to global shifts. This stance aligns with the Bank of Japan’s (BOJ) cautious withdrawal of monetary accommodation. Key Economic Indicators: - The BOJ maintained its policy rate at 0.75% in its most recent meeting, though a hike to 1.00% is widely anticipated by July 2026. - Inflation remains persistent, with Core CPI (excluding fresh food) projected to rise 2.7% for the current fiscal year before moderating toward 1.8% in 2026. - Japan’s GDP growth remains modest, eking out a 0.2% annualized expansion in the final quarter of 2025, with projections for 2026 hovering around 0.7% to 0.9%. - The 10-year Japanese Government Bond (JGB) yield recently touched a 27-year high of 2.38%, reflecting market pressure and shifting fiscal expectations. Market sentiment is currently driven by a "Buy Japan" narrative among some investors, spurred by the removal of political uncertainty following Prime Minister Takaichi’s election victory. This has led to a nearly 3% weekly jump in the yen, its largest in over a year, as long-term investors return to Japanese assets. However, the outlook remains complex. While rising nominal wages—expected to increase by over 5% in 2026—provide a tailwind for domestic consumption, the economy still lacks a strong singular growth driver. Real wages are only just beginning to turn positive as inflation shows signs of cooling due to government energy subsidies. The primary risk for the yen remains the divergence between Japanese and U.S. monetary policy. While the BOJ is gradually tightening, any delay in rate hikes or a shift toward more aggressive expansionary fiscal policy from the new administration could renew depreciation pressure on the currency. For now, the market is focusing on the March policy meeting and upcoming spring wage negotiations. These events will be critical in determining whether the yen can transition from a funding currency to a stable investment currency in the face of ongoing global uncertainty.

PSU Banks and Metals Remain Long-Term Attractive Amid Market Rally, According to Sudip Bandyopadhyay
Market Brief: PSU Banks & Metals Outlook **Banking Sector: The Valuation Gap** Public Sector Undertaking (PSU) banks continue to show strong momentum in early 2026. Despite a major rally over the past year, a significant valuation gap remains between state-owned lenders and their private sector peers. The Nifty PSU Bank index has outperformed the broader market recently, recording gains of over **2%** in single sessions this week. **Comparative Performance** State Bank of India (SBI) recently hit a market capitalization of over **₹11 lakh crore**, surpassing major IT firms. Its Price-to-Book (P/B) value has climbed to **2.41**, yet it still trades at a discount compared to private giants like ICICI Bank at **2.92**. Other PSU players like Union Bank and Bank of India have delivered year-to-date returns exceeding **15%**, driven by highest-ever quarterly profits and improved asset quality. **Credit Growth and Stability** Systemic credit growth for large PSU banks is projected at **13% to 15%** for the 2026 fiscal period. Gross Non-Performing Assets (GNPA) for lead lenders have stabilized near **1.57%**, with Capital Adequacy Ratios remaining robust above **14%**. This fundamental shift suggests the re-rating phase for public lenders is still active. **Metals: Structural Upcycle** The metals sector is navigating a long-term structural upcycle supported by global infrastructure demand and supply-side shifts. While the Nifty Metal index saw a brief **1%** dip this week due to global cues, the long-term outlook remains positive. Domestic demand in India continues to scale even during periods of global price volatility. **Commodity Trends and Prices** Industrial metals like copper have seen sharp movements, with companies like Hindustan Copper gaining over **15.5%** year-to-date. In the global market, Aluminum prices have faced corrections, sliding from **$3,116** to approximately **$2,995** per tonne in February. These fluctuations are viewed as natural consolidation phases within a larger bullish trend. **Precious Metals Context** Gold and silver have reached historic levels in early 2026. Gold is currently trading near **₹1,53,500** per 10 grams on domestic exchanges, while silver recently touched **₹2,35,206** per kg. Global analysts maintain high price targets for the year, citing central bank diversification and geopolitical risks as primary drivers. **Investor Strategy** Market sentiment remains constructive for both sectors. Selective entry into PSU banks remains favored due to their earnings visibility and narrowing discount to private banks. In metals, the "buy on dips" approach is prevalent, as supply-demand imbalances are expected to sustain prices throughout the 2026 calendar year.

Infosys AI Strategy Signals Strength Amid Valuation Concerns, According to Sandip Agarwal
INDIAN IT SECTOR: THE AI ASCENSION The Indian IT sector is currently navigating a pivotal transition from legacy service models to an AI-first paradigm. Despite short-term market volatility that wiped nearly 5 trillion rupees off the sector's market capitalization earlier this year, the industry is showing significant resilience. Analysts now point toward an "undervaluation" phase, with the Nifty IT index trading at a price-to-earnings ratio of 23x—notably below its 5-year median of 29.6x. Recent performance data signals a constructive recovery. Revenue growth for major large-cap firms has begun exceeding market expectations, with street estimates for the upcoming fiscal year projected between 5% and 8%. The industry is on a clear trajectory to hit the 300 billion dollar revenue milestone by FY2026. This growth is increasingly fueled by high-value, AI-driven deals rather than traditional maintenance contracts. Artificial Intelligence is no longer a peripheral experiment but a core revenue driver. Major players like TCS and HCL Tech have reported AI service revenues growing by nearly 20% on a quarter-on-quarter basis. TCS alone has reached an annualized AI revenue run rate of 1.8 billion dollars. The strategy has shifted from "effort-based" billable hours to "outcome-oriented" engagements, where human intelligence is augmented by agentic AI platforms. Workforce dynamics are undergoing a massive transformation to match this technical shift. India now ranks 3rd globally in AI vibrancy, with a talent pool reskilling at 2.5 times the global average. Large-cap firms have already trained hundreds of thousands of associates in advanced AI skills. While overall headcount growth remains measured, the demand for specialized roles in cloud, cybersecurity, and platform engineering has driven a 16% jump in IT job demand compared to the previous year. Valuations remain a focal point for investors as the sector pivots. While some stocks faced pressure due to concerns over AI cannibalizing traditional business, recent strategic partnerships—such as Infosys collaborating with Anthropic—have restored confidence. The emergence of Global Capability Centers (GCCs) as innovation hubs further strengthens the ecosystem, with their share of talent demand rising to approximately 27%. The sector’s robust business models are being structurally redesigned to reduce delivery bottlenecks. With the digital economy now contributing an estimated 12% to India's GDP, the IT industry is repositioning itself from a cost-effective outsourcing destination to a global leader in trusted, innovation-driven digital services. [Indian IT Sector Outlook](https://www.youtube.com/watch?v=yzQ_5pcVxsw) This video provides a detailed breakdown of the recent Q3 earnings for major Indian IT firms, highlighting the specific revenue growth coming from AI and the stabilization of guidance for the upcoming fiscal year. http://googleusercontent.com/youtube_content/0

Impact of Repo Rate Reductions on Market Borrowing Costs
The Indian bond market is currently experiencing a notable disconnect between central bank actions and market yields. Despite a cumulative **125 basis point** reduction in the repo rate during this easing cycle, benchmark yields remain stubbornly high. As of February 2026, the **10-year G-Sec yield** is hovering around **6.65% to 6.67%**, holding steady even as the Reserve Bank of India (RBI) maintains a neutral stance. This creates a spread of approximately **140 to 150 basis points** over the current repo rate of **5.25%**, a gap rarely seen during easing phases. Structural liquidity tightness within the banking system is the primary driver of this trend. While the RBI has kept rates on hold in its latest February meeting to assess the impact of previous cuts, banks are struggling with a widening credit-to-deposit gap. Credit growth is currently outpacing deposit mobilization by roughly **200 to 300 basis points**, pushing the system-wide credit-to-deposit ratio to a historic high of **81.75%**. Domestic banks, the traditional backbone of the G-Sec market, are facing severe margin pressures. Net Interest Margins (NIMs) have compressed by **10 to 15 basis points** for many private lenders as the cost of funds rises. Consequently, banks are prioritizing high-yield lending over government securities, leading to thinner demand for sovereign paper. To address these challenges, the RBI has deployed proactive liquidity measures. Since December, the central bank has conducted Open Market Operation (OMO) purchases totaling **₹3.5 lakh crore** and long-term forex swaps of **$15.1 billion**. These interventions aim to ensure that surplus liquidity, which has recently averaged **₹70,000 crore** per day, remains durable enough to support policy transmission. Foreign Portfolio Investor (FPI) activity remains a critical variable. While inclusion in global bond indices has provided a structural tailwind, capital flows have been volatile. A net outflow of **$3.9 billion** was recorded as of late 2025, largely due to global shifts toward AI-centric markets in the US and East Asia. However, recent regulatory reforms—including the removal of the **₹2.5 lakh crore** cap under the Voluntary Retention Route (VRR)—are expected to stabilize debt inflows. The outlook for the remainder of the year suggests a gradual softening. Analysts project the 10-year yield could ease toward **6.54%** over the next **12 months** if headline inflation stays near the projected **2.1%** for the fiscal year. For now, the market remains in a "wait and watch" mode, balancing the supply of new government debt against the central bank's efforts to keep the financial system sufficiently oiled. [Indian Government Bond Market Outlook](https://www.youtube.com/watch?v=_gyaY5WdLfY) This video provides additional context on recent Union Budget reforms and their direct impact on attracting global investors to the Indian bond market. http://googleusercontent.com/youtube_content/0
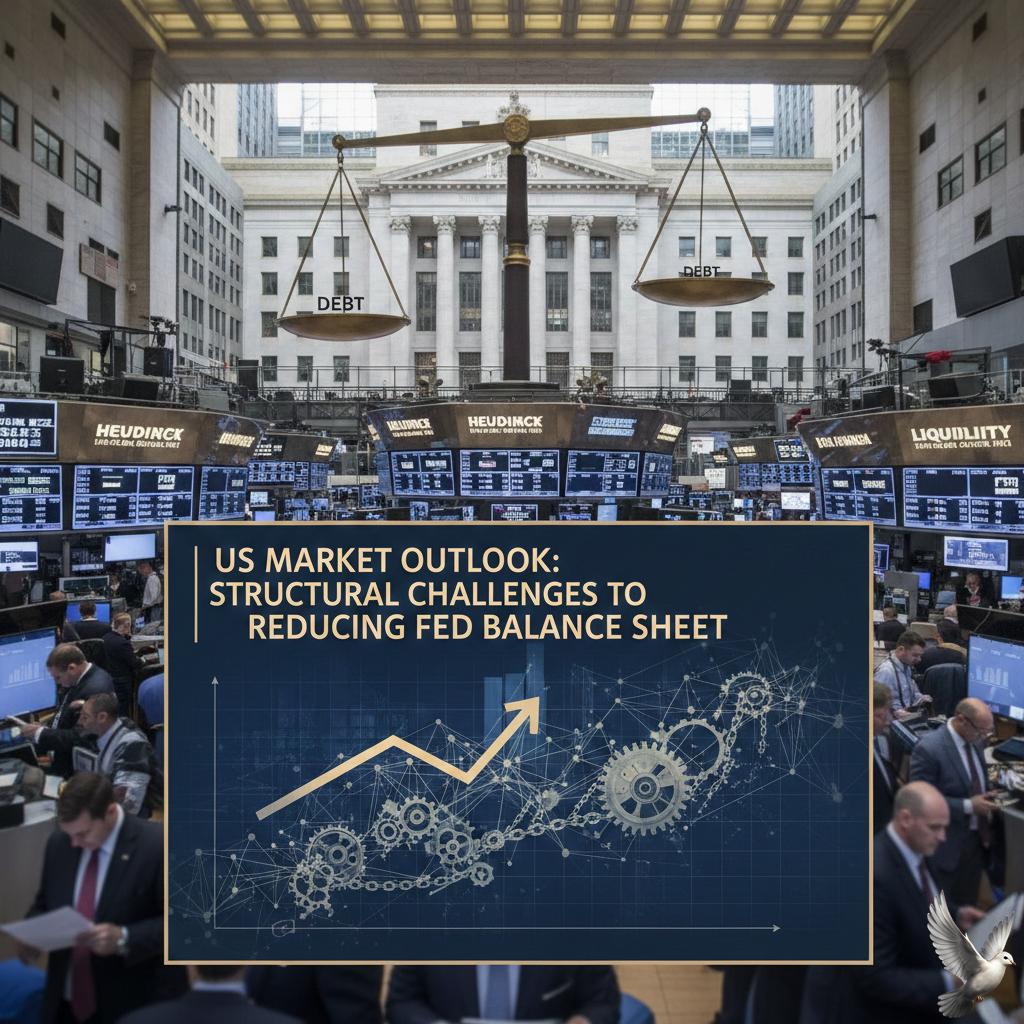
US Market Outlook: Structural Challenges to Reducing Federal Reserve Balance Sheet
Market Brief: Federal Reserve Leadership & Policy Shift The nomination of **Kevin Warsh** to succeed Jerome Powell as Federal Reserve Chair in **May 2026** has introduced a new "Warsh Turbulence" into financial markets. While historically viewed as an inflation hawk, Warsh’s recent stance suggests a dual-track strategy: aggressive reduction of the Fed's balance sheet alongside a push for deeper interest rate cuts. Balance Sheet Reality Check The Federal Reserve’s total assets currently stand at approximately **$6.62 trillion** as of mid-February 2026. This represents a decline from **$6.81 trillion** a year ago, but remains significantly "bloated" compared to pre-pandemic levels. Warsh has publicly advocated for a smaller central bank footprint, arguing that the current scale crowds out private sector credit and distorts market signals. * **Treasury Holdings:** **$4.29 trillion** * **Mortgage-Backed Securities:** **$2.02 trillion** * **Bank Reserve Balances:** **$2.94 trillion** The Reserve Constraint Shrinking the balance sheet to Warsh’s ideal level faces structural headwinds. The U.S. banking system currently operates under an "ample reserves" regime. Financial institutions require substantial liquidity to meet regulatory standards and manage daily payment flows. If reserves fall too low—approaching the **$2.5 trillion** "scarcity" threshold—volatility in the repo and overnight funding markets typically spikes. This was evidenced in late 2025 when the FOMC briefly halted quantitative tightening (QT) due to reserve concerns. Divergent Policy Signals Warsh’s proposal to "run the printing press a little quieter" while lowering short-term rates creates a complex outlook for the yield curve. Analysts anticipate a "steeper" curve, where short-term rates drop to support growth, but long-term Treasury yields face upward pressure as the Fed ceases to be a primary buyer. The market is currently pricing in at least **two 0.25% rate cuts** in the second half of 2026, bringing the federal funds target down from its current **3.50–3.75%** range. Market Reaction and Volatility Following the nomination, markets responded with immediate adjustments. Gold and silver prices retreated from all-time highs, dropping **9%** and **26%** respectively, as the U.S. Dollar recovered from four-year lows. The transition period remains sensitive. Senatorial hurdles and ongoing investigations into central bank operations could delay the confirmation process, potentially leaving a leadership vacuum as Powell’s term nears its end. Investors are closely watching for signs of "mission creep" and the balance between political pressure for lower rates and the Fed's independent mandate for price stability.

Outlook on FMCG and IT Sectors: Sunil Subramaniam
Market Brief: India Strategic Outlook 2026 The Indian market is navigating a complex transition as the economy moves from essential-heavy spending toward a diversified, discretionary consumption model. While traditional segments face structural shifts, the technology and manufacturing sectors are absorbing record levels of capital. Consumer Consumption and Rural Dynamics Consumer staples have experienced a period of relative lag, influenced by the implementation of **GST 2.0**. This major reform has reduced taxes on essentials to a **5%** bracket while hiking luxury and "sin" goods to **40%**. Recent data indicates a structural pivot: food’s weight in the Consumer Price Index (CPI) has dropped from **46%** to approximately **37%**. Households are increasingly reallocating budgets toward services, digital media, and premium lifestyle products. Rural demand remains the primary swing factor. With nearly **45%** of farmers dependent on rain, the outlook for 2026 hinges on a favorable monsoon. Early forecasts of normal rainfall are expected to bolster rural incomes, which have recently outpaced urban growth rates in several quarters. Technology and the AI Valuation Reset The technology sector is at a critical entry point. The Nifty IT index recently weathered an **8.2%** weekly decline—its sharpest in ten months—wiping out **$50 billion** in market capitalization as investors priced in disruption risks. Despite this volatility, firms are aggressively pivoting. IT spending in India is projected to reach **$176.3 billion** in 2026, a **10.6%** increase over the previous year. * **Software spending** is expected to rise **17.6%** to **$24.7 billion**. * **Data center investments** are leading growth at a **20.5%** annual rate. * Major players have committed over **$200 billion** to the AI value chain over the next two years. Strategic partnerships, such as recent collaborations between Indian IT majors and global AI labs, are shifting the focus from labor arbitrage to "agentic AI" and specialized industry solutions. Manufacturing and Foreign Investment Manufacturing growth is accelerating through a "China-plus-one" strategy and deep-tech partnerships. FDI inflows reached **$50.36 billion** in the first half of the current fiscal year, a **16%** year-on-year increase. Global alliances are providing the necessary scale: * The **EFTA trade pact** has secured a **$100 billion** investment commitment over 15 years. * The **Production Linked Incentive (PLI)** for electronics was recently doubled in the 2026 Budget. * Semiconductor and hardware manufacturing are seeing a surge in capital, supported by a **₹40,000 crore** electronic component scheme. Success in this sector remains tied to effective technology transfer and the expansion of Global Capability Centers (GCCs), which are evolving from back-office hubs into core strategic partners for international parent companies.

Indian Rupee edges up to 90.67 against US Dollar in early trade
The Indian Rupee recorded a marginal gain of **6 paise** during early trade on Wednesday, February 18, 2026, opening at **90.64** against the US Dollar. This performance reflects a slight recovery from the previous session's close of **90.67**, as the currency navigates a landscape defined by cooling energy costs and fluctuating institutional flows. A primary tailwind for the Rupee is the softening of global crude prices. West Texas Intermediate (WTI) futures are currently trading near **$62 per barrel**, while Brent crude has retreated toward the **$67** mark. This downward trend is largely attributed to progress in U.S.-Iran diplomatic discussions, which has effectively reduced the geopolitical risk premium that previously inflated oil costs. Institutional investment activity remains a critical variable for domestic currency stability. While Foreign Institutional Investors (FIIs) have shown early signs of a strategic shift—turning net buyers in **eight of the last thirteen** sessions—the momentum is currently described as cautious. Recent data shows a minor net equity outflow of **₹214 crore**, though these pressures are being balanced by the consistent "shock absorber" role of Domestic Institutional Investors (DIIs). Domestic equity markets started the day on a flat to choppy note. The **BSE Sensex** hovered near **83,438**, while the **Nifty 50** struggled to maintain the **25,700** level, down roughly **9 points** in early exchanges. This lukewarm stock market performance has acted as a ceiling for the Rupee's appreciation, keeping gains modest. Foreign exchange reserves remain a pillar of support for the currency, despite a recent dip. India’s reserves currently stand at **$717.6 billion**, providing an import cover of over **11 months**. While the reserves fell by **$6.7 billion** in the most recent reporting week due to valuation changes in non-dollar assets and gold holdings, the overall buffer remains robust by historical standards. Market analysts expect the Rupee to remain range-bound in the near term. Traders are closely monitoring upcoming global triggers, specifically the Federal Open Market Committee (FOMC) meeting minutes and U.S. durable goods orders. These data points will influence the **Dollar Index**, which is currently holding around **97.23**, and ultimately dictate the Rupee's direction in the final sessions of the week.

The Expansion of Institutional Investment Strategies in Private Credit
Private Credit: The New Capital Standard The Indian financial landscape is undergoing a structural transformation as private credit shifts from an alternative niche to a cornerstone of modern capital stacks. In the first half of fiscal **2026**, this momentum has accelerated, driven by a widening investor base and a significant wave of corporate refinancing. Current data shows that private credit deal volumes in India reached approximately **$9 billion** in the first half of **2025**, marking a **53%** increase over the previous year. Total assets under management (AUM) for the sector have now scaled beyond **$30 billion**, establishing India as the largest and most active private credit market in Asia. Market Dynamics and Yields While traditional bank credit remains substantial, crossing the **₹200 lakh crore** milestone in early **2026**, private credit is capturing the high-growth, bespoke segment of the market. Investors are increasingly drawn to the asset class for its "capital scarcity premium." Senior secured and unitranche transactions in India are currently pricing in the **14% to 18%** range. More complex, distressed, or special situation debt can see yields climbing toward **19.75%**, offering a significant spread over traditional fixed-income instruments. Sectoral Leadership and Deployment Capital allocation is increasingly concentrated in capital-intensive sectors where traditional lenders have retreated due to tighter regulatory constraints. * **Infrastructure & Data Centers:** Leading the charge, driven by a **$1.5 trillion** capital expenditure outlook for digital infrastructure. * **Real Estate & Logistics:** Utilizing structured credit for bridge financing and last-mile funding. * **Healthcare & Manufacturing:** Seeking flexible, long-dated financing for capacity expansion. Nearly **17%** of the capital deployed in recent months has been directed toward forward-looking growth initiatives, including strategic acquisitions and capacity building. Structural Evolution The market is entering a mature phase characterized by "institutionalization." Deal sizes are expanding, with transactions exceeding **$100 million** becoming standard for mid-to-large corporates. New fund structures are also democratizing access. Evergreen and semi-liquid vehicles are allowing wealth managers and family offices to participate alongside global institutional investors. This influx of domestic capital is complementing the **55%** of inflows historically provided by global funds. Risk and Resilience As the market scales, risk is shifting from being opaque to being "priceable." Improved recovery prospects under the Insolvency and Bankruptcy Code (IBC) and tighter underwriting standards have bolstered investor confidence. While the global private credit default rate is often cited below **2%**, analysts suggest a "true" rate closer to **5%** when accounting for selective defaults and liability management. In India, robust collateral frameworks and strengthened covenant packages are being used to manage these pressures as the market faces its first major test through a full credit cycle. Private credit now functions as a vital, permanent component of the financial ecosystem, providing the flexible, growth-oriented capital required for the next phase of Indian corporate evolution.

US Market Outlook: Federal Reserve Policy Priorities Amid Inflation, AI, and Labor Trends
San Francisco Fed President Mary Daly recently reaffirmed the central bank’s commitment to a restrictive policy stance, emphasizing that inflation reduction remains the primary objective. Despite market optimism regarding artificial intelligence, Daly noted a significant lack of macroeconomic evidence showing an AI-driven productivity surge. The Federal Reserve is currently maintaining the federal funds rate in a target range of 3.50% to 3.75%. While the central bank implemented three rate cuts in late 2025, the FOMC voted 10–2 in late January 2026 to hold rates steady. This "hawkish pause" reflects concerns over core inflation, which remains stubbornly elevated near 3.0%. Macroeconomic data highlights a complex economic landscape. Headlines show the U.S. economy is projected to grow by 2.25% to 2.5% in 2026. However, the labor market is entering a "selective thaw" characterized by a "low-hire, low-fire" environment. Job openings have plummeted to 6.5 million, the lowest level since 2020. Labor market vulnerabilities are becoming more apparent as hiring becomes highly concentrated. In January 2026, the healthcare sector accounted for 123,500 new jobs, nearly four times the gains of any other sector. Meanwhile, professional and business services saw a sharp decline of 257,000 openings, suggesting that firms are exercising extreme caution. The impact of AI on corporate earnings remains uneven. While "Magnificent Seven" tech giants are projected to see 18% earnings growth this year fueled by a combined $700 billion in capital expenditure, the rest of the S&P 500 expects a more modest 11% increase. Analysts suggest that most companies outside the tech sector have yet to see AI translate into improved profit margins. Daly drew historical parallels to the 1990s tech boom, suggesting that while AI could eventually boost productivity by 0.3% to 0.6% annually, the economy is "not there yet." For now, the Fed remains focused on ensuring that growth does not reignite price pressures, with the next potential rate cut not anticipated by markets until June 2026. Current indicators show headline PCE inflation at 2.4% and core PCE at 2.5%, down from 3.0% in late 2025. Despite this progress, officials like Daly and Governor Michael Barr signal that rates must remain steady to ensure a sustainable return to the 2% target. Business leaders continue to navigate this environment by prioritizing efficiency over aggressive payroll expansion.

Silver and Gold Prices Rise as Precious Metals Rebound Despite Easing Geopolitical Tensions
Precious Metals Market Brief **February 18, 2026** Precious metals are navigating a complex landscape today as early gains on the **MCX** struggle against shifting global sentiments. While futures opened with upward momentum, a broader correction is underway across both gold and silver. Gold Performance and Trends Gold prices have pulled back from recent historic highs, currently hovering near **$4,880** per ounce in international spot markets. On the domestic front, **MCX Gold** futures have softened to approximately **₹74,500** per 10 grams, marking a significant intraday decline of nearly **₹1,800**. Physical gold rates in major Indian cities reflect this cooling trend. In **Delhi** and **Mumbai**, 24K gold is retailing around **₹15,435 to ₹15,450** per gram, a drop of roughly **1.4%** from the previous session. This correction follows a volatile period where prices peaked at over **₹16,000** earlier this month. Silver’s Sharp Correction Silver is experiencing much higher volatility compared to gold. **MCX Silver** futures have crashed to **₹2,60,000** per kg, a sharp daily drop of **₹8,000** or roughly **3%**. This follows a massive rally in January where the metal surged by **47%**, reaching levels as high as **₹4,10,000** per kg. The current downturn is attributed to a "double-hit" on silver’s dual identity. As a safe haven, it is losing ground due to geopolitical de-escalation; as an industrial metal, it is under pressure from a strengthening **US Dollar Index** and a temporary dip in tech-sector demand. Key Market Drivers Geopolitical tensions are providing less support for prices as progress in **US-Iran negotiations** in Geneva fuels hopes for regional stability. This de-escalation has reduced the "fear premium" that previously drove investors toward bullion. Simultaneously, a resilient US labor market—evidenced by recent jobs data—has shifted expectations for **Federal Reserve** rate cuts. Investors now anticipate the first cut may not arrive until **July 2026**, bolstering the dollar and increasing the opportunity cost of holding non-yielding metals. Market Outlook Domestic physical demand remains steady in regions like **Kolkata** and **Chennai** due to wedding season preparations, which may provide a soft floor for prices. However, institutional analysts are currently advising caution. With the **Relative Strength Index (RSI)** for silver recently hitting overbought levels near **75**, further technical corrections are possible. Market participants are largely "fence-sitting" this week, avoiding fresh positions until clearer signals emerge from upcoming global economic data.

Dilip Buildcon Surges 4% After Securing L1 Status for ₹702 Crore Gujarat Flood Control Project
Dilip Buildcon has reached a significant operational milestone, emerging as the lowest bidder (L1) for a major flood protection project in Gujarat. The contract, valued at **668.02 crore**, focuses on constructing an embankment along the Narmada River in the Bharuch district. The project is structured on an Engineering, Procurement, and Construction (EPC) basis. The company is expected to complete the works within a **24-month** timeline. This win further strengthens the firm’s presence in Gujarat, following a recent **124 crore** contract for an air turbine fuel pipeline. As of February 18, 2026, Dilip Buildcon’s share price reacted positively to the news, surging over **3.6%** to reach approximately **450.70**. The company’s market capitalization currently stands near **7,065 crore**, reflecting investor confidence despite recent volatility in the broader infrastructure sector. The company’s order book has now hit an all-time high of approximately **29,372 crore**. This record backlog provides multi-year revenue visibility, with the portfolio well-diversified across roads, mining, irrigation, and water supply. Management has guided for a revenue recovery in the coming fiscal year, targeting the **10,000 crore** mark. Financially, the firm reported a consolidated revenue of **2,138 crore** for the December quarter. While operational revenue saw some pressure, the net profit surged to **789 crore**, bolstered by a one-time gain of **585 crore** from the monetization of road assets through its InvIT platform. The broader Indian infrastructure sector remains a primary growth driver for the economy. The Union Budget 2026–27 has allocated a record **12.2 lakh crore** for capital expenditure, a **12%** increase over the previous year. This sustained fiscal support is expected to drive an **8.8%** compound annual growth rate in construction through 2030. Dilip Buildcon is currently focused on deleveraging its balance sheet. Net debt has been reduced significantly from its peak of **3,392 crore**, while the company maintains a disciplined annual capital expenditure of roughly **100 crore**. Analysts maintain a target price range between **458** and **514** as the company transitions toward a leaner, asset-light operating model. The Bharuch project is critical for regional safety, designed to mitigate flood risks from the Narmada River. For the company, it represents a successful expansion into specialized water infrastructure, a segment that is seeing increased government tendering activity across the country. [Dilip Buildcon Q3 FY26 Results and Growth Outlook](https://www.google.com/search?q=https://www.youtube.com/watch%3Fv%3DKshvN9zG3i8) This video provides an in-depth analysis of the company's record-high order book and its strategic shift towards high-margin infrastructure projects.

India’s AIF Assets Reach Rs 15 Lakh Crore Amid Growth in Domestic Capital and Liquidity
India's AIF Industry: Market Brief February 2026 India's Alternative Investment Fund (AIF) industry has reached a historic milestone, with total cumulative commitments surging past **₹15.74 lakh crore**. This rapid expansion represents a doubling of the market size since 2022, signaling that alternative assets have transitioned from a niche interest to a core component of Indian wealth management. The Rise of Domestic Dominance A fundamental shift in the capital mix is now evident. Domestic investors currently contribute approximately **55%** of total commitments in Category I and II funds. This local anchoring reduces the industry's reliance on volatile global liquidity cycles. High-net-worth individuals, family offices, and increasingly, domestic institutions are filling the space once dominated by foreign capital. Performance and Alpha Generation AIFs continue to demonstrate significant outperformance compared to traditional public markets. Recent data indicates that equity-oriented AIFs have delivered a consistent alpha of **8.69%** over the BSE Sensex TRI. Across multiple benchmarking cycles, the industry has achieved a pooled internal rate of return (IRR) of **24.02%**, far outpacing the **15.3%** seen in public indices. Liquidity through Secondary Markets The emergence of a robust secondary market is addressing the traditional "lock-in" challenge of private capital. Secondary deal values reached **₹361 billion** in the first half of the current fiscal year alone, nearly matching the entire previous year's volume. This provides investors with crucial exit pathways and capital recycling options outside of traditional IPO windows. Sector Concentration and Efficiency Category II funds, which include private equity and private credit, remain the industry heavyweight with **₹11.64 lakh crore** in commitments. Deployment efficiency has also improved significantly, with investments made as a percentage of funds raised reaching **96.2%**. While the top five sectors formerly accounted for 85% of activity, that concentration has dropped to **66%**, with capital now flowing into manufacturing, health tech, and climate-focused enterprises.
**Infosys Shares Monitored Amid $400 Billion AI-First Strategy and Varied Brokerage Ratings**
Market Brief: Infosys Strategic Pivot and Performance Update Infosys shares are trading under a spotlight this February 18, 2026, following the high-profile **Investor AI Day 2026**. The company is aggressively positioning itself as an "AI-first" leader through its **Infosys Topaz** framework. Management has identified a massive incremental opportunity for AI services, projected to reach between **$300 billion and $400 billion** by 2030. This shift marks a transition from experimental AI projects to scaled enterprise deployment. Financial Snapshot and Growth The Q3FY26 results revealed a robust revenue performance, with operations generating **₹45,479 crore**, reflecting a **9%** year-on-year growth. Despite a slight marginal slip in net profit to **₹6,654 crore**, the company remains financially resilient. Large deal momentum continues to be a primary growth driver. In the December quarter, Infosys secured contracts worth **$4.8 billion**, including a landmark **$1.6 billion** deal with the UK’s National Health Service. Strategic AI Roadmap The "AI-first" strategy is now operational across the organization. Currently, nearly **90%** of the company's top 200 clients are engaged in AI-related projects. Strategic partnerships are expanding the ecosystem. A new collaboration with **Anthropic** will integrate Claude models into the Topaz platform, while a partnership with **Cursor** aims to accelerate AI-driven software engineering. Market Valuation and Ratings As of mid-session today, the share price on the NSE is hovering around **₹1,359.40**, reflecting some near-term volatility following a recent sector-wide selloff. Brokerages maintain a generally positive long-term outlook. **Motilal Oswal** has reiterated a Buy rating with a target price as high as **₹1,850**, citing 33% upside potential. **Morgan Stanley** remains more cautious with an Equal Weight rating, highlighting that while the opportunity is vast, execution and the evolution of billing models remain key watchpoints. Key Guidance for 2026 Infosys has raised its revenue growth guidance for the full financial year to between **3% and 3.5%** in constant currency terms. Operating margins are expected to remain stable within the **20% to 22%** range. To support this technical evolution, the company plans to hire **20,000** graduates in FY27, focusing specifically on strengthening its global AI delivery capabilities.

Indian Benchmarks Trade Flat as IT Losses Offset Gains in Metal and PSU Bank Sectors
Market Brief: Indian Benchmarks Hold Steady Amid Sectoral Divergence Indian equity benchmarks, **Sensex** and **Nifty 50**, are exhibiting a resilient but cautious performance as of February 18, 2026. The market is currently balancing between a robust rally in industrial sectors and a persistent, technology-driven selloff. Performance Indicators The **BSE Sensex** is trading near **83,428**, showing a marginal dip of **0.03%** or **22 points**. Similarly, the **NSE Nifty 50** remains stable around the **25,722** level. Despite the flat movement in frontline indices, the broader market shows significant strength. The **BSE SmallCap** index has surged by **0.45%**, while the **MidCap** index is up **0.26%**, indicating healthy buying interest in smaller-sized companies. Sectoral Winners and Losers Metal and Public Sector Undertaking (PSU) stocks continue to provide the primary upward momentum. The **Nifty PSU Bank** index has seen gains of over **2%**, supported by strong quarterly earnings and valuation re-ratings. Metal counters are also benefiting from a recovery in global commodity prices. In contrast, the Information Technology (IT) sector is facing a severe valuation correction. The **Nifty IT** index has faced a sharp decline, with major players losing significant market capitalization. This "AI-scare" has wiped out approximately **$56 billion** in sector value over recent sessions as investors weigh the impact of new automation tools on traditional outsourcing models. Key Stock Movements Individual stocks are witnessing sharp volatility based on specific corporate developments: * **Tech Mahindra**: The stock has dropped **2.15%** to trade at **₹1,491**, reflecting the broader weakness in tech exports. * **Kwality Wall's (India)**: Recently listed after its demerger from HUL, the stock plummeted **6.24%** to **₹27.94**, continuing its post-listing price discovery phase. * **Dilip Buildcon**: Surged **3.39%** following a successful **₹702 crore** bid for a government project. * **Bharat Heavy Electricals (BHEL)**: Gained **0.65%** after securing a major power plant contract valued between **₹1,200—1,500 crore**. Global and Macro Context The domestic sentiment is supported by positive cues from the Asia-Pacific region, with Japan’s **Nikkei 225** advancing nearly **1%**. Additionally, institutional activity remains supportive; foreign portfolio investors (FPIs) were net buyers of shares worth **₹995 crore** in the previous session. The Indian Rupee has strengthened slightly to **90.67** against the US Dollar, while the 10-year bond yield has inched up to **6.67%**. These indicators suggest a market that is consolidating its recent gains while shifting capital from high-valuation tech stocks toward infrastructure and state-owned enterprises.